Probability can be used for more than calculating the likelihood of one event; it can summarize the likelihood of all possible outcomes.
A thing of interest in probability is called a random variable, and the relationship between each possible outcome for a random variable and their probabilities is called a probability distribution.
Probability distributions are an important foundational concept in probability and the names and shapes of common probability distributions will be familiar. The structure and type of the probability distribution varies based on the properties of the random variable, such as continuous or discrete, and this, in turn, impacts how the distribution might be summarized or how to calculate the most likely outcome and its probability.
In this post, you will discover a gentle introduction to probability distributions.
After reading this post, you will know:
- Random variables in probability have a defined domain and can be continuous or discrete.
- Probability distributions summarize the relationship between possible values and their probability for a random variable.
- Probability density or mass functions map values to probabilities and cumulative distribution functions map outcomes less than or equal to a value to a probability.
Kick-start your project with my new book Probability for Machine Learning, including step-by-step tutorials and the Python source code files for all examples.
Let’s get started.

A Gentle Introduction to Probability Distributions
Photo by Tom Long, some rights reserved.
Overview
This tutorial is divided into four parts; they are:
- Random Variables
- Probability Distribution
- Discrete Probability Distributions
- Continuous Probability Distributions
Random Variables
A random variable is a quantity that is produced by a random process.
In probability, a random variable can take on one of many possible values, e.g. events from the state space. A specific value or set of values for a random variable can be assigned a probability.
In probability modeling, example data or instances are often thought of as being events, observations, or realizations of underlying random variables.
— Page 336, Data Mining: Practical Machine Learning Tools and Techniques, 4th edition. 2016.
A random variable is often denoted as a capital letter, e.g. X, and values of the random variable are denoted as a lowercase letter and an index, e.g. x1, x2, x3.
Upper-case letters like X denote a random variable, while lower-case letters like x denote the value that the random variable takes.
— Page viii, Probability: For the Enthusiastic Beginner, 2016.
The values that a random variable can take is called its domain, and the domain of a random variable may be discrete or continuous.
Variables in probability theory are called random variables and their names begin with an uppercase letter. […] Every random variable has a domain—the set of possible values it can take on.
— Page 486, Artificial Intelligence: A Modern Approach, 3rd edition, 2009.
A discrete random variable has a finite set of states: for example, colors of a car. A random variable that has values true or false is discrete and is referred to as a Boolean random variable: for example, a coin toss. A continuous random variable has a range of numerical values: for example, the height of humans.
- Discrete Random Variable. Values are drawn from a finite set of states.
- Boolean Random Variable. Values are drawn from the set of {true, false}.
- Continuous Random Variable. Values are drawn from a range of real-valued numerical values.
A value of a random variable can be specified via an equals operator: for example, X=True.
The probability of a random variable is denoted as a function using the upper case P or Pr; for example, P(X) is the probability of all values for the random variable X.
The probability of a value of a random variable can be denoted P(X=True), in this case indicating the probability of the X random variable having the value True.
Want to Learn Probability for Machine Learning
Take my free 7-day email crash course now (with sample code).
Click to sign-up and also get a free PDF Ebook version of the course.
Probability Distribution
A probability distribution is a summary of probabilities for the values of a random variable.
As a distribution, the mapping of the values of a random variable to a probability has a shape when all values of the random variable are lined up. The distribution also has general properties that can be measured. Two important properties of a probability distribution are the expected value and the variance. Mathematically, these are referred to as the first and second moments of the distribution. Other moments include the skewness (3rd moment) and the kurtosis (4th moment).
You may be familiar with the mean and variance from statistics, where the concepts are generalized to random variable distributions other than probability distributions.
The expected value is the average or mean value of a random variable X. This is the most likely value or the outcome with the highest probability. It is typically denoted as a function of the uppercase letter E with square brackets: for example, E[X] for the expected value of X or E[f(x)] where the function f() is used to sample a value from the domain of X.
The expectation value (or the mean) of a random variable X is denoted by E(X) …
— Page 134, Probability: For the Enthusiastic Beginner, 2016.
The variance is the spread of the values of a random variable from the mean. This is typically denoted as a function Var; for example, Var(X) is the variance of the random variable X or Var(f(x)) for the variance of values drawn from the domain of X using the function f().
The square root of the variance normalizes the value and is referred to as the standard deviation. The variance between two variables is called the covariance and summarize the linear relationship for how two random variables change together.
- Expected Value. The average value of a random variable.
- Variance. The average spread of values around the expected value.
Each random variable has its own probability distribution, although the probability distribution of many different random variables may have the same shape.
Most common probability distributions can be defined using a few parameters and provide procedures for calculating the expected value and the variance.
The structure of the probability distribution will differ depending on whether the random variable is discrete or continuous.
Discrete Probability Distributions
A discrete probability distribution summarizes the probabilities for a discrete random variable.
The probability mass function, or PMF, defines the probability distribution for a discrete random variable. It is a function that assigns a probability for specific discrete values.
A discrete probability distribution has a cumulative distribution function, or CDF. This is a function that assigns a probability that a discrete random variable will have a value of less than or equal to a specific discrete value.
- Probability Mass Function. Probability for a value for a discrete random variable.
- Cumulative Distribution Function. Probability less than or equal to a value for a random variable.
The values of the random variable may or may not be ordinal, meaning they may or may not be ordered on a number line, e.g. counts can, car color cannot. In this case, the structure of the PMF and CDF may be discontinuous, or may not form a neat or clean transition in relative probabilities across values.
The expected value for a discrete random variable can be calculated from a sample using the mode, e.g. finding the most common value. The sum of probabilities in the PMF equals to one.
Some examples of well known discrete probability distributions include:
- Poisson distribution.
- Bernoulli and binomial distributions.
- Multinoulli and multinomial distributions.
- Discrete uniform distribution.
Some examples of common domains with well-known discrete probability distributions include:
- The probabilities of dice rolls form a discrete uniform distribution.
- The probabilities of coin flips form a Bernoulli distribution.
- The probabilities car colors form a multinomial distribution.
Continuous Probability Distributions
A continuous probability distribution summarizes the probability for a continuous random variable.
The probability distribution function, or PDF, defines the probability distribution for a continuous random variable. Note the difference in the name from the discrete random variable that has a probability mass function, or PMF.
Like a discrete probability distribution, the continuous probability distribution also has a cumulative distribution function, or CDF, that defines the probability of a value less than or equal to a specific numerical value from the domain.
- Probability Distribution Function. Probability for a value for a continuous random variable.
- Cumulative Distribution Function. Probability less than or equal to a value for a random variable.
As a continuous function, the structure forms a smooth curve.
Some examples of well-known continuous probability distributions include:
- Normal or Gaussian distribution.
- Power-law distribution.
- Pareto distribution.
Some examples of domains with well-known continuous probability distributions include:
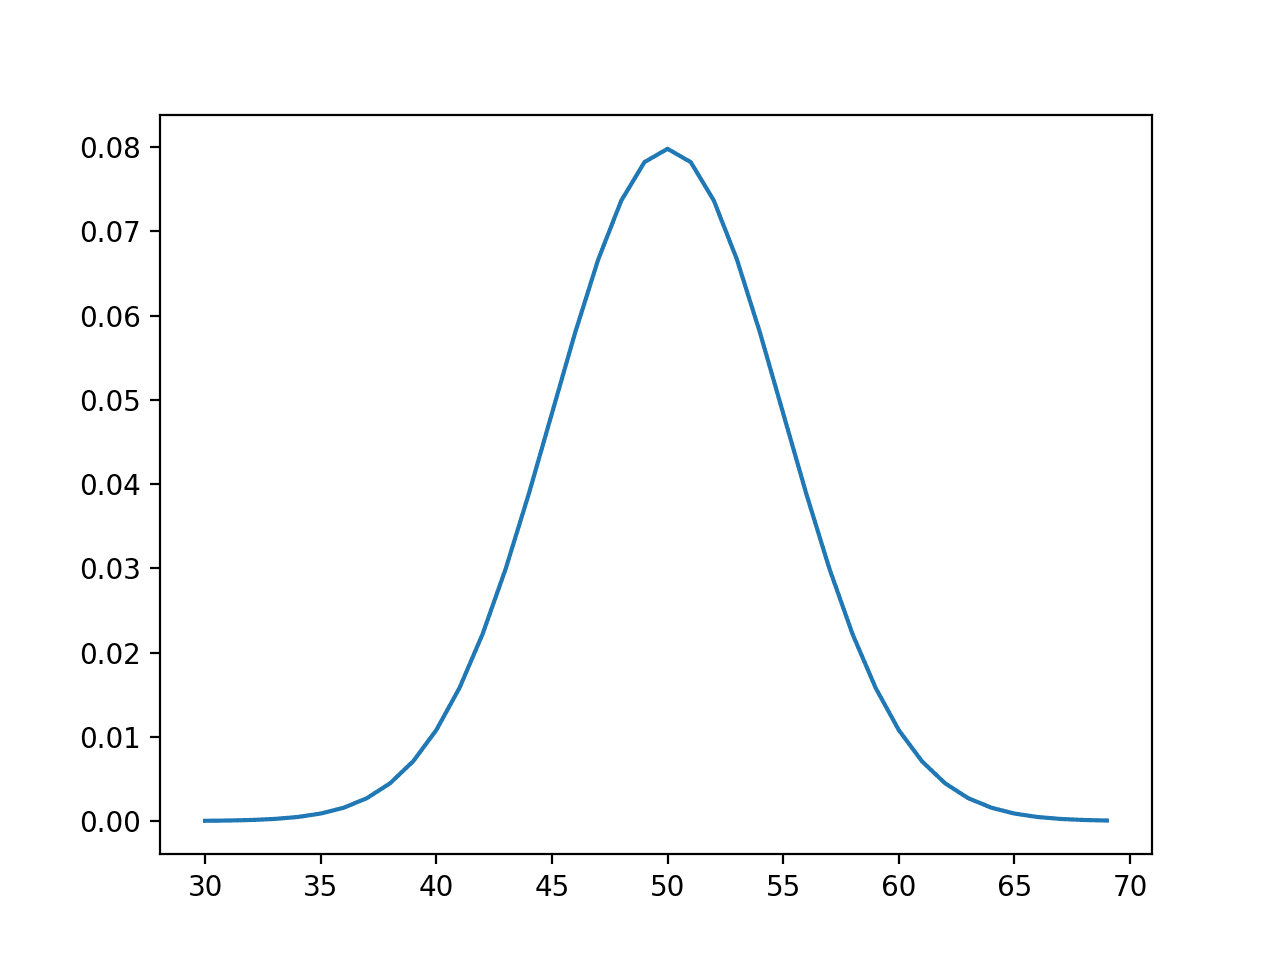
- The probabilities of the heights of humans form a Normal distribution.
- The probabilities of movies being a hit form a Power-law distribution.
- The probabilities of income levels form a Pareto distribution.
Further Reading
This section provides more resources on the topic if you are looking to go deeper.
Books
- Probability Theory: The Logic of Science, 2003.
- Introduction to Probability, 2nd edition, 2019.
- Probability: For the Enthusiastic Beginner, 2016.
Articles
- Random variable, Wikipedia.
- Moment (mathematics), Wikipedia.
- Probability distribution, Wikipedia.
- List of probability distributions, Wikipedia.
Summary
In this post, you discovered a gentle introduction to probability distributions.
Specifically, you learned:
- Random variables in probability have a defined domain and can be continuous or discrete.
- Probability distributions summarize the relationship between possible values and their probability for a random variable.
- Probability density or mass functions map values to probabilities and cumulative distribution functions map outcomes less than or equal to a value to a probability.
Do you have any questions?
Ask your questions in the comments below and I will do my best to answer.



Thank you for the post. Is Weibull distribution used in machine learning?
What is a Weibull distribution?
Probability has a great role in advance technology called Machine Learning. It is a part of it along with calculate, algebra.
Thanks.
Jason – I have some of your PDFs although I have not read them end to end.
You are truly gifted in explaining concepts in ML.
This article summarized what one needs to understand probability for ML.
Thanks
Srini
Thank you for the kind words and feedback, Srini! I wish you the best on your Machine Learning Journey!
Thanks for this very important post. Your divulgative approach is impressive in its completeness and appreciation for the foundations of Machine Learning.
Who else can seamlessly transition from GAN to Probability Distribution and back?
Thank you Jason.
Lorenzo Ostano
Thanks 🙂
Hello,
I am very confused about probability distributions though.
How are probability distributions related to PMF, PDF, CDFs?
I see a lot of content online comparing and contrasting uniform, normal, bernoulli, binomial, poisson, etc. And a lot of content comparing and contrasting PMF, PDF, CDF.
But i can’t find any information that relates the two together. How do probability distributions relate with the PMF, PDF, CDF?
Thanks.
Each type (uniform, gaussian, etc.) has a PDF, CDF, PMF.
Thanks for the easy explanation on this subject. I needed it to understand better supply chain logistics.
Sincerely
Thanks, perhaps you can start with a textbook on the topic?
How to make answers for these questions using concepts of probability distribution, confidence intervals and hypothesis testing?
A company manufactures batteries that the CEO claims will last an average of 350 hours under normal use. A researcher randomly selected 20 batteries from the production line and tested these batteries. The tested batteries had a mean life span of 320 hours with a standard deviation of 50 hours.
a) Construct 95% confidence interval for battery life. Assume that the battery life follows
Normal distribution.
b) Construct 99% confidence interval for battery life. (Assumption that the battery life follows
Normal distribution is not valid).
c) Write down the hypothesis to check the claim.
d) Do we have enough evidence to suggest that the claim of an average lifetime of 350 hours is false? (Carryout hypothesis testing to check the claim at 5% significance level). Assume that the battery life follows Normal distribution.
e) If the assumption that the battery life follows Normal distribution cannot be made, carry out the hypothesis testing procedure to check the claim.
This looks like a homework problem or interview problem. It would not be ethical for me to do this work for you.
It is typically denoted as a function of the uppercase letter E with square brackets: for
example, E[X] for the expected value of X or
” E[f(x)] where the function f() is used to sample a value from the domain of X.”
If X is a RVar then it has many events in it. Then doesn’t f(X) gives me an event?
And for and event there is only 1 prob value.
So why calculate mean(E)?
No f(X) gives you the probability of the event X.
***CORRECTION HERE***
Continuous Probability Distributions :-
//
//
//
“Probability Distribution Function. Probability for a value for a continuous random variable.”
Should be corrected to
“PDF: Probability Density Function, returns the probability of a given continuous outcome.”
No sure I agree with your language, sorry.
Very useful article and saved me lots of time searching for this information. Where can I get specific examples to each of the different tipe of distribution ?
Thank you.
There are examples on the blog, for example:
https://machinelearningmastery.com/discrete-probability-distributions-for-machine-learning/
Great article. I am trying to understand where exactly do we use probability distributions as a data scientist? Could you please share some real world examples on how probability distributions are used?
Most commonly used is Gaussian for sure. But let me give one example of why this is useful. If you consider a manufacture line with many steps, each step takes some time to complete and it is Gaussian distributed. If suddenly we found the line is going really slow or really fast, is that normal? With distribution function, we can compute the probability for the entire process finish in certain time. And hence tell it fits our model (nothing to surprise, business as usual) or not (something wrong, we need to revise our work).