In this article, you will learn what AgentOps is, how it differs from traditional LLM monitoring, and how to build a production-ready observability stack for autonomous AI agents.
Topics we will cover include:
- The five core pillars of AgentOps and why standard logging is insufficient for autonomous agents.
- How to instrument a working research agent with full session tracking, cost attribution, and failure detection using the AgentOps platform.
- How to debug common agent failure patterns using session replay, and how to govern costs and enforce safety at the operational layer.
The Practitioner’s Guide to AgentOps
Image by Author
Introduction
According to Futurum Research’s 2025 market overview of agentic AI platforms, 89% of CIOs now rank agent-based AI as a top strategic priority for productivity and workflow automation. And yet the vast majority of teams shipping agents in 2026 have no systematic way to understand why they fail, what they cost per session, or whether they are staying within the scope they were designed for. When something breaks, the investigation starts with a stack trace and ends with someone reading logs line by line, trying to reconstruct what the agent was thinking when it went wrong.
That is the gap AgentOps fills. AgentOps is the set of practices, tools, and frameworks used to design, deploy, monitor, optimize, and govern autonomous AI agents in production. It extends DevOps, MLOps, and LLMOps into a domain where the software component can reason, act, and adapt independently, which means the operational challenges are qualitatively different, not just more of the same. This guide covers what AgentOps actually is, where it differs from regular LLM monitoring, the tooling ecosystem including a full working code example, how to debug agent failures using session replay, the cost and safety patterns that keep agents sustainable in production, and a decision framework for building your own stack.
What is AgentOps?
The simplest definition: AgentOps is the operational backbone for autonomous agents. It ensures agent behavior remains explainable, measurable, and aligned with business and compliance objectives at every step, not just at the final output.
Just as DevOps unified development and operations, and MLOps standardized the deployment of machine learning models, AgentOps brings the same operational rigor to intelligent autonomy. The discipline is built on three observations about why traditional monitoring does not work for agents.
- Failures compound across steps: A regular API monitoring tool shows you that a call failed. It cannot show you that the failure in step 7 was caused by a bad tool parameter set in step 3, which was caused by ambiguous context extracted in step 1. Agent failures appear in multi-step causal chains, not at the individual call level. If you cannot capture and replay the full chain, you cannot diagnose anything meaningful.
- Outputs are trajectories, not responses: For a standard LLM application, the output is a response to a prompt. You can score it, judge it, and log it as a single data point. For an agent, the output is a sequence of decisions: which tool to call, in what order, with what parameters, and how to interpret the results at each step. Evaluating a trajectory is a different problem from evaluating a response, and it requires different infrastructure.
- Cost is unbounded by design: A static LLM call has a predictable token count. An agent that loops on a complex task — calling search tools, re-reading context, revising its plan — can consume thousands of tokens before any human sees the result. Without session-level cost visibility, budget management is guesswork.
The Five Pillars of AgentOps
Every mature AgentOps implementation rests on five operational capabilities. They are not optional extras; they are the conditions under which agents can be trusted to run autonomously at any meaningful scale.
- Observability: Full trace of every step, tool call, reasoning decision, input, output, and error across the entire session from agent initialization to task completion. Not individual call logging — full session capture. The cornerstone of AgentOps is observability — the ability to make the behavior of an autonomous agent fully transparent. Unlike traditional logging, which captures isolated events, observability traces how an agent processes inputs, calls tools, and evolves its understanding across the complete workflow.
- Evaluation: Scoring agent trajectories for quality, goal achievement, tool use correctness, and adherence to constraints. This is distinct from scoring a single response — it requires evaluating whether the sequence of decisions was sound, not just whether the final answer looked reasonable.
- Cost governance: Token-level visibility, session-level cost attribution, budget limits, and loop detection. Which agent types cost most? Which tool calls are being repeated unnecessarily? What is the cost distribution across session types? These questions require session-level aggregation, not per-call logging.
- Safety and guardrails: Prompt injection detection, output validation before downstream systems receive results, scope constraints that limit what tools an agent can call, and human-in-the-loop checkpoints for high-stakes decisions. Safety is not a feature bolted on at the end; it is designed into the operational layer from the start.
- Continuous improvement: Using production traces to identify patterns, improve prompts, redesign tools, and catch regressions. The feedback loop from production back to development is what separates agents that get better over time from agents that degrade silently.
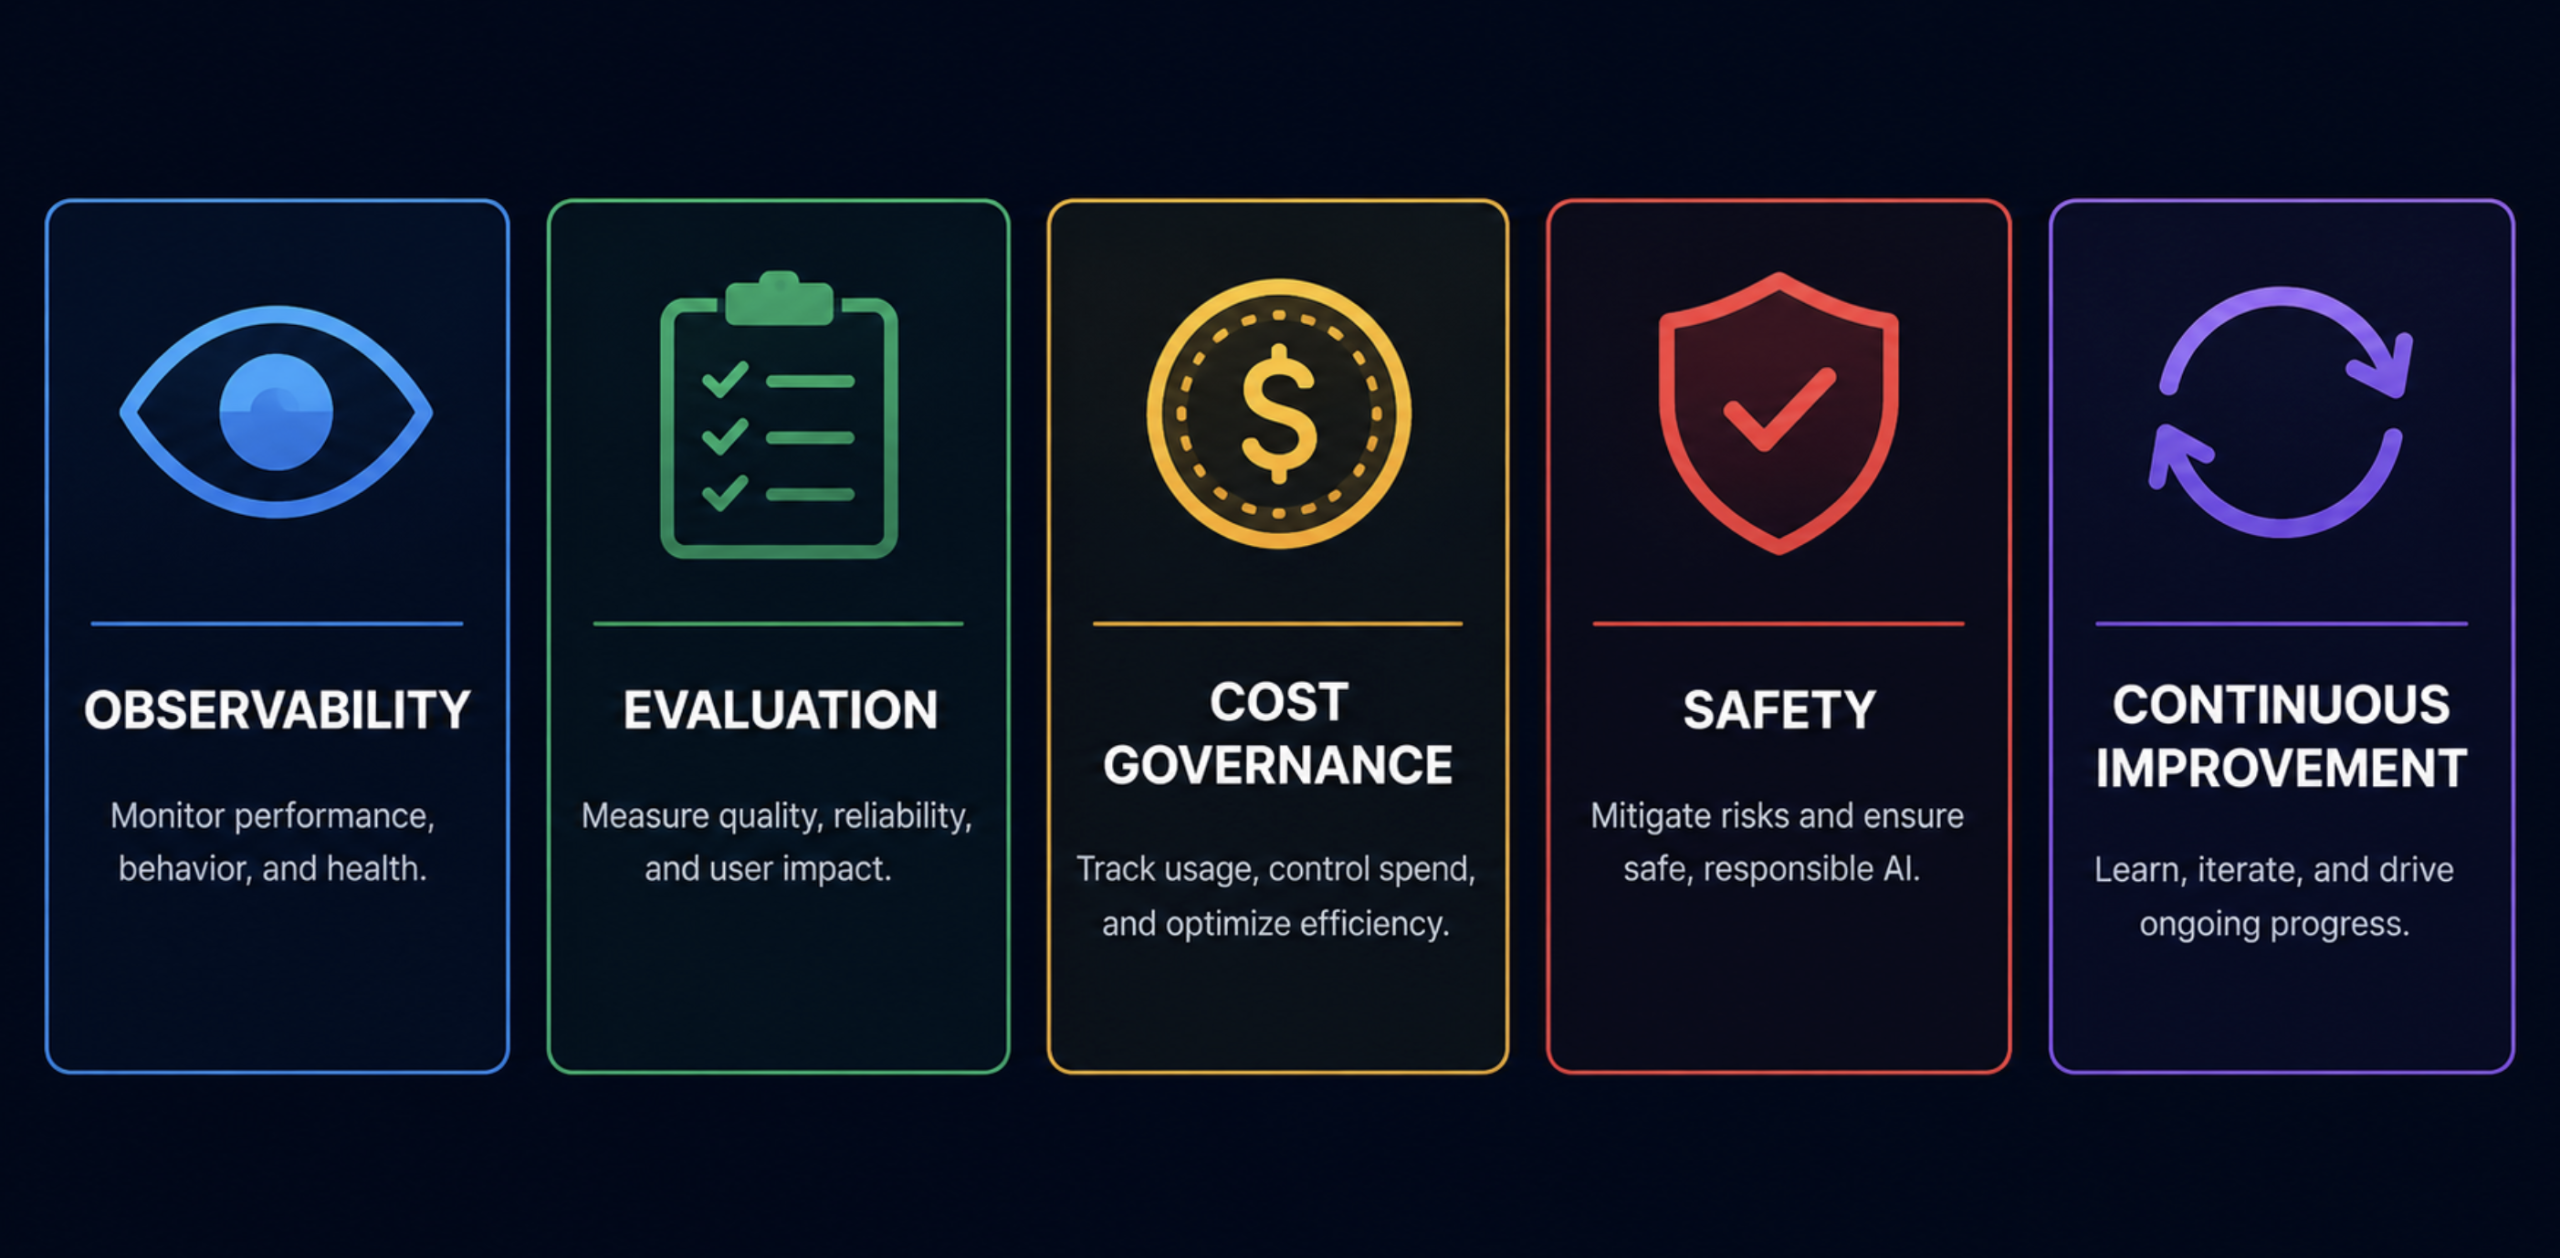
The Five Pillars of AgentOps (click to enlarge)
The AgentOps Tooling Ecosystem
When practitioners say “AgentOps” they may mean either the discipline described above, or the specific platform at agentops.ai. Both are worth understanding.
The AgentOps Platform
AgentOps is a purpose-built observability platform designed specifically for AI agents. It is not a general LLM monitoring tool adapted for agents; it was built from the ground up for multi-step, tool-using, autonomous systems. Its core capabilities:
- Session replay with time-travel debugging: Every agent run is recorded as a replayable session. You can rewind to any point in the execution, inspect the exact state at that step, and forward through the consequences. This is the primary tool for diagnosing failures in production without reproducing them locally.
- Visual event tracking: LLM calls, tool invocations, and multi-agent interactions are visualized as a graph, not a flat log. You can see the structure of a session — which tools were called in which order, where the agent branched, where it looped — at a glance.
- Comprehensive cost tracking: AgentOps monitors, saves, and tracks every token processed by your AI agent. Session-level spend is visible alongside per-call metrics, and cost is attributed to specific tool calls and decision points rather than reported as a session total.
- Security and compliance: AgentOps maintains a full data trail of logs, errors, and detected prompt injection attacks from development through production. This audit trail is the minimum requirement for any regulated or enterprise deployment.
- Framework integrations: The platform integrates with over 400 AI frameworks including CrewAI, OpenAI Agents SDK, LangChain, AutoGen, AG2, Agno, and CamelAI. Most integrations require only two lines of code.
One practical note worth knowing before you deploy: AgentOps introduces significant overhead in multi-step workflows compared to a baseline without instrumentation. This is a reasonable trade-off for the observability you gain, but it is worth benchmarking against your latency requirements before a production rollout.
The Broader Ecosystem
AgentOps is not the only platform in this space, and for some teams it will not be the right choice. Here is where the major options sit:
| Platform | Strongest at | Best fit |
|---|---|---|
| AgentOps | Multi-framework agent debugging, session replay | Teams building across multiple agent frameworks |
| LangSmith | LangChain and LangGraph integration depth | Teams fully committed to the LangChain stack |
| Langfuse | Self-hosted, MIT-licensed, data sovereignty | Teams needing on-premise or open-source |
| Arize Phoenix | ML-grade rigor, RAG evaluation | Enterprises with existing ML monitoring infrastructure |
| Braintrust | CI/CD eval-gated deployments, generous free tier | Eval-driven development with 1M spans/month free |
| Galileo | 100% production traffic evaluation at low latency | High-volume, quality-critical production deployments |
The clearest decision rule from the comparison research: LangSmith is best for LangChain/LangGraph stacks, and AgentOps is the strongest option for multi-framework agent debugging. Everything else is a matter of secondary requirements: data sovereignty, eval workflow, CI/CD integration, and team size.
What AgentOps Captures That Regular Logging Misses
Understanding what standard logging cannot tell you is the fastest way to understand why purpose-built agent observability matters.
- Multi-step causal chains: A plain logger tells you that step 7 returned an error. AgentOps tells you that the error in step 7 was caused by a malformed parameter passed in step 3, which happened because the context extraction in step 1 returned an ambiguous entity. The causal chain is the actual failure, and it is invisible in per-call logs. Session replay makes it navigable.
- Tool call patterns and anomalies: Which tools are called most frequently across sessions? Which ones fail silently without raising exceptions? Are there sequences of tool calls that consistently precede bad outputs? Pattern data across sessions is what lets you redesign tools and prompts effectively. You cannot derive this from individual call logs — you need session-aggregated data across many runs.
- Session-level cost attribution: A single API call might cost \$0.003. An agent session that loops on a complex research task might cost \$4.70. The difference is not visible in per-call monitoring. AgentOps attributes cost to specific tool calls and decision sequences, so you can see exactly which parts of the agent workflow drive cost and optimize precisely rather than guessing.
Instrumentation in Practice
This example builds a research agent that accepts a topic, uses tool calls to gather information, and returns a structured summary. Every step is instrumented with AgentOps from the first line. The example is designed to show the full instrumentation pattern: session initialization, tool decoration, custom action recording, error handling, and session end.
Let’s install the prerequisites:
|
1 |
pip install agentops anthropic python-dotenv |
You will need:
- An AgentOps API key, free to start, available in your account settings
- An Anthropic API key
- A .env file in your project root
Environment Setup
|
1 2 3 |
# .env file -- create this in your project folder AGENTOPS_API_KEY=your_agentops_key_here ANTHROPIC_API_KEY=sk-ant-your_key_here |
Full Working Agent
|
1 2 3 4 5 6 7 8 9 10 11 12 13 14 15 16 17 18 19 20 21 22 23 24 25 26 27 28 29 30 31 32 33 34 35 36 37 38 39 40 41 42 43 44 45 46 47 48 49 50 51 52 53 54 55 56 57 58 59 60 61 62 63 64 65 66 67 68 69 70 71 72 73 74 75 76 77 78 79 80 81 82 83 84 85 86 87 88 89 90 91 92 93 94 95 96 97 98 99 100 101 102 103 104 105 106 107 108 109 110 111 112 113 114 115 116 117 118 119 120 121 122 123 124 125 126 127 128 129 130 131 132 133 134 135 136 137 138 139 140 141 142 143 144 145 146 147 148 149 150 151 152 153 154 155 156 157 158 159 160 161 162 163 164 165 166 167 168 169 170 171 172 173 174 175 176 177 178 179 180 181 182 183 184 185 186 187 188 189 190 191 192 193 194 195 196 197 198 199 200 201 202 203 204 205 206 207 208 209 210 211 212 213 214 215 216 217 218 219 220 221 222 223 224 225 226 227 228 229 230 231 232 233 234 235 236 237 238 239 240 241 242 243 244 245 246 247 248 249 250 251 252 253 254 255 256 257 258 259 260 261 262 263 264 265 266 267 268 269 270 271 272 273 274 275 276 277 278 279 280 281 282 283 284 285 286 287 288 289 290 291 292 293 294 295 296 297 298 299 300 301 302 303 304 305 306 307 308 309 310 311 312 313 314 315 316 317 318 319 320 321 322 323 324 325 326 327 328 329 330 331 332 333 334 335 336 337 338 339 340 341 342 343 |
# research_agent.py # Purpose: A research agent with full AgentOps instrumentation. # Every session is logged, replayed, and cost-tracked in the AgentOps dashboard. # # Prerequisites: # pip install agentops anthropic python-dotenv # # Environment variables required (in .env): # AGENTOPS_API_KEY -- from https://app.agentops.ai # ANTHROPIC_API_KEY -- from https://console.anthropic.com # # How to run: # python research_agent.py import os import json import time from dotenv import load_dotenv import anthropic import agentops from agentops.sdk.decorators import record_function load_dotenv() # ── Initialize AgentOps ──────────────────────────────────────────────────────── # This must be called before any agent code runs. # Tags let you filter and group sessions in the dashboard. # The SDK automatically intercepts LLM calls once initialized. agentops.init( api_key=os.environ["AGENTOPS_API_KEY"], tags=["research-agent", "production", "v1.0"], auto_start_session=True # Automatically starts a session on init ) # Initialize the Anthropic client after AgentOps -- the SDK wraps LLM clients # to automatically capture every call's input, output, tokens, and cost. client = anthropic.Anthropic(api_key=os.environ["ANTHROPIC_API_KEY"]) MODEL = "claude-sonnet-4-20250514" # ── System prompt ───────────────────────────────────────────────────────────── # Stored as a constant, not inline -- version-controllable and testable. SYSTEM_PROMPT = """You are a research assistant. When given a topic: 1. Use the available tools to gather information systematically 2. Call search_topic to get an overview of the subject 3. Call get_key_facts to extract the most important points 4. Call format_summary to structure the final output Be thorough but concise. Always call format_summary as your final step.""" # ── Tool definitions ────────────────────────────────────────────────────────── # These are the tools the agent can call. In a real system, search_topic # would call a real search API (Tavily, SerpAPI, etc.). Here they are stubs # that return realistic data so you can run the example without external APIs. TOOLS = [ { "name": "search_topic", "description": ( "Search for comprehensive information about a topic. " "Returns an overview with key themes and context. " "Use this as the first step for any research task." ), "input_schema": { "type": "object", "properties": { "topic": { "type": "string", "description": "The topic to research. Be specific." }, "depth": { "type": "string", "enum": ["overview", "detailed"], "description": "How deep to search. Use 'overview' first." } }, "required": ["topic"] } }, { "name": "get_key_facts", "description": ( "Extract the most important facts about a topic from search results. " "Use after search_topic to identify the 5-7 most significant points." ), "input_schema": { "type": "object", "properties": { "topic": { "type": "string", "description": "The topic to extract facts about" }, "focus": { "type": "string", "description": "Optional: specific angle to focus on (e.g., 'recent developments', 'key players')" } }, "required": ["topic"] } }, { "name": "format_summary", "description": ( "Format research findings into a clean structured summary. " "Always call this as the final step before returning to the user." ), "input_schema": { "type": "object", "properties": { "title": { "type": "string", "description": "Title for the summary" }, "key_points": { "type": "array", "items": {"type": "string"}, "description": "List of key findings (5-7 items)" }, "conclusion": { "type": "string", "description": "A 2-3 sentence synthesis of the research" } }, "required": ["title", "key_points", "conclusion"] } } ] # ── Tool implementations ────────────────────────────────────────────────────── # @record_function decorates each tool so AgentOps captures: # - The function name # - Input arguments # - Return value # - Execution time # - Any exceptions # These appear as labeled spans in the session replay timeline. @record_function("search_topic") def search_topic(topic: str, depth: str = "overview") -> dict: """ Search for information about a topic. In production: replace this stub with a real search API call. """ # Simulate search latency -- remove in production time.sleep(0.3) # Stub response -- replace with: tavily_client.search(query=topic) return { "topic": topic, "depth": depth, "results": f"Comprehensive overview of {topic}: This is a rapidly evolving field " f"with significant developments in 2025-2026. Key themes include " f"technical innovation, adoption patterns, and organizational impact. " f"Multiple research groups and companies are actively advancing the field.", "source_count": 12, "timestamp": "2026-05-26" } @record_function("get_key_facts") def get_key_facts(topic: str, focus: str = None) -> dict: """ Extract key facts about a topic. In production: this would process real search results. """ time.sleep(0.2) focus_note = f" (focus: {focus})" if focus else "" return { "topic": topic, "focus": focus_note, "facts": [ f"{topic} has seen 42% year-over-year growth in adoption", f"Leading organizations report 3-5x productivity improvements", f"Key technical challenges include reliability, cost, and governance", f"The market is projected to reach $4.9B by 2028", f"Open-source tooling has matured significantly in the past 18 months", ], "confidence": "high" } @record_function("format_summary") def format_summary(title: str, key_points: list, conclusion: str) -> dict: """ Format research into a structured summary. This is always the final step in the research workflow. """ return { "title": title, "key_points": key_points, "conclusion": conclusion, "format": "structured_summary", "generated_at": "2026-05-26" } def execute_tool(tool_name: str, tool_input: dict) -> str: """ Route tool calls to the correct implementation. Returns the result as a JSON string for the model to read. """ if tool_name == "search_topic": result = search_topic(**tool_input) elif tool_name == "get_key_facts": result = get_key_facts(**tool_input) elif tool_name == "format_summary": result = format_summary(**tool_input) else: result = {"error": f"Unknown tool: {tool_name}"} return json.dumps(result) # ── The agent loop ───────────────────────────────────────────────────────────── def run_research_agent(topic: str) -> dict: """ Run the research agent on a given topic. The loop: 1. Send the goal to Claude with the available tools 2. If Claude wants to call a tool, execute it and return the result 3. Continue until Claude signals it is done (stop_reason == 'end_turn') 4. Return the final structured summary AgentOps captures every iteration automatically because: - The LLM client is wrapped after agentops.init() - Each tool is decorated with @record_function - The session spans the full lifecycle from init to end_session() """ print(f"\nStarting research agent for topic: '{topic}'") print("Session will be visible at https://app.agentops.ai\n") messages = [ {"role": "user", "content": f"Research this topic and produce a structured summary: {topic}"} ] final_summary = None iteration = 0 max_iterations = 10 # Safety limit -- prevents runaway loops while iteration < max_iterations: iteration += 1 print(f"Iteration {iteration}: Calling Claude...") response = client.messages.create( model=MODEL, max_tokens=4096, system=SYSTEM_PROMPT, tools=TOOLS, messages=messages ) print(f" stop_reason: {response.stop_reason}") # Add assistant response to message history messages.append({"role": "assistant", "content": response.content}) # If Claude is done, extract the final summary and exit if response.stop_reason == "end_turn": # Look for the format_summary result in the message history for msg in reversed(messages): if msg["role"] == "user" and isinstance(msg["content"], list): for block in msg["content"]: if (hasattr(block, "type") and block.type == "tool_result"): try: result_data = json.loads(block.content[0].text) if result_data.get("format") == "structured_summary": final_summary = result_data break except (json.JSONDecodeError, (AttributeError, KeyError, IndexError, TypeError)): pass if final_summary: break break # Process tool calls if Claude wants to use tools if response.stop_reason == "tool_use": tool_results = [] for block in response.content: if block.type == "tool_use": print(f" Tool call: {block.name}({json.dumps(block.input, indent=2)})") result = execute_tool(block.name, block.input) print(f" Result: {result[:100]}...") tool_results.append({ "type": "tool_result", "tool_use_id": block.id, "content": result }) # Return tool results to Claude messages.append({"role": "user", "content": tool_results}) if iteration >= max_iterations: print(f"WARNING: Agent hit max iterations ({max_iterations}). Possible loop detected.") # AgentOps will show this as a session ending in Fail agentops.end_session("Fail") return {"error": "Max iterations reached -- check session replay for loop analysis"} # End session with Success -- this finalizes the session in AgentOps # The session replay is now available at app.agentops.ai agentops.end_session("Success") return final_summary or {"message": "Research complete -- check session replay for full trace"} # ── Run the agent ───────────────────────────────────────────────────────────── if __name__ == "__main__": topic = "AgentOps and AI agent observability in 2026" try: result = run_research_agent(topic) print("\n" + "=" * 60) print("RESEARCH SUMMARY") print("=" * 60) if "error" in result: print(f"Error: {result['error']}") else: print(f"Title: {result.get('title', 'N/A')}") print("\nKey Points:") for i, point in enumerate(result.get("key_points", []), 1): print(f" {i}. {point}") print(f"\nConclusion: {result.get('conclusion', 'N/A')}") print("\n" + "=" * 60) print("Session replay available at: https://app.agentops.ai") print("Look for your session tagged 'research-agent'") print("=" * 60) except KeyboardInterrupt: # Clean session end if the user interrupts agentops.end_session("Fail") print("\nSession ended by user. Partial trace saved to AgentOps.") except Exception as e: # Record failures so they show up in the dashboard agentops.end_session("Fail") print(f"Agent failed: {e}") raise |
How to Run
|
1 2 3 4 5 6 7 8 9 10 11 12 13 14 |
# 1. Create your .env file cat > .env << 'EOF' AGENTOPS_API_KEY=your_agentops_key_here ANTHROPIC_API_KEY=sk-ant-your_key_here EOF # 2. Install dependencies pip install agentops anthropic python-dotenv # 3. Run the agent python research_agent.py # 4. Open the dashboard to see your session # https://app.agentops.ai |
What this code does and what AgentOps captures:
- The agentops.init() call at the top wraps the Anthropic client automatically; every subsequent LLM call is captured without any additional instrumentation.
- The @record_function decorator on each tool function creates labeled spans in the session timeline, recording inputs, outputs, and execution time for each tool invocation.
- The agentops.end_session(“Success”) or agentops.end_session(“Fail”) call finalizes the session and makes it available for replay.
- In the AgentOps dashboard, you will see the full session timeline: each LLM call with its token counts and cost, each tool invocation with its parameters and results, the iteration-by-iteration progression of the agent’s reasoning, and the total session cost and latency.
- The max_iterations guard ending in Fail is a concrete example of loop detection — if the agent loops, the session is marked failed, which makes it easy to filter for and investigate in the dashboard.
Debugging Agent Failures with Session Replay
When an agent fails in production, the first instinct is to add more logging. The problem is that what you need is not more data points — it is a way to navigate the data you already have. Session replay in AgentOps gives you a time-travel interface: rewind to any step, inspect the exact state at that moment, and walk forward through the consequences.
Four failure patterns show up repeatedly in production agents. Here is what each one looks like in the session trace and how to address it:
- Looping agents: The trace shows the same tool call being made repeatedly with slightly different parameters. Token counts grow across iterations without the agent making meaningful progress. The cost graph shows a runaway curve. The fix is almost always one of two things: a better stopping condition (explicitly tell the agent what “done” looks like), or a loop-detection guardrail at the SDK level that halts execution after the same tool is called N times in succession. The max_iterations guard in the code above is the simplest version of this.
- Tool hallucinations: The agent calls a tool with parameters that do not match the tool’s schema — a field name that does not exist, a string where an integer is required, a nested object where a flat value is expected. The trace shows the tool invocation with the malformed parameters and the resulting error. This failure mode usually means the tool description is ambiguous. Fix it with more precise parameter descriptions and one or two few-shot examples in the tool definition showing correct usage.
- Context accumulation failures: In long sessions where the agent passes its full conversation history to each call, a characteristic pattern emerges: token counts grow linearly with session length, and at some point quality degrades because the model’s effective context window is saturated with prior turns. The session trace makes this visible as a cost spike and a quality drop in the same session range. The fix is context pruning; summarizing completed subtasks and trimming prior turns rather than accumulating them indefinitely.
- Multi-agent handoff failures: In multi-agent systems, when one agent hands off a task to another, the receiving agent operates on the context it was given. If that context is incomplete or ambiguous, the receiving agent makes wrong assumptions and the failure propagates. The handoff payload is visible in the AgentOps trace; you can inspect exactly what was sent and what assumptions the receiving agent derived from it. This makes handoff design a debuggable engineering problem rather than a guessing game.
Cost Governance and Safety
This section covers two important concepts you need to be aware of: cost governance and safety.
Cost Governance in Practice
Unmanaged agent costs in production are not a minor inconvenience — they are how engineering teams end up explaining unexpected bills. Three practices that prevent this:
- Session cost budgets: Set a maximum cost per session and abort agent runs that exceed the threshold. In the code example above, the max_iterations guard is the simplest form of this. A more sophisticated version checks the cumulative token cost after each iteration and exits gracefully if it exceeds a configured limit. AgentOps’s cost tracking makes the live cost visible at each step, which is the prerequisite for this kind of dynamic budget enforcement.
- Loop detection and alerting: If the same tool is called N times in succession with similar parameters and no meaningful change in the agent’s state, the session is likely looping. This pattern is visible in the AgentOps timeline as a repeated identical span. Build explicit loop detection into your agent architecture, either at the SDK level or as a check inside the agent loop.
- Fine-tuning on saved completions: AgentOps saves every completion your agents produce. For agents doing repetitive tasks — classification, extraction, and formatting — you can use that saved history to fine-tune a smaller, cheaper specialized model. AgentOps enables fine-tuning specialized LLMs using saved completions for up to 25x cost savings on high-volume workflows. This is the highest-leverage cost optimization available for mature production agent systems.
Safety Patterns
- Prompt injection detection: AgentOps maintains a full data trail of injection attempts from prototype to production. For agents that ingest user-provided content — web pages, documents, emails, customer messages — prompt injection is a real attack surface. Input that contains hidden instructions designed to redirect the agent’s behavior needs to be detected before it reaches the model.
- Scope constraints: Define what tools an agent is allowed to call and enforce it at the SDK level. An agent designed for customer support should not have access to a database write tool, regardless of what the model reasons it should do. Tool-level scope constraints are the most direct safety control available in the agent architecture layer.
- Output validation: Before structured agent outputs reach downstream systems — a database write, an API call, a customer-facing message — validate them against your expected schema. A malformed output that triggers a downstream failure is harder to debug than a validation error caught at the boundary. Input guardrails detect prompt injection attacks and malicious intent before the request reaches the model, while output guardrails check responses for PII leakage, hallucinations, toxic content, and format compliance before delivery to the downstream system.
- Human-in-the-loop checkpoints: For high-stakes decisions — sending communications to customers, making financial transactions, modifying production data — build explicit approval gates into the agent workflow. The agent reaches a checkpoint, posts the proposed action for human review, and waits. This is not a failure of automation; it is the correct design for any action where the cost of a mistake exceeds the cost of the review.
Building Your AgentOps Stack
The right stack is not the one with the most features; it is the one that fits your actual constraints. Work through these four questions in order.
- Are you fully committed to LangChain or LangGraph? If yes, LangSmith is the clear choice. The integration is the deepest in the field, with node-by-node state diffs, full agent execution graphs, and replay against new model versions baked in. Outside the LangChain ecosystem, the value drops quickly.
- Do you have data sovereignty or self-hosting requirements? If your legal or compliance team requires data to stay on-premise, Langfuse self-hosted is the answer — MIT licensed, full-featured, and the leading open-source option with over 6 million SDK installs per month as of mid-2026. Pair it with LiteLLM for cost management and routing.
- Are you building across multiple agent frameworks? If your stack includes CrewAI, OpenAI Agents SDK, AutoGen, and LangChain — or you expect that mix to change as the framework landscape evolves — AgentOps is the right primary observability layer. The 400+ framework integrations and the session replay design make it the most framework-agnostic option in the space.
- Is eval-gated CI/CD your primary bottleneck? If your team’s main challenge is blocking prompt regressions from shipping to production, Braintrust has the strongest CI/CD integration and the most generous free tier at 1 million spans per month and 10,000 eval runs.
If none of these conditions clearly apply, the minimum viable stack that covers most teams well:
- Instrumentation: AgentOps — session replay, cost tracking, injection detection, 400+ framework integrations.
- Tracing and evaluation: Langfuse self-hosted — MIT licensed, full tracing, prompt management, and evaluation with zero vendor lock-in.
- Cost optimization and routing: LiteLLM — model routing, semantic caching, unified API across all major providers.
- Safety: Guardrails AI — input and output validation, PII detection, format enforcement.
This four-tool stack covers observability, evaluation, cost, and safety without enterprise pricing. It is the right starting point for most teams and extends cleanly as requirements grow.
Conclusion
AgentOps is to autonomous agents what DevOps was to software deployment — the operational discipline that turns experimental systems into reliable ones. Without it, you are shipping software that reasons, acts, and can loop indefinitely, with no systematic way to understand its behavior or improve it over time. The 89% of CIOs prioritizing agent-based AI are going to find out very quickly which teams have that operational layer in place and which ones do not.
The entry point is lower than it looks. Three lines of code add full session instrumentation to any agent. The session replay, cost tracking, and injection detection are there from the first run. Build from that baseline — add the evaluation layer, the guardrails, the CI/CD integration — as your system matures and the cost of getting it wrong increases. The tooling is production-ready in 2026. The only remaining variable is whether you use it.


")
No comments yet.