Datasets from real-world scenarios are important for building and testing machine learning models. You may just want to have some data to experiment with an algorithm. You may also want to evaluate your model by setting up a benchmark or determining its weaknesses using different sets of data. Sometimes, you may also want to create synthetic datasets, where you can test your algorithms under controlled conditions by adding noise, correlations, or redundant information to the data.
In this post, we’ll illustrate how you can use Python to fetch some real-world time-series data from different sources. We’ll also create synthetic time-series data using Python’s libraries.
After completing this tutorial, you will know:
How to use the pandas_datareader
How to call a web data server’s APIs using the requests library
How to generate synthetic time-series data
Kick-start your project with my new book Python for Machine Learning, including step-by-step tutorials and the Python source code files for all examples.
Let’s get started.
A Guide to Working With Datasets in Python Photo by Mehreen Saeed, some rights reserved
Tutorial Overview
This tutorial is divided into three parts; they are:
Using pandas_datareader
Using the requests library to fetch data using the remote server’s APIs
Generate synthetic time-series data
Loading Data Using pandas-datareader
This post will depend on a few libraries. If you haven’t installed them in your system, you may install them using pip:
1
pip install pandas_datareader requests
The pandas_datareader library allows you to fetch data from different sources, including Yahoo Finance for financial market data, World Bank for global development data, and St. Louis Fed for economic data. In this section, we’ll show how you can load data from different sources.
Behind the scene, pandas_datareader pulls the data you want from the web in real time and assembles it into a pandas DataFrame. Because of the vastly different structure of web pages, each data source needs a different reader. Hence, pandas_datareader only supports reading from a limited number of sources, mostly related to financial and economic time series.
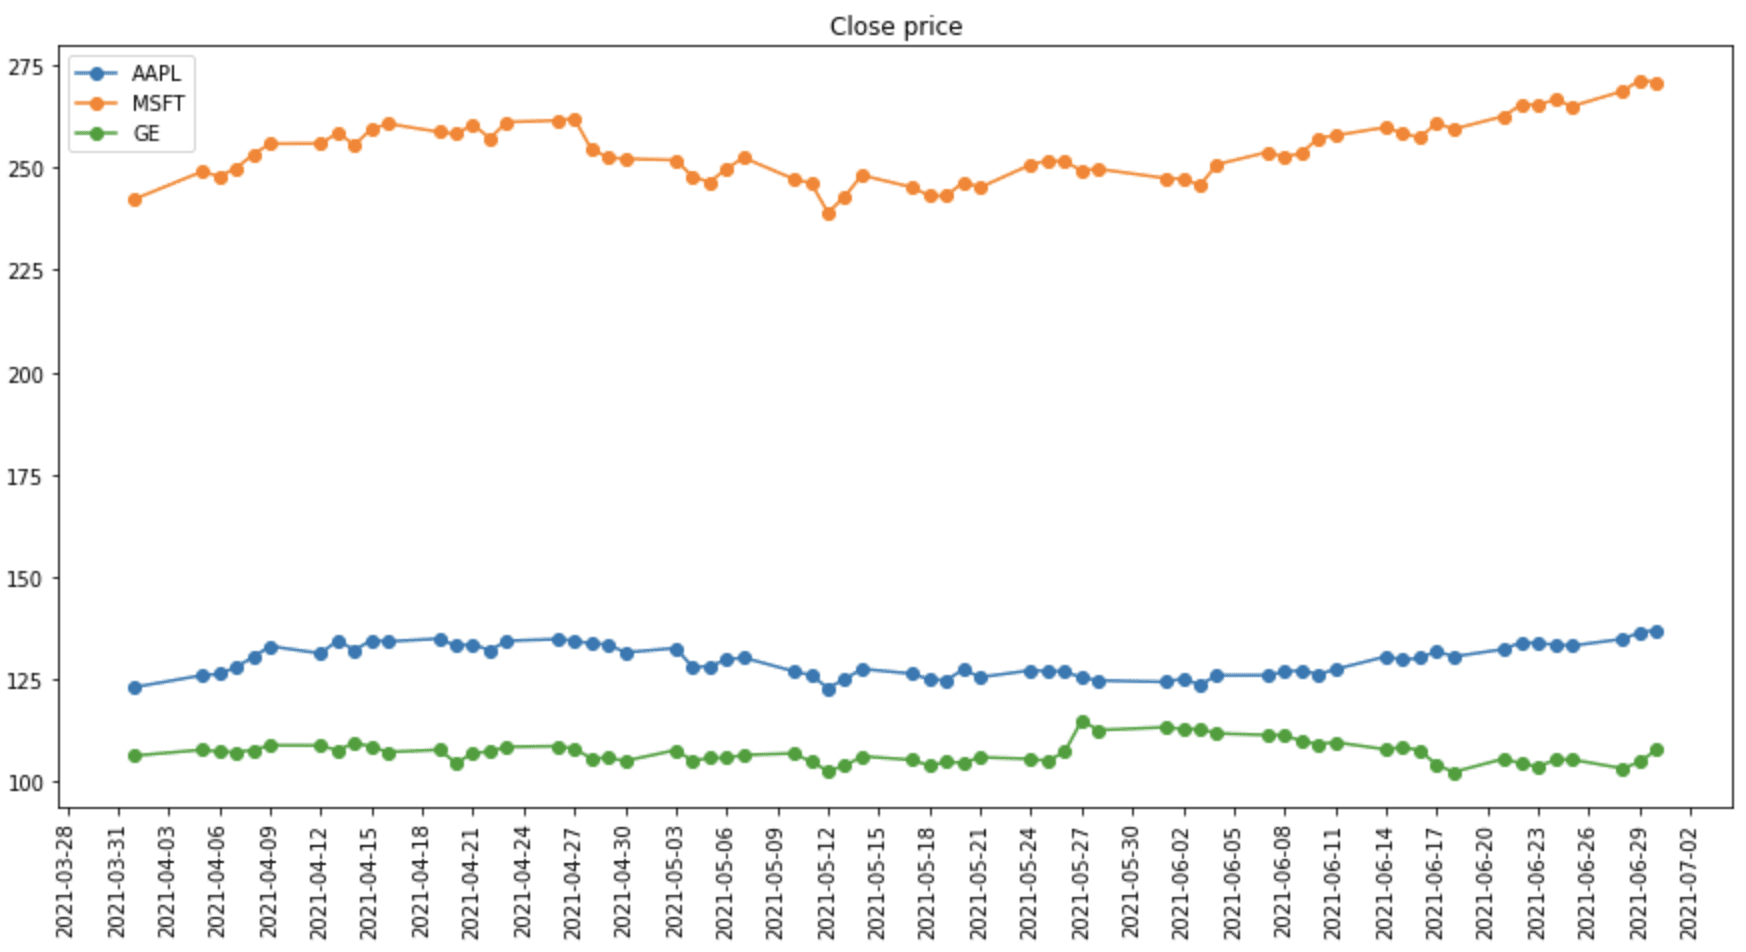
Fetching data is simple. For example, we know that the stock ticker for Apple is AAPL, so we can get the daily historical prices of Apple stock from Yahoo Finance as follows:
The call to DataReader() requires the first argument to specify the ticker and the second argument the data source. The above code prints the DataFrame:
Because of the structure of DataFrames, it is convenient to extract part of the data. For example, we can plot only the daily close price on some dates using the following:
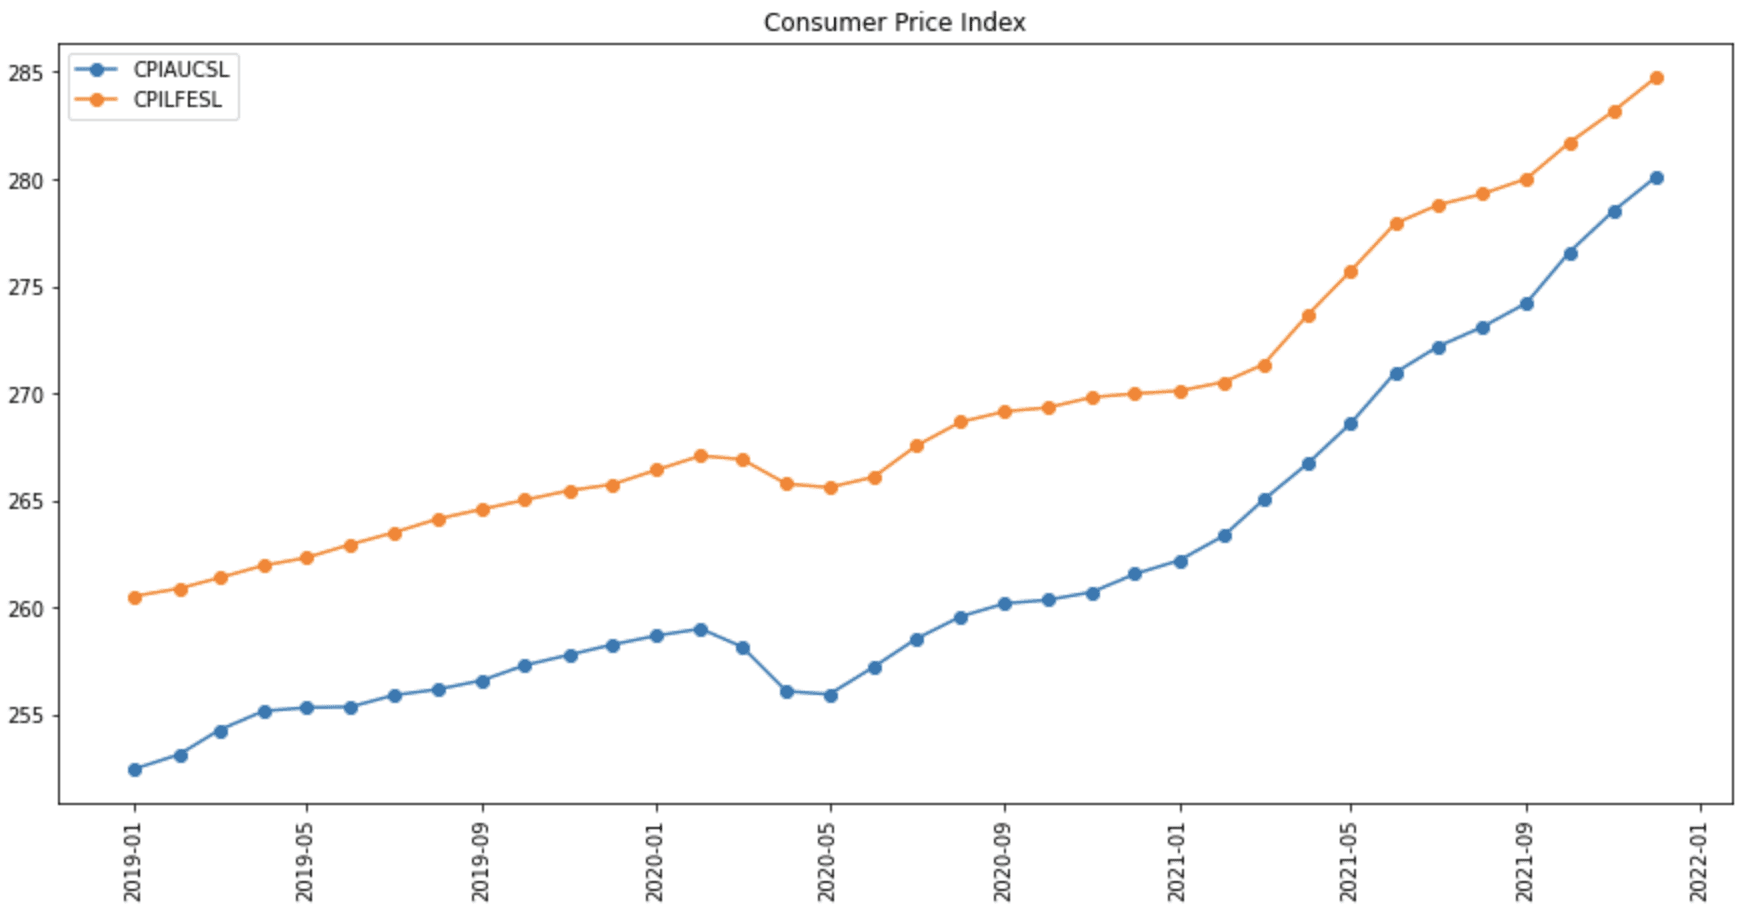
The syntax for reading from another data source using pandas-datareader is similar. For example, we can read an economic time series from the Federal Reserve Economic Data (FRED). Every time series in FRED is identified by a symbol. For example, the consumer price index for all urban consumers is CPIAUCSL, the consumer price index for all items less food and energy is CPILFESL, and personal consumption expenditure is PCE. You can search and look up the symbols from FRED’s webpage.
Below is how we can obtain two consumer price indices, CPIAUCSL and CPILFESL, and show them in a plot:
Obtaining data from World Bank is also similar, but we have to understand that the data from World Bank is more complicated. Usually, a data series, such as population, is presented as a time series and also has the countries dimension. Therefore, we need to specify more parameters to obtain the data.
Using pandas_datareader, we have a specific set of APIs for the World Bank. The symbol for an indicator can be looked up from World Bank Open Data or searched using the following:
1
2
3
4
from pandas_datareader import wb
matches=wb.search('total.*population')
print(matches[["id","name"]])
The search() function accepts a regular expression string (e.g., .* above means string of any length). This will print:
1
2
3
4
5
6
7
8
9
10
11
12
13
14
id name
241.1_ACCESS.ELECTRICITY.TOTAccess toelectricity(%of total population)
1999CC.AVPB.PTPI.AI Additional people below$1.90as%of total po...
2000CC.AVPB.PTPI.AR Additional people below$1.90as%of total po...
2001CC.AVPB.PTPI.DI Additional people below$1.90as%of total po...
.........
13908SP.POP.TOTL.FE.ZS Population,female(%of total population)
13912SP.POP.TOTL.MA.ZS Population,male(%of total population)
13938SP.RUR.TOTL.ZS Rural population(%of total population)
13958SP.URB.TOTL.IN.ZS Urban population(%of total population)
13960SP.URB.TOTL.ZS Percentage of Population inUrban Areas(in%...
[137rowsx2columns]
where the id column is the symbol for the time series.
We can read data for specific countries by specifying the ISO-3166-1 country code. But World Bank also contains non-country aggregates (e.g., South Asia), so while pandas_datareader allows us to use the string “all” for all countries, usually we do not want to use it. Below is how we can get a list of all countries and aggregates from the World Bank:
1
2
3
4
import pandas_datareader.wb aswb
countries=wb.get_countries()
print(countries)
1
2
3
4
5
6
7
8
9
10
11
12
iso3c iso2c name region adminregion incomeLevel lendingType capitalCity longitude latitude
0 ABW AW Aruba Latin America & ... High income Not classified Oranjestad -70.0167 12.5167
1 AFE ZH Africa Eastern a... Aggregates Aggregates Aggregates NaN NaN
2 AFG AF Afghanistan South Asia South Asia Low income IDA Kabul 69.1761 34.5228
3 AFR A9 Africa Aggregates Aggregates Aggregates NaN NaN
4 AFW ZI Africa Western a... Aggregates Aggregates Aggregates NaN NaN
.. ... ... ... ... ... ... ... ... ... ...
294 XZN A5 Sub-Saharan Afri... Aggregates Aggregates Aggregates NaN NaN
295 YEM YE Yemen, Rep. Middle East & No... Middle East & No... Low income IDA Sana'a 44.2075 15.3520
296 ZAF ZA South Africa Sub-Saharan Africa Sub-Saharan Afri... Upper middle income IBRD Pretoria 28.1871 -25.7460
297 ZMB ZM Zambia Sub-Saharan Africa Sub-Saharan Afri... Lower middle income IDA Lusaka 28.2937 -15.3982
298 ZWE ZW Zimbabwe Sub-Saharan Africa Sub-Saharan Afri... Lower middle income Blend Harare 31.0672 -17.8312
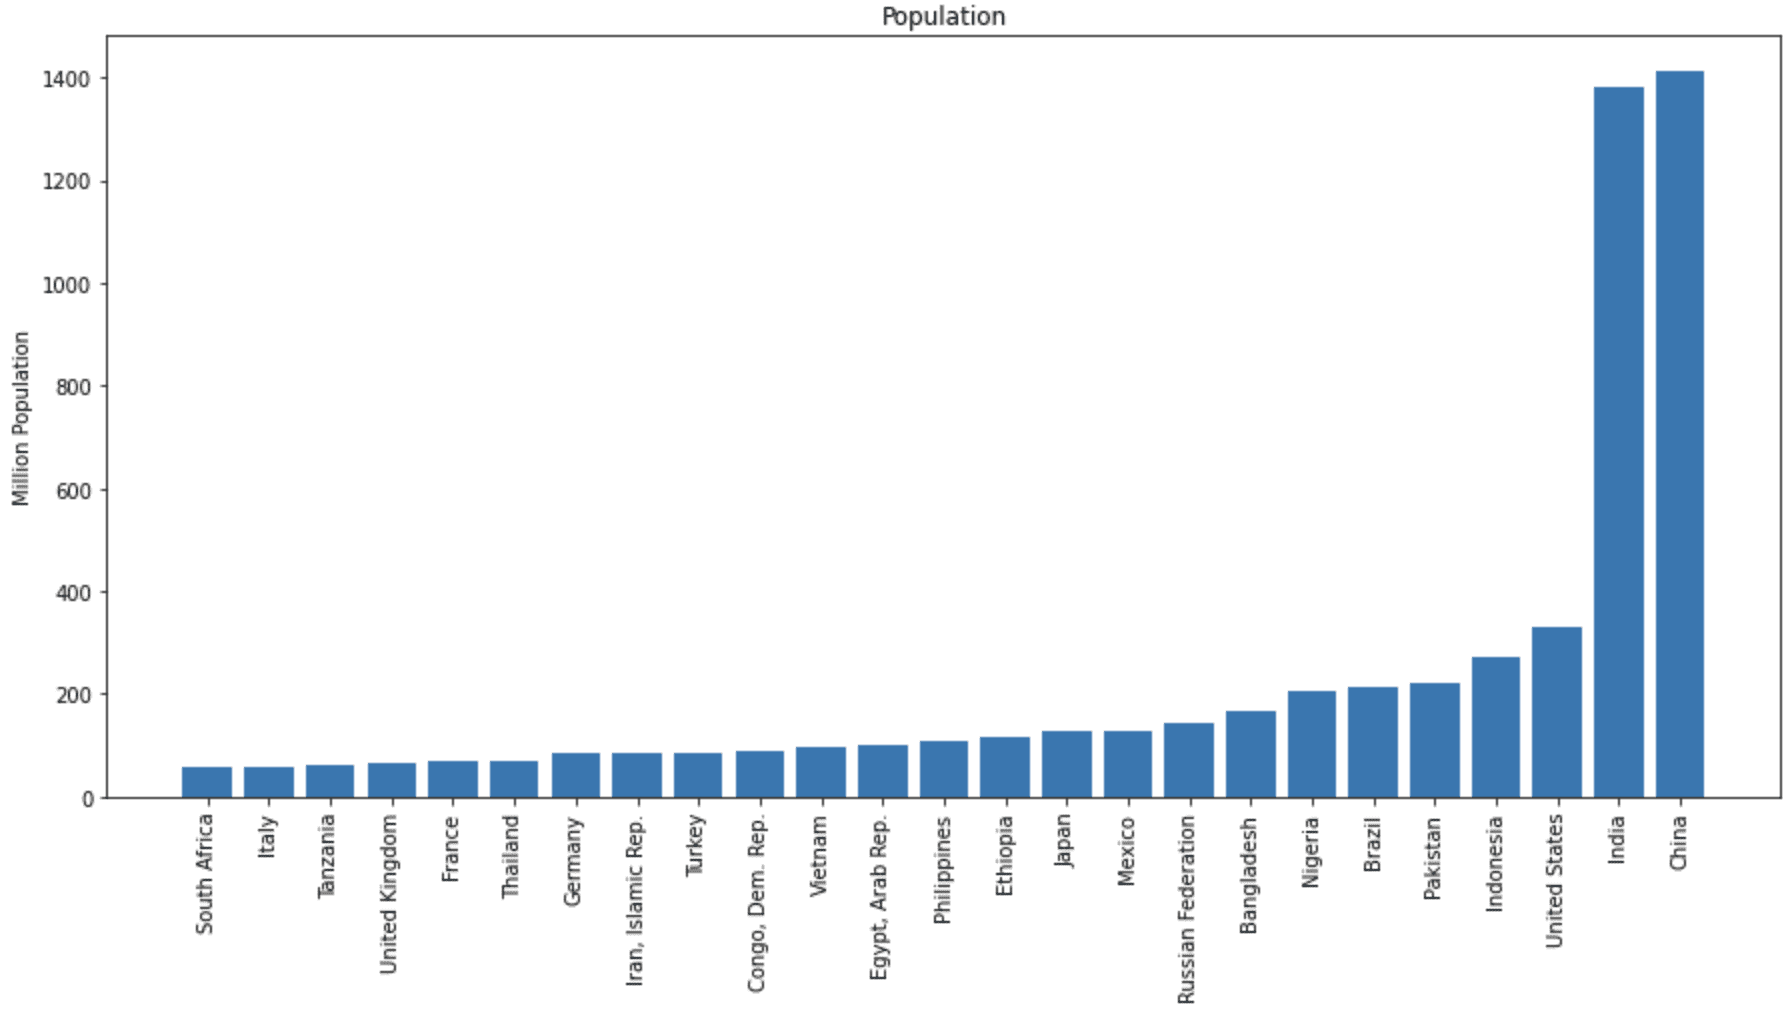
Below is how we can get the population of all countries in 2020 and show the top 25 countries in a bar chart. Certainly, we can also get the population data across years by specifying a different start and end year:
1
2
3
4
5
6
7
8
9
10
11
12
13
14
15
16
17
18
19
20
21
22
23
24
import pandas_datareader.wb aswb
import pandas aspd
import matplotlib.pyplot asplt
# Get a list of 2-letter country code excluding aggregates
Bar chart of total population of different countries
Want to Get Started With Python for Machine Learning?
Take my free 7-day email crash course now (with sample code).
Click to sign-up and also get a free PDF Ebook version of the course.
Fetching Data Using Web APIs
Instead of using the pandas_datareader library, sometimes you have the option to fetch data directly from a web data server by calling its web APIs without any authentication needed. It can be done in Python using the standard library urllib.requests, or you may also use the requests library for an easier interface.
World Bank is an example where web APIs are freely available, so we can easily read data in different formats, such as JSON, XML, or plain text. The page on the World Bank data repository’s API describes various APIs and their respective parameters. To repeat what we did in the previous example without using pandas_datareader, we first construct a URL to read a list of all countries so we can find the country code that is not an aggregate. Then, we can construct a query URL with the following arguments:
country argument with value = all
indicator argument with value = SP.POP.TOTL
date argument with value = 2020
format argument with value = json
Of course, you can experiment with different indicators. By default, the World Bank returns 50 items on a page, and we need to query for one page after another to exhaust the data. We can enlarge the page size to get all data in one shot. Below is how we get the list of countries in JSON format and collect the country codes:
1
2
3
4
5
6
7
8
9
10
11
12
13
14
15
import requests
# Create query URL for list of countries, by default only 50 entries returned per page
You should check the World Bank API documentation for details on how to construct the URL. For example, the date syntax of 2020:2021 would mean the start and end years, and the extra parameter page=3 will give you the third page in a multi-page result. With the data fetched, we can filter for only those non-aggregate countries, make it into a pandas DataFrame for sorting, and then plot the bar chart:
The figure should be precisely the same as before. But as you can see, using pandas_datareader helps make the code more concise by hiding the low-level operations.
Putting everything together, the following is the complete code:
1
2
3
4
5
6
7
8
9
10
11
12
13
14
15
16
17
18
19
20
21
22
23
24
25
26
27
28
29
30
31
32
33
34
35
36
37
38
39
40
41
42
43
44
45
46
47
48
49
50
51
52
53
import pandas aspd
import matplotlib.pyplot asplt
import requests
# Create query URL for list of countries, by default only 50 entries returned per page
Sometimes, we may not want to use real-world data for our project because we need something specific that may not happen in reality. One particular example is to test out a model with ideal time-series data. In this section, we will see how we can create synthetic autoregressive (AR) time-series data.
The numpy.random library can be used to create random samples from different distributions. The randn() method generates data from a standard normal distribution with zero mean and unit variance.
In the AR($n$) model of order $n$, the value $x_t$ at time step $t$ depends upon the values at the previous $n$ time steps. That is,
with model parameters $b_i$ as coefficients to different lags of $x_t$, and the error term $e_t$ is expected to follow normal distribution.
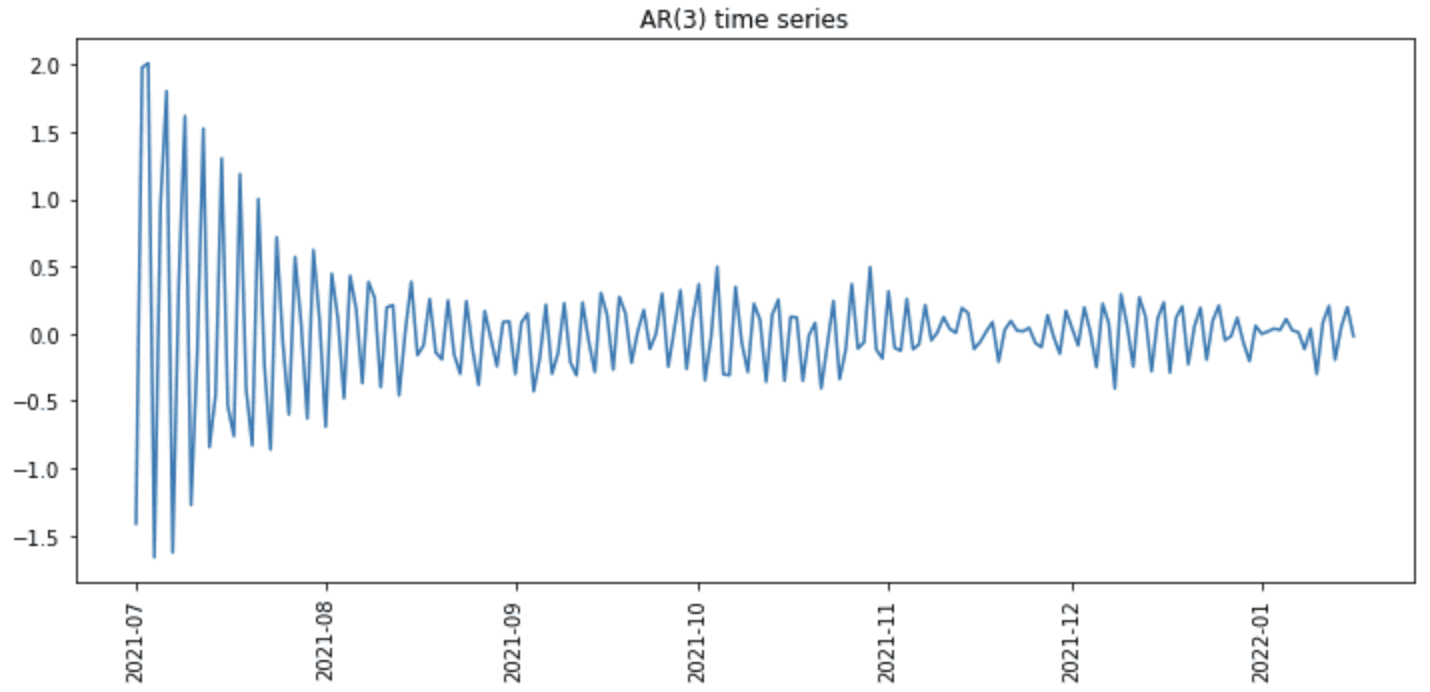
Understanding the formula, we can generate an AR(3) time series in the example below. We first use randn() to generate the first 3 values of the series and then iteratively apply the above formula to generate the next data point. Then, an error term is added using the randn() function again, subject to the predefined noise_level:
The code above will create the following plot:
But we can further add the time axis by first converting the data into a pandas DataFrame and then adding the time as an index:
after which we will have the following plot instead:
Plot of synthetic time series
Using similar techniques, we can generate pure random noise (i.e., AR(0) series), ARIMA time series (i.e., with coefficients to error terms), or Brownian motion time series (i.e., running sum of random noise) as well.
Further Reading
This section provides more resources on the topic if you are looking to go deeper.
It provides self-study tutorials with hundreds of working code to equip you with skills including: debugging, profiling, duck typing, decorators, deployment,
and much more...
Showing You the Python Toolbox at a High Level for Your Projects
Good evening! This was fantastic, especially the last bit about developing synthetic time series data. I deal with sequences of time series data and have been using a far inferior method to develop synthetic data. While time-series data by itself is complicated to handle, sequences of time series bring additional complexities to the problem and I can use this as a guide for making my data a bit more robust. Thank you very much for posting this!
version info for previous error about adding time as the index
Python: 3.9.7 (default, Sep 16 2021, 13:09:58)
[GCC 7.5.0]
scipy: 1.7.3
numpy: 1.21.2
matplotlib: 3.5.1
pandas: 1.4.1
statsmodels: 0.13.2
sklearn: 1.0.2
theano: 1.0.5
tensorflow: 2.4.1
keras: 2.4.3
When try to get the data i get following error messages.
Could you support?
Error message:ConnectionError: HTTPSConnectionPool(host=’finance.yahoo.com’, port=443): Max retries exceeded with url: /quote/AAPL/history?period1=1609462800&period2=1640998799&interval=1d&frequency=1d&filter=history (Caused by NewConnectionError(‘: Failed to establish a new connection: [Errno 11001] getaddrinfo failed’))


")


Mehreen,
Good evening! This was fantastic, especially the last bit about developing synthetic time series data. I deal with sequences of time series data and have been using a far inferior method to develop synthetic data. While time-series data by itself is complicated to handle, sequences of time series bring additional complexities to the problem and I can use this as a guide for making my data a bit more robust. Thank you very much for posting this!
Take care,
Jeremy
version info for previous error about adding time as the index
Python: 3.9.7 (default, Sep 16 2021, 13:09:58)
[GCC 7.5.0]
scipy: 1.7.3
numpy: 1.21.2
matplotlib: 3.5.1
pandas: 1.4.1
statsmodels: 0.13.2
sklearn: 1.0.2
theano: 1.0.5
tensorflow: 2.4.1
keras: 2.4.3
Hello…Please specify the code listing you are experience an error on.
hi , am getting a remotedata error message !
can i share the log somewhere ?
Hi Amit…Could you post the exact error message?
Hello,
When try to get the data i get following error messages.
Could you support?
Error message:ConnectionError: HTTPSConnectionPool(host=’finance.yahoo.com’, port=443): Max retries exceeded with url: /quote/AAPL/history?period1=1609462800&period2=1640998799&interval=1d&frequency=1d&filter=history (Caused by NewConnectionError(‘: Failed to establish a new connection: [Errno 11001] getaddrinfo failed’))
Hi F.S…The following discussion may be of interest:
https://stackoverflow.com/questions/63881566/python-connectionerror-httpsconnectionpoolhost-finance-yahoo-com-port-443