Gradient boosting involves the creation and addition of decision trees sequentially, each attempting to correct the mistakes of the learners that came before it.
This raises the question as to how many trees (weak learners or estimators) to configure in your gradient boosting model and how big each tree should be.
In this post you will discover how to design a systematic experiment to select the number and size of decision trees to use on your problem.
After reading this post you will know:
How to evaluate the effect of adding more decision trees to your XGBoost model.
How to evaluate the effect of creating larger decision trees to your XGBoost model.
How to investigate the relationship between the number and depth of trees on your problem.
Kick-start your project with my new book XGBoost With Python, including step-by-step tutorials and the Python source code files for all examples.
Let’s get started.
Update Jan/2017: Updated to reflect changes in scikit-learn API version 0.18.1.
How to Tune the Number and Size of Decision Trees with XGBoost in Python Photo by USFWSmidwest, some rights reserved.
Need help with XGBoost in Python?
Take my free 7-day email course and discover xgboost (with sample code).
Click to sign-up now and also get a free PDF Ebook version of the course.
This dataset is available for free from Kaggle (you will need to sign-up to Kaggle to be able to download this dataset). You can download the training dataset train.csv.zip from the Data page and place the unzipped train.csv file into your working directory.
This dataset describes the 93 obfuscated details of more than 61,000 products grouped into 10 product categories (e.g. fashion, electronics, etc.). Input attributes are counts of different events of some kind.
The goal is to make predictions for new products as an array of probabilities for each of the 10 categories and models are evaluated using multiclass logarithmic loss (also called cross entropy).
This competition was completed in May 2015 and this dataset is a good challenge for XGBoost because of the nontrivial number of examples, the difficulty of the problem and the fact that little data preparation is required (other than encoding the string class variables as integers).
Tune the Number of Decision Trees in XGBoost
Most implementations of gradient boosting are configured by default with a relatively small number of trees, such as hundreds or thousands.
The general reason is that on most problems, adding more trees beyond a limit does not improve the performance of the model.
The reason is in the way that the boosted tree model is constructed, sequentially where each new tree attempts to model and correct for the errors made by the sequence of previous trees. Quickly, the model reaches a point of diminishing returns.
We can demonstrate this point of diminishing returns easily on the Otto dataset.
The number of trees (or rounds) in an XGBoost model is specified to the XGBClassifier or XGBRegressor class in the n_estimators argument. The default in the XGBoost library is 100.
Using scikit-learn we can perform a grid search of the n_estimators model parameter, evaluating a series of values from 50 to 350 with a step size of 50 (50, 150, 200, 250, 300, 350).
print("Best: %f using %s"%(grid_result.best_score_,grid_result.best_params_))
means=grid_result.cv_results_['mean_test_score']
stds=grid_result.cv_results_['std_test_score']
params=grid_result.cv_results_['params']
formean,stdev,param inzip(means,stds,params):
print("%f (%f) with: %r"%(mean,stdev,param))
# plot
pyplot.errorbar(n_estimators,means,yerr=stds)
pyplot.title("XGBoost n_estimators vs Log Loss")
pyplot.xlabel('n_estimators')
pyplot.ylabel('Log Loss')
pyplot.savefig('n_estimators.png')
Note: Your results may vary given the stochastic nature of the algorithm or evaluation procedure, or differences in numerical precision. Consider running the example a few times and compare the average outcome.
Running this example prints the following results.
1
2
3
4
5
6
7
8
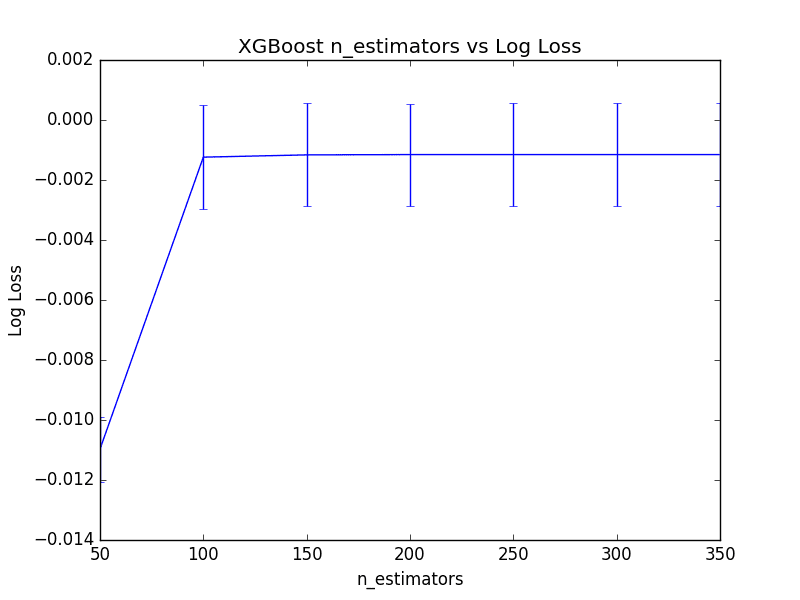
Best: -0.001152 using {'n_estimators': 250}
-0.010970 (0.001083) with: {'n_estimators': 50}
-0.001239 (0.001730) with: {'n_estimators': 100}
-0.001163 (0.001715) with: {'n_estimators': 150}
-0.001153 (0.001702) with: {'n_estimators': 200}
-0.001152 (0.001702) with: {'n_estimators': 250}
-0.001152 (0.001704) with: {'n_estimators': 300}
-0.001153 (0.001706) with: {'n_estimators': 350}
We can see that the cross validation log loss scores are negative. This is because the scikit-learn cross validation framework inverted them. The reason is that internally, the framework requires that all metrics that are being optimized are to be maximized, whereas log loss is a minimization metric. It can easily be made maximizing by inverting the scores.
The best number of trees was n_estimators=250 resulting in a log loss of 0.001152, but really not a significant difference from n_estimators=200. In fact, there is not a large relative difference in the number of trees between 100 and 350 if we plot the results.
Below is line graph showing the relationship between the number of trees and mean (inverted) logarithmic loss, with the standard deviation shown as error bars.
Tune The Number of Trees in XGBoost
Tune the Size of Decision Trees in XGBoost
In gradient boosting, we can control the size of decision trees, also called the number of layers or the depth.
Shallow trees are expected to have poor performance because they capture few details of the problem and are generally referred to as weak learners. Deeper trees generally capture too many details of the problem and overfit the training dataset, limiting the ability to make good predictions on new data.
Generally, boosting algorithms are configured with weak learners, decision trees with few layers, sometimes as simple as just a root node, also called a decision stump rather than a decision tree.
The maximum depth can be specified in the XGBClassifier and XGBRegressor wrapper classes for XGBoost in the max_depth parameter. This parameter takes an integer value and defaults to a value of 3.
1
model=XGBClassifier(max_depth=3)
We can tune this hyperparameter of XGBoost using the grid search infrastructure in scikit-learn on the Otto dataset. Below we evaluate odd values for max_depth between 1 and 9 (1, 3, 5, 7, 9).
Each of the 5 configurations is evaluated using 10-fold cross validation, resulting in 50 models being constructed. The full code listing is provided below for completeness.
1
2
3
4
5
6
7
8
9
10
11
12
13
14
15
16
17
18
19
20
21
22
23
24
25
26
27
28
29
30
31
32
33
34
35
36
37
38
# XGBoost on Otto dataset, Tune max_depth
from pandas import read_csv
from xgboost import XGBClassifier
from sklearn.model_selection import GridSearchCV
from sklearn.model_selection import StratifiedKFold
print("Best: %f using %s"%(grid_result.best_score_,grid_result.best_params_))
means=grid_result.cv_results_['mean_test_score']
stds=grid_result.cv_results_['std_test_score']
params=grid_result.cv_results_['params']
formean,stdev,param inzip(means,stds,params):
print("%f (%f) with: %r"%(mean,stdev,param))
# plot
pyplot.errorbar(max_depth,means,yerr=stds)
pyplot.title("XGBoost max_depth vs Log Loss")
pyplot.xlabel('max_depth')
pyplot.ylabel('Log Loss')
pyplot.savefig('max_depth.png')
Running this example prints the log loss for each max_depth.
Note: Your results may vary given the stochastic nature of the algorithm or evaluation procedure, or differences in numerical precision. Consider running the example a few times and compare the average outcome.
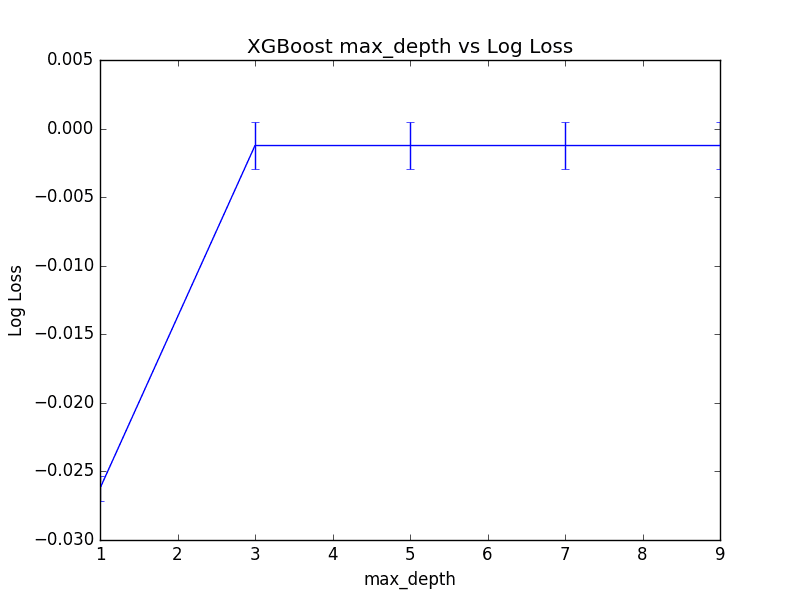
The optimal configuration was max_depth=5 resulting in a log loss of 0.001236.
1
2
3
4
5
6
Best: -0.001236 using {'max_depth': 5}
-0.026235 (0.000898) with: {'max_depth': 1}
-0.001239 (0.001730) with: {'max_depth': 3}
-0.001236 (0.001701) with: {'max_depth': 5}
-0.001237 (0.001701) with: {'max_depth': 7}
-0.001237 (0.001701) with: {'max_depth': 9}
Reviewing the plot of log loss scores, we can see a marked jump from max_depth=1 to max_depth=3 then pretty even performance for the rest the values of max_depth.
Although the best score was observed for max_depth=5, it is interesting to note that there was practically little difference between using max_depth=3 or max_depth=7.
This suggests a point of diminishing returns in max_depth on a problem that you can tease out using grid search. A graph of max_depth values is plotted against (inverted) logarithmic loss below.
Tune Max Tree Depth in XGBoost
Tune The Number of Trees and Max Depth in XGBoost
There is a relationship between the number of trees in the model and the depth of each tree.
We would expect that deeper trees would result in fewer trees being required in the model, and the inverse where simpler trees (such as decision stumps) require many more trees to achieve similar results.
We can investigate this relationship by evaluating a grid of n_estimators and max_depth configuration values. To avoid the evaluation taking too long, we will limit the total number of configuration values evaluated. Parameters were chosen to tease out the relationship rather than optimize the model.
We will create a grid of 4 different n_estimators values (50, 100, 150, 200) and 4 different max_depth values (2, 4, 6, 8) and each combination will be evaluated using 10-fold cross validation. A total of 4*4*10 or 160 models will be trained and evaluated.
The full code listing is provided below.
1
2
3
4
5
6
7
8
9
10
11
12
13
14
15
16
17
18
19
20
21
22
23
24
25
26
27
28
29
30
31
32
33
34
35
36
37
38
39
40
41
42
# XGBoost on Otto dataset, Tune n_estimators and max_depth
from pandas import read_csv
from xgboost import XGBClassifier
from sklearn.model_selection import GridSearchCV
from sklearn.model_selection import StratifiedKFold
Note: Your results may vary given the stochastic nature of the algorithm or evaluation procedure, or differences in numerical precision. Consider running the example a few times and compare the average outcome.
Running the code produces a listing of the logloss for each parameter pair.
1
2
3
4
5
6
7
8
9
10
11
12
13
14
15
16
17
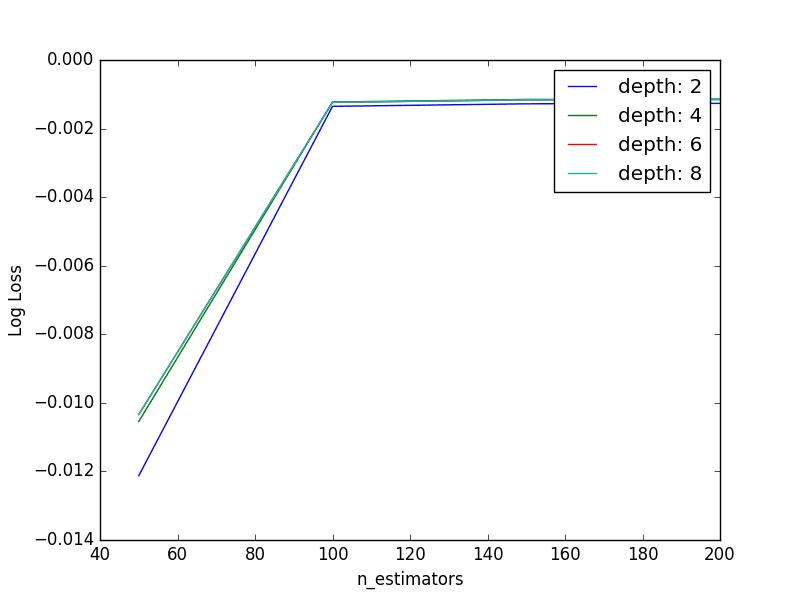
Best: -0.001141 using {'n_estimators': 200, 'max_depth': 4}
We can see that the best result was achieved with a n_estimators=200 and max_depth=4, similar to the best values found from the previous two rounds of standalone parameter tuning (n_estimators=250, max_depth=5).
We can plot the relationship between each series of max_depth values for a given n_estimators.
Tune The Number of Trees and Max Tree Depth in XGBoost
The lines overlap making it hard to see the relationship, but generally we can see the interaction we expect. Fewer boosted trees are required with increased tree depth.
Further, we would expect the increase complexity provided by deeper individual trees to result in greater overfitting of the training data which would be exacerbated by having more trees, in turn resulting in a lower cross validation score. We don’t see this here as our trees are not that deep nor do we have too many. Exploring this expectation is left as an exercise you could explore yourself.
Summary
In this post, you discovered how to tune the number and depth of decision trees when using gradient boosting with XGBoost in Python.
Specifically, you learned:
How to tune the number of decision trees in an XGBoost model.
How to tune the depth of decision trees in an XGBoost model.
How to jointly tune the number of trees and tree depth in an XGBoost model
Do you have any questions about the number or size of decision trees in your gradient boosting model or about this post? Ask your questions in the comments and I will do my best to answer.
Hey, nice article. I have one doubt. What is the difference between “running using XGBoostClassifier( parameter)” and “creating DMatrix, parameter list and then doing xgb.train()”.
Do these both methods yield same results .. why two ways of doing the same thing.
I have always used second one .. where n_estimators parameter is not there. You are using first method. Can you please explain ??
Thanks for sharing all this. I have applied sklearn’s XGBoostClassifier with GridSearchCV, but I find that xgboost without tuning leads to better accuracy & f1 score than after tuning.
Any ideas why this could be happening? Is there any reason why this might be the case?
1. In industries, when data scientists use xgboost do they also roughly play around with these these limited factors only – n_estimators,depth,score, learning rate etc.
2. If yes,then does not this tuning happen with a single Grid/random search on the model?
What is the relation between number of predictors and depth of the tree. If the depth of the tree is less than number of predictors, does it mean I am not using all predictors to make decision? Shall I keep tree depth = number of predictors?
It will select best for a single metric as far as I know.
Perhaps you could write your own metric that combines other metrics and combine them in a way where raking results in a pareto-optimal finding across the metrics.
On a Dell XPS laptop with Win10, running sklearn’s grid_search with the code as-is outputs an error, due to failed parallelism. Error:
“ImportError: [joblib] Attempting to do parallel computing without protecting your import on a system that does not support forking. To use parallel-computing in a script, you must protect your main loop using “if __name__ == ‘__main__'”. Please see the joblib documentation on Parallel for more information”
Hello, I read many of your articles and learned a lot from them.
As a stduent,I don’t have too much computation resource,and I wonder if the hyperparameter will still work well when the magnitude of data increases exponentially ? It will waste me a lot of time tunning hyperparameters on original data.
-I have the following strategy please let me know if that is optimal.
>Divide the data into Train,Hold-Out and Test set.
>Divide Train into Train and Eval.
>Perform Hyper parameter tuning on Train and get best params using Cross validation.
>Perform Early stopping to check the best ‘early_stopping_rounds’ using ‘Eval’ as an eval set.
>Now Use train using all the data from training set and predict using Hold-out to check the performance and go back to tuning if needed.
>Finally predict using ‘Test’ set.
I slightly modified your code to run it for the XGBRegressor, however while running CV to find the optimal number of trees I am getting the error:
TypeError: get_params() missing 1 required positional argument: ‘self’
On the line grid_result = grid)search.fit(X,y) is this because I have changed it to the regression model instead of the classification? How would I go about debugging this?
Ignore the last comment from Callum, I just missed out some brackets, I’ve got it working now, but have another error I think will be because its regression not classification.
In order to minimize the possibility of overfitting, I would like to make use of the difference ( (less than 1 % ) between the two RMSEs as a indicator of tree adding.
Just curious, do you think the program would train the models continuously in a warm-start fashion (for example for GBM with 50 trees, just add one more tree to a 49-tree model) or it basically retrain a model every time from ground zero? Sorry I’m a beginner in Python and its packages so haven’t really figured this out by myself from the source code.
The model is retrained from scratch each time. Training from a warm start would be preferred, it might be possible with the API but I have not investigated.
if the scoring in GridSearchCV set to be ‘precision’, may I still use cv_results_[‘mean_test_score’], cv_result_[‘std_test_score’], cv_results_[‘params’] and put them in the pyplot.errorbar() and draw the graph. Or I need to calculate and use other metrics. If I need to use other metrics to show precisions, what are they? thank you so much and have a great day!
Hi Jason,
while n_estimators and max_depth tuning I get RuntimeWarning: invalid value encountered in multiply loss = -(transformed_labels * np.log(y_pred)).sum(axis=1), may I know how to fix this,
Thanks
Thank you so much for such a great post. I am using lightgbm and when I increase the n_estimator, cv score is getting better. However I get worse score with high n_estimator in test set. I only tune n_estimator with gridsearch. The n_estimator interval is [200, 500, 1000, 2500, 5000] and cv scores(f1 scores) are [0.0889565 , 0.18166364, 0.26475717, 0.38393814, 0.43235423]
But 200 tree model gives much more f1 score than 5000 tree model in test set?
How can it happen? Can it be related with data leakage? Do you have any idea?
Many thanks your supports,
My best parameter is 100 trees with score of 0.001604. I used the exactly same code for the first part of the anaysis where you have applied gridsearch with n_estimators alone but the answer doesn’t match.
What would be causing the different values? Is it because of the random sampling under k-fold validation?
If yes, then how do I control the sampling? We use seed concept in Train_Test_Split to get constant split every time we run the code.
Is there any way to implement the same procedure of choosing the optimal values for max_depth and n_estimators for different combinations of the datasets’s features?
I know we can get the features importance by using the known function however the accuracy may vary in case choosing different combinations, am I wrong?
Hello Jason. Nice article. While going through the plots, noticed that the mean log loss and its standard deviation was a bit strange. Looked into the dataset and found that your training is using the 1st column (row ID) as feature set. After removing that, the log loss seemed reasonable. Just thought of sharing the observation
Hi Jason,
When using an XGBoost long-term, how (or what metrics) can we use to monitor the data drift or continued performance to know when we need to rebuild or retune? My model is built using XGBClassifier, eval_metric logloss and with the objective of binary:logistic. Any direction helps!
Monitoring an XGBoost model—or any machine learning model—over time is crucial for maintaining its performance as underlying data distributions change due to concept drift or other factors. For an XGBoost model used for binary classification, there are several strategies and metrics you can use to detect data drift and assess ongoing performance. This monitoring will help you determine when to retune or rebuild your model. Here’s a structured approach:
### 1. Performance Metrics
Keep track of performance metrics over time on a validation set that you periodically update or on new incoming data. Key metrics for binary classification include:
– **Accuracy**: While it’s a straightforward metric, it might not be sensitive to class imbalances.
– **Precision, Recall, F1-Score**: These are crucial for imbalanced datasets and provide a more detailed view of how well your model is performing on each class.
– **Log Loss (Cross-Entropy)**: Since you’re using logloss as an evaluation metric, monitoring its trend over time can directly signal performance shifts. Increases in log loss indicate a model’s decreasing probability estimation accuracy.
– **AUC-ROC**: The area under the Receiver Operating Characteristic curve is valuable for evaluating the performance across different classification thresholds and is insensitive to class imbalance.
### 2. Data Drift Detection
Data drift can be detected by monitoring changes in the distribution of features or the target variable over time. There are several approaches:
– **Statistical Tests**: Apply statistical tests (e.g., KS Test for continuous features, Chi-squared test for categorical features) periodically to detect significant changes in distributions of features between historical training data and new incoming data.
– **Feature Importance Monitoring**: Track changes in feature importance metrics provided by XGBoost. A significant shift in the importance of features could indicate changes in data dynamics.
– **Model-based Drift Detection**: Train a simple model to distinguish between old and new data. A significant performance (e.g., accuracy much better than random guessing) could indicate data drift.
### 3. Concept Drift Detection
Concept drift refers to changes in the relationship between input features and the target variable. Monitoring requires more nuanced approaches:
– **Monitoring Target Distribution**: For binary classification, changes in the proportion of classes over time can be a simple yet effective indicator.
– **Residuals Analysis**: Analyze the residuals of your predictions over time. Significant changes in the pattern or distribution of residuals can indicate concept drift.
– **Window-based Analysis**: Compare model performance on recent data to performance on historical data using a sliding window approach. Significant drops in performance suggest concept drift.
### 4. Automated Monitoring Tools
Consider using or developing automated monitoring tools that can track these metrics and alert you when certain thresholds are crossed. This approach can include:
– **Dashboarding**: Use tools like Grafana, Kibana, or custom dashboards to visualize key metrics in real-time.
– **Alerting Systems**: Implement systems that send alerts based on predefined rules (e.g., a significant increase in log loss or a decrease in AUC-ROC).
### 5. Continuous Learning
– **Online Learning**: For models requiring frequent updates, consider techniques that allow your model to learn incrementally from new data.
– **Periodic Retraining**: Based on the insights gained from monitoring, schedule periodic retraining of your model with new data to adapt to the changes.
### Conclusion
Effectively monitoring an XGBoost model requires a combination of performance metric tracking, data and concept drift detection, and the implementation of systems for continuous evaluation and adaptation. By establishing a robust monitoring framework, you can ensure that your model remains effective over time and can adapt to changes in the underlying data.


I love your teaching style.
I’ll be purchasing your package after I complete a course I’m working on.
Just a quick spelling error sir. (I read every single line) 🙂
“This dataset is available fro free”
Thanks again for all your free content and your concise explanations.
Thanks Mike, fixed!
Hey, nice article. I have one doubt. What is the difference between “running using XGBoostClassifier( parameter)” and “creating DMatrix, parameter list and then doing xgb.train()”.
Do these both methods yield same results .. why two ways of doing the same thing.
I have always used second one .. where n_estimators parameter is not there. You are using first method. Can you please explain ??
They should give the same results, but I like to use xgboost with the tools from sklearn.
Wonder tutorial on gridsearch for xgboost.
I want to know how to pass the argument booster =’gbtree’ or bosster=’dart’.
This how my code looks:
model = XGBClassifier(booster=’gbtree’,objective=’binary:logistic’)
n_estimators = [50, 100]
max_depth = [2, 3]
learning_rate=[0.05,0.15]
param_grid = dict(max_depth=max_depth, n_estimators=n_estimators, learning_rate=learning_rate)
kfold = StratifiedKFold(n_splits=5, shuffle=True, random_state=7)
grid_search = GridSearchCV(model, param_grid, scoring=”roc_auc”, n_jobs=1, cv=kfold, verbose=1)
grid_result = grid_search.fit(norm_X_train, y_train)
print(“Best: %f using %s” % (grid_result.best_score_, grid_result.best_params_))
means = grid_result.cv_results_[‘mean_test_score’]
stds = grid_result.cv_results_[‘std_test_score’]
params = grid_result.cv_results_[‘params’]
TypeError: __init__() got an unexpected keyword argument ‘booster’
I want to train the model with dart and gbtree seperately. How should i do it?
In R it can be done easily . In python it is showing the above error.
How can I save the best model from gridsearch?
Once you find the best set of parameters, you can train a new final model with those parameters.
Hi Jason,
Thanks for sharing all this. I have applied sklearn’s XGBoostClassifier with GridSearchCV, but I find that xgboost without tuning leads to better accuracy & f1 score than after tuning.
Any ideas why this could be happening? Is there any reason why this might be the case?
It could be overfitting the training data.
Hey Jason,
Great post.
1. In industries, when data scientists use xgboost do they also roughly play around with these these limited factors only – n_estimators,depth,score, learning rate etc.
2. If yes,then does not this tuning happen with a single Grid/random search on the model?
3. Are there any advanced things we can tune ?
Thanks
Yes, I recommend a grid search or random search of hyperparameter values to see what works best for your specific problem.
What is the relation between number of predictors and depth of the tree. If the depth of the tree is less than number of predictors, does it mean I am not using all predictors to make decision? Shall I keep tree depth = number of predictors?
It is specific to your data.
How to set refit parameter for multi-metric scoring and make the best_* attributes available for that metric
It will select best for a single metric as far as I know.
Perhaps you could write your own metric that combines other metrics and combine them in a way where raking results in a pareto-optimal finding across the metrics.
thank you very much you helped me a lot
I’m glad to hear that.
On a Dell XPS laptop with Win10, running sklearn’s grid_search with the code as-is outputs an error, due to failed parallelism. Error:
“ImportError: [joblib] Attempting to do parallel computing without protecting your import on a system that does not support forking. To use parallel-computing in a script, you must protect your main loop using “if __name__ == ‘__main__'”. Please see the joblib documentation on Parallel for more information”
This is a known issue (https://github.com/scikit-learn-contrib/hdbscan/issues/22).
To solve, need to wrap any non-function code or class with the standard: ‘if __name__ == “__main__”:’, as suggested in the error message.
Nice catch, thanks. Sorry, I don’t know about windows.
Fantastic article
Really helpful
Thanks.
Hello, I read many of your articles and learned a lot from them.
As a stduent,I don’t have too much computation resource,and I wonder if the hyperparameter will still work well when the magnitude of data increases exponentially ? It will waste me a lot of time tunning hyperparameters on original data.
Good question. It is hard to know.
Maybe…
Hi Jason , great Article !
What about using ‘early stopping’ .
-I have the following strategy please let me know if that is optimal.
>Divide the data into Train,Hold-Out and Test set.
>Divide Train into Train and Eval.
>Perform Hyper parameter tuning on Train and get best params using Cross validation.
>Perform Early stopping to check the best ‘early_stopping_rounds’ using ‘Eval’ as an eval set.
>Now Use train using all the data from training set and predict using Hold-out to check the performance and go back to tuning if needed.
>Finally predict using ‘Test’ set.
Let me know your thoughts.
thanks,
Chuck.
Yes, try early stopping and see if it helps on your specific config/dataset.
Hi Jason,
I slightly modified your code to run it for the XGBRegressor, however while running CV to find the optimal number of trees I am getting the error:
TypeError: get_params() missing 1 required positional argument: ‘self’
On the line
grid_result = grid)search.fit(X,y)is this because I have changed it to the regression model instead of the classification? How would I go about debugging this?Sorry to hear that.
Is your version of sklearn and xgboost up to date?
Hi Jason,
Ignore the last comment from Callum, I just missed out some brackets, I’ve got it working now, but have another error I think will be because its regression not classification.
No problem.
Remember to calculate error, not accuracy for regression.
Hi Jason,
I’m studying Xgboost with your pdf book.
I would like to ask about the number of n_estimator.
In my Xgboost model, as the number of n_estimator increase, the validation RMSE continues to decrease.
Some Xgboost-related documents recommend that the number of n_estimator should be less than 500.
How can I determine the number of n_estimator ?
I recommend increasing the n_estimators until the error levels out.
Thank you for your answer.
My boost model is regression model.
Thus, I have monitored the variation of training and validation RMSE in the model training.
I tried to increase the n_estimators until 10,000.
However, validation RMSE continued to decrease.
In that case, to prevent overffing, do I determine the n_estimators based on the degree of validation RMSE reduction?
Or should I continue to increase n_estimators as with your suggestion?
You cannot overfit by increasing n_estimators.
I recommend continue adding trees until you see no further decrease in RMSE.
I really appreciate your reply.
As I known, for an ideal model, the gap between training and validation RMSE should be small.
The reason I judge that overfitting occurs is because the difference between training and validation RMSE increases as n_estimators increase.
Do I need to increase the number of n_estimators constantly according to your reply even if the gap between raninng and Validation RMSE is large?
I’m sorry to ask too basic question.
I have a lot of questions because it is the first time to develop an ensemble model based on decision tree.
Thank you again for your kind answers.
If you are seeing overfitting, perhaps you can use early stopping against the validation dataset.
Thank you for fast reply.
In order to minimize the possibility of overfitting, I would like to make use of the difference ( (less than 1 % ) between the two RMSEs as a indicator of tree adding.
Is this standard reasonable
Use data to make decisions, perhaps test it?
Thanks for sharing this! Looks amazing 🙂
Just curious, do you think the program would train the models continuously in a warm-start fashion (for example for GBM with 50 trees, just add one more tree to a 49-tree model) or it basically retrain a model every time from ground zero? Sorry I’m a beginner in Python and its packages so haven’t really figured this out by myself from the source code.
You’re welcome.
The model is retrained from scratch each time. Training from a warm start would be preferred, it might be possible with the API but I have not investigated.
If you explore this approach, let me know!
grid_search = GridSearchCV(model, param_grid, scoring=”precision”, n_jobs=-1, cv=kfold, verbose=1)
grid_result = grid_search.fit(X, label_encoded_y)
# summarize results
print(“Best: %f using %s” % (grid_result.best_score_, grid_result.best_params_))
means = grid_result.cv_results_[‘mean_test_score’]
stds = grid_result.cv_results_[‘std_test_score’]
params = grid_result.cv_results_[‘params’]
for mean, stdev, param in zip(means, stds, params):
print(“%f (%f) with: %r” % (mean, stdev, param))
# plot
pyplot.errorbar(max_depth, means, yerr=stds)
pyplot.title(“XGBoost max_depth vs Log Loss”)
pyplot.xlabel(‘max_depth’)
pyplot.ylabel(‘Log Loss’)
pyplot.savefig(‘max_depth.png’)
My question is:
if the scoring in GridSearchCV set to be ‘precision’, may I still use cv_results_[‘mean_test_score’], cv_result_[‘std_test_score’], cv_results_[‘params’] and put them in the pyplot.errorbar() and draw the graph. Or I need to calculate and use other metrics. If I need to use other metrics to show precisions, what are they? thank you so much and have a great day!
I believe it will report whatever metric you choose.
Hi Jason,
while n_estimators and max_depth tuning I get RuntimeWarning: invalid value encountered in multiply loss = -(transformed_labels * np.log(y_pred)).sum(axis=1), may I know how to fix this,
Thanks
Sorry, I have not seen this error before, perhaps some of these suggestions will help:
https://machinelearningmastery.com/faq/single-faq/why-does-the-code-in-the-tutorial-not-work-for-me
Hi Jason,
Whether n_estimators is no longer required to tune, it is not in the list https://xgboost.readthedocs.io/en/latest/parameter.html
Thanks
It still exists and controls the number of trees in the ensemble.
Hi Jason,
Thank you so much for such a great post. I am using lightgbm and when I increase the n_estimator, cv score is getting better. However I get worse score with high n_estimator in test set. I only tune n_estimator with gridsearch. The n_estimator interval is [200, 500, 1000, 2500, 5000] and cv scores(f1 scores) are [0.0889565 , 0.18166364, 0.26475717, 0.38393814, 0.43235423]
But 200 tree model gives much more f1 score than 5000 tree model in test set?
How can it happen? Can it be related with data leakage? Do you have any idea?
Many thanks your supports,
Focus on performance in the test set and ensure the test set is sufficiently representative of the training dataset / broader problem.
Hi Jason,
My best parameter is 100 trees with score of 0.001604. I used the exactly same code for the first part of the anaysis where you have applied gridsearch with n_estimators alone but the answer doesn’t match.
What would be causing the different values? Is it because of the random sampling under k-fold validation?
If yes, then how do I control the sampling? We use seed concept in Train_Test_Split to get constant split every time we run the code.
Thanks 🙂
Good question, see this:
https://machinelearningmastery.com/different-results-each-time-in-machine-learning/
Hello Jason,
Is there any way to implement the same procedure of choosing the optimal values for max_depth and n_estimators for different combinations of the datasets’s features?
I know we can get the features importance by using the known function however the accuracy may vary in case choosing different combinations, am I wrong?
Try each value in turn and use whatever works best for your dataset.
So the only way is to create iterations with different features combination and find the best accuracy for my dataset.
Thanks for the response.
Hello Jason. Nice article. While going through the plots, noticed that the mean log loss and its standard deviation was a bit strange. Looked into the dataset and found that your training is using the 1st column (row ID) as feature set. After removing that, the log loss seemed reasonable. Just thought of sharing the observation
Thank you for the feedback Madhu! To your point, feature selection is often beneficial and should be considered.
Hi Jason,
When using an XGBoost long-term, how (or what metrics) can we use to monitor the data drift or continued performance to know when we need to rebuild or retune? My model is built using XGBClassifier, eval_metric logloss and with the objective of binary:logistic. Any direction helps!
Thank you for your time,
Allie
Hi Allie,
Monitoring an XGBoost model—or any machine learning model—over time is crucial for maintaining its performance as underlying data distributions change due to concept drift or other factors. For an XGBoost model used for binary classification, there are several strategies and metrics you can use to detect data drift and assess ongoing performance. This monitoring will help you determine when to retune or rebuild your model. Here’s a structured approach:
### 1. Performance Metrics
Keep track of performance metrics over time on a validation set that you periodically update or on new incoming data. Key metrics for binary classification include:
– **Accuracy**: While it’s a straightforward metric, it might not be sensitive to class imbalances.
– **Precision, Recall, F1-Score**: These are crucial for imbalanced datasets and provide a more detailed view of how well your model is performing on each class.
– **Log Loss (Cross-Entropy)**: Since you’re using
loglossas an evaluation metric, monitoring its trend over time can directly signal performance shifts. Increases in log loss indicate a model’s decreasing probability estimation accuracy.– **AUC-ROC**: The area under the Receiver Operating Characteristic curve is valuable for evaluating the performance across different classification thresholds and is insensitive to class imbalance.
### 2. Data Drift Detection
Data drift can be detected by monitoring changes in the distribution of features or the target variable over time. There are several approaches:
– **Statistical Tests**: Apply statistical tests (e.g., KS Test for continuous features, Chi-squared test for categorical features) periodically to detect significant changes in distributions of features between historical training data and new incoming data.
– **Feature Importance Monitoring**: Track changes in feature importance metrics provided by XGBoost. A significant shift in the importance of features could indicate changes in data dynamics.
– **Model-based Drift Detection**: Train a simple model to distinguish between old and new data. A significant performance (e.g., accuracy much better than random guessing) could indicate data drift.
### 3. Concept Drift Detection
Concept drift refers to changes in the relationship between input features and the target variable. Monitoring requires more nuanced approaches:
– **Monitoring Target Distribution**: For binary classification, changes in the proportion of classes over time can be a simple yet effective indicator.
– **Residuals Analysis**: Analyze the residuals of your predictions over time. Significant changes in the pattern or distribution of residuals can indicate concept drift.
– **Window-based Analysis**: Compare model performance on recent data to performance on historical data using a sliding window approach. Significant drops in performance suggest concept drift.
### 4. Automated Monitoring Tools
Consider using or developing automated monitoring tools that can track these metrics and alert you when certain thresholds are crossed. This approach can include:
– **Dashboarding**: Use tools like Grafana, Kibana, or custom dashboards to visualize key metrics in real-time.
– **Alerting Systems**: Implement systems that send alerts based on predefined rules (e.g., a significant increase in log loss or a decrease in AUC-ROC).
### 5. Continuous Learning
– **Online Learning**: For models requiring frequent updates, consider techniques that allow your model to learn incrementally from new data.
– **Periodic Retraining**: Based on the insights gained from monitoring, schedule periodic retraining of your model with new data to adapt to the changes.
### Conclusion
Effectively monitoring an XGBoost model requires a combination of performance metric tracking, data and concept drift detection, and the implementation of systems for continuous evaluation and adaptation. By establishing a robust monitoring framework, you can ensure that your model remains effective over time and can adapt to changes in the underlying data.