Whether working on a machine learning project, a simulation, or other models, you need to generate random numbers in your code. R as a programming language, has several functions for random number generation. In this post, you will learn about them and see how they can be used in a larger program. Specifically, you will learn
- How to generate Gaussian random numbers into a vector
- How to generate uniform random numbers
- How to manipulate random vectors and random matrices
Let’s get started.

Generating Random Numbers in R.
Photo by Kaysha. Some rights reserved.
Overview
This post is divided into three parts; they are:
- Random Number Generators
- Correlated Multivariate Gaussian Random Number
- Generating Random Numbers From Uniform Distribution
Random Number Generators
Random numbers are drawn from probability distributions. The most famous distribution should be the Gaussian distribution, also known as the normal distribution.
The standard normal distribution is defined by its density function, $f(x) = (2\pi)^{-1/2} \exp(-x^2/2)$. It has a range of the entire real number, i.e., from negative infinity to positive infinity. Integrating $f(x)$ over this range gives the result 1.0. In mathematics, we have the distribution function $F(x) = \int_{-\infty}^x (2\pi)^{-1/2} \exp(-t^2/2) dt$ defined as the probability that a number is below $x$ in the standard normal distribution.
In R, you have not only the random number generator function based on the standard normal distribution but a few other auxiliary functions as well:
dnorm(x): The density function $f(x)$pnorm(x): The distribution function $F(x)$qnorm(x): The quantile function $F^{-1}(x)$ as the inverse function of $F(x)$rnorm(k): The random number generator function
The functions dnorm(x), pnorm(x), qnorm(x) would be useful in some projects that you need to deal with some other probability distribution. The function rnorm(k) is the function that gives you a vector of k random values that are drawn from the standard normal distribution. This is the function you use most often.
You can tell that this is the random number generator that produces output from the standard normal distribution by getting a lot of samples from it and plot a histogram:
|
1 |
hist(rnorm(10000), breaks=30, freq=FALSE) |
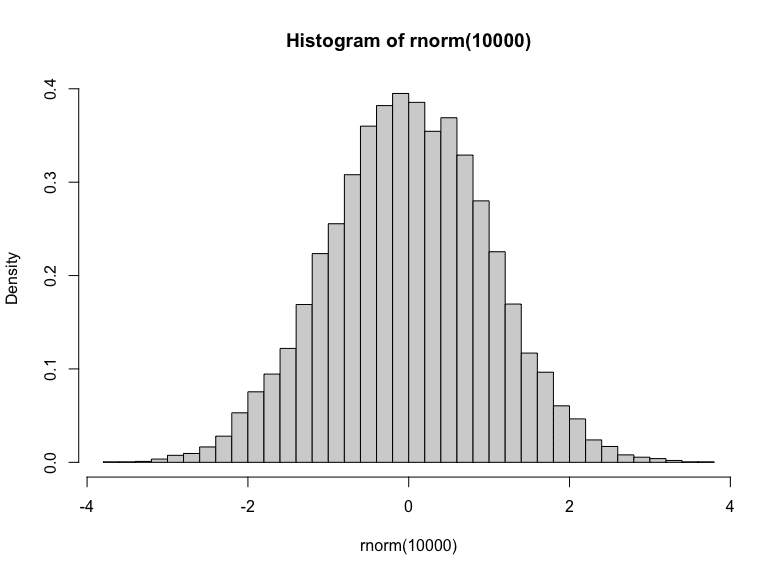
Histogram of Gaussian random numbers
You can see a bell-shaped histogram centered at zero in the plot. Also, you can tell that majority of the samples are between -1 to +1 (68% of them, to be precise). The freq=FALSE parameter in the hist() function makes the $y$-axis in density instead of frequency. Hence you can match the histogram with the density function.
Correlated Multivariate Gaussian Random Number
One common use case of standard normal random number generator is to create pairs of correlated Gaussian random number. In other words, you want some bivariate Gaussian random numbers with non-zero correlation.
The algorithm to generate such correlated random numbers is:
- First, generate same number of independent standard normal random numbers
- Set up the covariance matrix to specify how the different random numbers are related
- Take the Cholesky decomposition of the covariance matrix
- Multiply the matrix of independent standard normal random numbers with the Cholesky decomposition matrix
- Optionally, adjust the mean
In code, it is:
|
1 2 3 4 5 6 7 8 9 10 11 12 13 14 15 16 17 18 19 |
# bivariate Gaussian n_fea <- 2 # Number of random values per observation (n) n_obs <- 1000 # Number of observations to create (k) means <- c(0, 1) # mean of the random values vars <- c(1., 1.) # variances of the random values corr <- matrix( # the correlation matrix c(1.0, 0.6, 0.6, 1.0), byrow = TRUE, nrow = 2 ) sd.diag <- diag(sqrt(vars)) cov <- sd.diag %*% corr %*% sd.diag # covariance matrix cholesky <- chol(cov) # Cholesky decomposition obs <- matrix(rnorm(n_fea * n_obs), nrow=n_obs) # nxk matrix of i.i.d. Gaussian random values samples <- (obs %*% cholesky) + rep(means, each=nrow(obs)) print(samples) |
Most of the code above is intuitive. The tricky part is adjusting the mean: Standard Gaussian random numbers are centered at zero. The Cholesky decomposition matrix obtained from the line cholesky <- chol(cov) can only adjust the covariance without adjusting the mean. To shift the mean value, you need to add a value uniformly on each column. In the above, you repeat the vector into a matrix of the same shape as the random observation so you can add them.
How you can tell this is correct? One way is to verify the statistics. You can compute and print the correlation matrix, the column mean, and column standard deviation as follows:
|
1 2 3 4 5 6 |
... # verify the result print(cor(samples)) # expect to match the correlation matrix print(colMeans(samples)) # expect to match the sample mean print(apply(samples, 2, sd)) # expect to match the variances |
These three lines should print the empirical correlation matrix, the mean, and the standard deviation respectively. You can also try to plot the random numbers as a scatter plot:
|
1 2 3 |
... plot(samples[, 1], samples[, 2]) |
Which should look like the following:
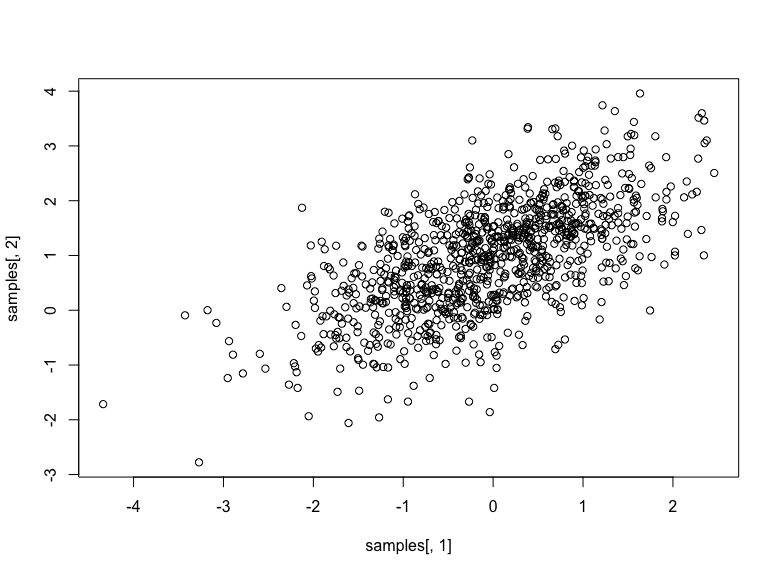
Bivariate Gaussian random numbers with mean at (0,1) and correlation 0.6
Putting everything together, the following is the complete code:
|
1 2 3 4 5 6 7 8 9 10 11 12 13 14 15 16 17 18 19 20 21 22 23 24 25 26 27 |
# bivariate Gaussian n_fea <- 2 # Number of random values per observation (n) n_obs <- 1000 # Number of observations to create (k) means <- c(0, 1) # mean of the random values vars <- c(1., 1.) # variances of the random values corr <- matrix( # the correlation matrix c(1.0, 0.6, 0.6, 1.0), byrow = TRUE, nrow = 2 ) sd.diag <- diag(sqrt(vars)) cov <- sd.diag %*% corr %*% sd.diag # covariance matrix chol <- chol(cov) # Cholesky decomposition obs <- matrix(rnorm(n_fea * n_obs), nrow=n_obs) # nxk matrix of i.i.d. Gaussian random values samples <- (obs %*% chol) + rep(means, each=nrow(obs)) print(samples) # verify the result print(cor(samples)) # expect to match the correlation matrix print(colMeans(samples)) # expect to match the sample mean print(apply(samples, 2, sd)) # expect to match the variances # scatter plot plot(samples[, 1], samples[, 2]) |
Generating Random Numbers From Uniform Distribution
Gaussian is the most used distribution. But there are chances that you will need a different distribution. One example is to simulate the arrival time of the next phone call on a hotline. This is a classic example of the exponential distribution. Obviously, it is not Gaussian since Gaussian random values can be negative.
The exponential distribution has a density function $f(x) = \lambda \exp(-\lambda x)$. Since $x$ runs from zero to positive infinity, the distribution function is $F(x) = 1-\exp(-\lambda x)$. Recall that a distribution function has a value between 0 and 1.
With an arbitrary distribution function, you can use the inverse transform sampling method to generate random numbers using a uniform distribution. The idea is that you can consider $F(x)$ as the standard uniform distribution. Then you can look up the value of $x$ as the generated random number. In this case, you need to define the inverse of the distribution function $F^{-1}(x)$.
The inverse function in exponential distribution is trivial: Set $y = 1 – exp(-lambda x)$, then $x = -\log(1-y)/\lambda$. Hence $F^{-1}(x) = -\log(1-y)/\lambda$. In R, you can generate exponential distributed random numbers as follows:
|
1 2 3 4 5 6 7 8 9 10 |
# Generate random numbers following the exponential distribution lambda <- 2.5 # parameter: arrival rate F.inv <- function(x) { return(-log(1-x)/lambda) } n <- 1000 # number of samples to generate x <- runif(n) x <- F.inv(x) print(x) |
In the above, you used not rnorm() function but runif() function for a uniform distribution between 0 and 1. There are a whole set of functions for uniform distribution, too, such as dunif() and punif().
You knows the generated numbers follows an exponential distribution if you plot the histogram from the generated numbers:
|
1 |
hist(x, breaks=30, freq=FALSE) |
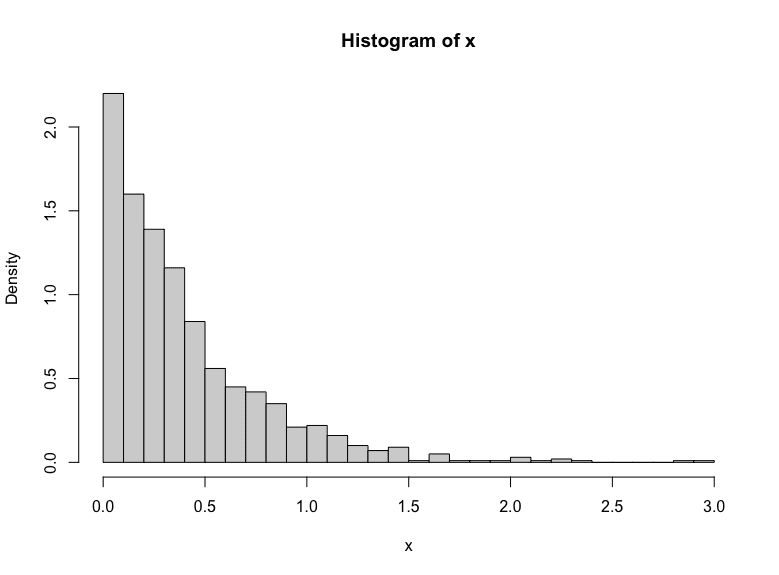
Exponential distribution generated empirically.
This technique would be useful when you build a discrete event simulation model in R.
Further Readings
You can learn more about the above topics from the following:
Website
- The R Manuals
- Multivariate normal distribution, Wikipedia
- Exponential Distirbution, Wikipedia
- Inverse transform sampling, Wikipedia
Summary
In this post, you learned how to generate random numbers in R. Specifically, you learned:
- The suite of functions in R for probability distributions and random number generation
- How to create random numbers in Gaussian distribution
- How to create random numbers in uniform distribution
- How to make use of the random number generators to create multivariate Gaussian distribution or other distribution using the inverse transform method.


Sorry how do you generate uniform random numbers in [0,1]x[0,1]?