We have an intuition that more observations is better.
This is the same intuition behind the idea that if we collect more data, our sample of data will be more representative of the problem domain.
There is a theorem in statistics and probability that supports this intuition that is a pillar of both of these fields and has important implications in applied machine learning. The name of this theorem is the law of large numbers.
In this tutorial, you will discover the law of large numbers and why it is important in applied machine learning.
After completing this tutorial, you will know:
- The law of large numbers supports the intuition that the sample becomes more representative of the population as its size is increased.
- How to develop a small example in Python to demonstrate the decrease in error from the increase in sample size.
- The law of large numbers is critical for understanding the selection of training datasets, test datasets, and in the evaluation of model skill in machine learning.
Kick-start your project with my new book Statistics for Machine Learning, including step-by-step tutorials and the Python source code files for all examples.
Let’s get started.

A Gentle Introduction to the Law of Large Numbers in Machine Learning
Photo by Raheel Shahid, some rights reserved.
Tutorial Overview
This tutorial is divided into 3 parts; they are:
- Law of Large Numbers
- Worked Example
- Implications in Machine Learning
Need help with Statistics for Machine Learning?
Take my free 7-day email crash course now (with sample code).
Click to sign-up and also get a free PDF Ebook version of the course.
Law of Large Numbers
The law of large numbers is a theorem from probability and statistics that suggests that the average result from repeating an experiment multiple times will better approximate the true or expected underlying result.
The law of large numbers explains why casinos always make money in the long run.
— Page 79, Naked Statistics: Stripping the Dread from the Data, 2014.
We can think of a trial of an experiment as one observation. The standalone and independent repetition of the experiment will perform multiple trials and lead to multiple observations. All sample observations for an experiment are drawn from an idealized population of observations.
- Observation: Result from one trial of an experiment.
- Sample: Group of results gathered from separate independent trials.
- Population: Space of all possible observations that could be seen from a trial.
Using these terms from statistics, we can say that as the size of the sample increases, the mean value of the sample will better approximate the mean or expected value in the population. As the sample size goes to infinity, the sample mean will converge to the population mean.
… a crowning achievement in probability, the law of large numbers. This theorem says that the mean of a large sample is close to the mean of the distribution.
— Page 76, All of Statistics: A Concise Course in Statistical Inference, 2004.
This is an important theoretical finding for statistics and probability, as well as for applied machine learning.
Independent and Identically Distributed
It is important to be clear that the observations in the sample must be independent.
This means that the trial is run in an identical manner and does not depend on the results of any other trial. This is often reasonable and easy to achieve in computers, although can be difficult elsewhere (e.g. how do you achieve identically random rolls of a dice?).
In statistics, this expectation is called “independent and identically distributed,” or IID, iid, or i.i.d. for short. This is to ensure that the samples are indeed drawn from the same underlying population distribution.
Regression to the Mean
The law of large numbers helps us understand why we cannot trust a single observation from an experiment in isolation.
We expect that a single result or the mean result from a small sample is likely. That is close to the central tendency, the mean of the population distribution. It may not be; in fact, it may be very strange or unlikely.
The law reminds us to repeat the experiment in order to develop a large and representative sample of observations before we start making inferences about what the result means.
As we increase the sample size, the finding or mean of the sample will move back toward the population mean, back toward the true underlying expected value. This is called regression to the mean or sometimes reversion to the mean.
It is why we must be skeptical of inferences from small sample sizes, called small n.
Law of Truly Large Numbers
Related to the regression to the mean is the idea of the law of truly large numbers.
This is the idea that when we start investigating or working with extremely large samples of observations, we increase the likelihood of seeing something strange. That by having so many samples of the underlying population distribution, the sample will contain some astronomically rare events.
Again, we must be wary not to make inferences from single cases.
This is especially important to consider when running queries and investigating big data.
Worked Example
We can demonstrate the law of large numbers with a small worked example.
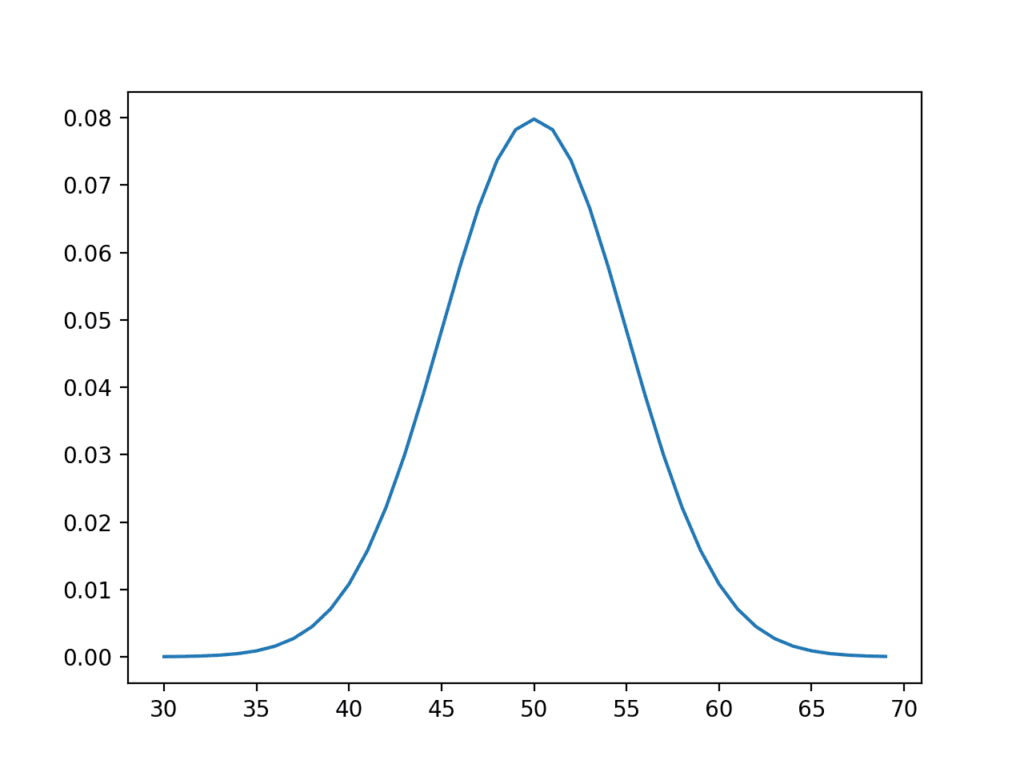
First, we can design an idealized underlying distribution. We will use a Gaussian distribution with a mean of 50 and a standard deviation of 5. The expected value or mean of this population is therefore 50.
Below is some code that generates a plot of this idealized distribution.
|
1 2 3 4 5 6 7 8 9 10 11 |
# idealized population distribution from numpy import arange from matplotlib import pyplot from scipy.stats import norm # x-axis for the plot xaxis = arange(30, 70, 1) # y-axis for the plot yaxis = norm.pdf(xaxis, 50, 5) # plot ideal population pyplot.plot(xaxis, yaxis) pyplot.show() |
Running the code creates a plot of the designed population with the familiar bell shape.

Idealized Underlying Population Distribution
Now, we can pretend to forget everything that we know about the population and make independent random samples from the population.
We can create samples of different sizes and calculate the mean. Given our intuition and the law of large numbers, we expect that as the size of the sample is increased, the sample mean will better approximate the population mean.
The example below calculates samples of different sizes then prints the sample means.
|
1 2 3 4 5 6 7 8 9 10 11 12 13 14 15 16 |
# demonstrate the law of large numbers from numpy.random import seed from numpy.random import randn from numpy import mean from numpy import array from matplotlib import pyplot # seed the random number generator seed(1) # sample sizes sizes = [10, 100, 500, 1000, 10000] # generate samples of different sizes and calculate their means means = [mean(5 * randn(size) + 50) for size in sizes] print(means) # plot sample mean error vs sample size pyplot.scatter(sizes, array(means)-50) pyplot.show() |
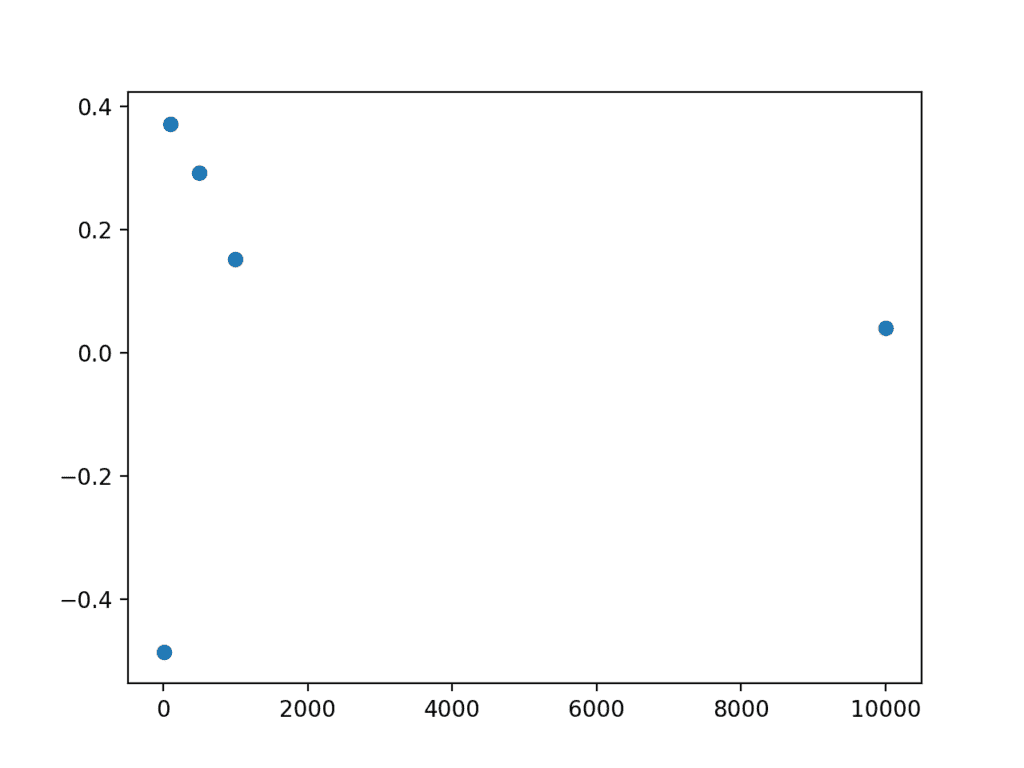
Running the example first prints the means of each sample.
We can see a loose trend of the sample mean getting closer to 50.0 as the sample size increases.
Note too that this sample of sample means too must suffer the law of large numbers. For example, by chance you may get a very accurate estimate of the population mean with the mean of a small sample.
|
1 |
[49.5142955459695, 50.371593294898695, 50.2919653390298, 50.1521157689338, 50.03955033528776] |
The example also creates a plot that compares the size of the sample to the error of the sample mean from the population mean. Generally, we can see that larger sample sizes have less error, and we would expect this trend to continue, on average.
We can also see that some sample means overestimate and some underestimate. Do not fall into the trap of assuming that the underestimate will fall on one side or another.

Scatter plot of sample size vs error
Implications in Machine Learning
The law of large numbers has important implications in applied machine learning.
Let’s take a moment to highlight a few of these implications.
Training Data
The data used to train the model must be representative of the observations from the domain.
This really means that it must contain enough information to generalize to the true unknown and underlying distribution of the population.
This is easy to conceptualize with a single input variable for a model, but is also just as important when you have multiple input variables. There will be unknown relationships or dependencies between the input variables and together, the input data will represent a multivariate distribution from which observations will be drawn to comprise your training sample.
Keep this in mind during data collection, data cleaning, and data preparation.
You may choose to exclude sections of the underlying population by setting hard limits on observed values (e.g. for outliers) where you expect data to be too sparse to model effectively.
Test Data
The thoughts given to the training dataset must also be given to the test dataset.
This is often neglected with the blind use of 80/20 spits for train/test data or the blind use of 10-fold cross-validation, even on datasets where the size of 1/10th of the available data may not be a suitable representative of observations from the problem domain.
Model Skill Evaluation
Consider the law of large numbers when presenting the estimated skill of a model on unseen data.
It provides a defense for not simply reporting or proceeding with a model based on a skill score from a single train/test evaluation.
It highlights the need to develop a sample of multiple independent (or close to independent) evaluations of a given model such that the mean reported skill from the sample is an accurate enough estimate of population mean.
Extensions
This section lists some ideas for extending the tutorial that you may wish to explore.
- Brainstorm two additional areas of machine learning where the law of large numbers applies.
- Find five research papers where you are skeptical of the results given the law of large numbers.
- Develop your own ideal distribution and samples and plot the relationship between sample size and sample mean error.
If you explore any of these extensions, I’d love to know.
Further Reading
This section provides more resources on the topic if you are looking to go deeper.
Books
- Naked Statistics: Stripping the Dread from the Data, 2014.
- All of Statistics: A Concise Course in Statistical Inference, 2004.
API
Articles
- Law of large numbers on Wikipedia
- Independent and identically distributed random variables on Wikipedia
- Law of truly large numbers on Wikipedia
- Regression toward the mean
Summary
In this tutorial, you discovered the law of large numbers and why it is important in applied machine learning.
Specifically, you learned:
- The law of large numbers supports the intuition that the sample becomes more representative of the population as its size is increased.
- How to develop a small example in Python to demonstrate the decrease in error from the increase in sample size.
- The law of large numbers is critical for understanding the selection of training datasets, test datasets, and in the evaluation of model skill in machine learning.
Do you have any questions?
Ask your questions in the comments below and I will do my best to answer.


Good explanation…. thanks Jason. Just today I was watching a video entitled “Is learning feasible” by Prof Abu – Mostafa and I think it will be interesting to share it in this article … He mentioned Hoeffding Inequality and its relationship with Law of large numbers in the context of Machine Learning… Prof. Abu-Mustafa is very didactic when explain mathematical aspects of Machine Learning… IMHO.
https://www.youtube.com/watch?v=MEG35RDD7RA&index=1&list=PLD63A284B7615313A
Thanks for sharing.
I cannot use the first code
help please
Traceback (most recent call last):
File “C:/Users/Acer E5-471G/PycharmProjects/test/Test.py”, line 4, in
from scipy.stats import norm
ModuleNotFoundError: No module named ‘scipy’
This what i got
It looks like you need to install scipy, perhaps this tutorial will help:
https://machinelearningmastery.com/setup-python-environment-machine-learning-deep-learning-anaconda/
I have a question. How large does a number have to be before it can be considered a large enough number? I’ve been rolling two regular dice for seven hundred fifty times, and probability would suggest that the number seven should come up most. However, in my case, the number eight is beating seven, just barely. Could something odd be going on?
The result scales with the number of samples.
In your case, you can expect minor statistical fluctuations, even with a large number of samples. You could try pushing out to 1 million or a 1 billion and you should see stronger convergence to the base probabilities.
Thanks for replying. I just wish that there was a way to know how large a number needs to be in a given situation before it starts to conform to what is expected – or for something weird to be going on. I’ll keep rolling the dice and see what happens…and, yes, I am, actually, physically, rolling dice.
Standard error is often used to estimate the error of a mean of samples, perhaps that helps?
Hi Jason,
Can you please answer this from your post?
“Brainstorm two additional areas of machine learning where the law of large numbers applies”.
Also this from another post:
“Suggest two additional areas in an applied machine learning where the central limit theorem may be relevant”
Hi Neha…You may find the following of interest:
https://medium.com/analytics-vidhya/the-complete-beginners-guide-to-law-of-large-numbers-5-facts-about-law-of-large-numbers-e33cf0e10ffe
https://machinelearningmastery.com/a-gentle-introduction-to-the-central-limit-theorem-for-machine-learning/