An important decision point when working with a sample of data is whether to use parametric or nonparametric statistical methods.
Parametric statistical methods assume that the data has a known and specific distribution, often a Gaussian distribution. If a data sample is not Gaussian, then the assumptions of parametric statistical tests are violated and nonparametric statistical methods must be used.
There are a range of techniques that you can use to check if your data sample deviates from a Gaussian distribution, called normality tests.
In this tutorial, you will discover the importance of checking whether a data sample deviates from the normal distribution and a suite of techniques that you can use to evaluate your data sample.
After completing this tutorial, you will know:
- How whether a sample is normal dictates the types of statistical methods to use with a data sample.
- Graphical methods for qualifying deviations from normal, such as histograms and the Q-Q plot.
- Statistical normality tests for quantifying deviations from normal.
Kick-start your project with my new book Statistics for Machine Learning, including step-by-step tutorials and the Python source code files for all examples.
Let’s get started.
- Update May/2018: Updated interpretation of results for Anderson-Darling test, thanks Elie.
- Update May/2018: Updated language about “reject” vs “failure to reject” H0.

A Gentle Introduction to Normality Tests in Python
Photo by Ramoun Cabuhay, some rights reserved.
Tutorial Overview
This tutorial is divided into 5 parts; they are:
- Normality Assumption
- Test Dataset
- Visual Normality Checks
- Statistical Normality Tests
- What Test Should You Use?
Need help with Statistics for Machine Learning?
Take my free 7-day email crash course now (with sample code).
Click to sign-up and also get a free PDF Ebook version of the course.
Normality Assumption
A large fraction of the field of statistics is concerned with data that assumes that it was drawn from a Gaussian distribution.
If methods are used that assume a Gaussian distribution, and your data was drawn from a different distribution, the findings may be misleading or plain wrong.
There are a number of techniques that you can check if your data sample is Gaussian or sufficiently Gaussian-like to use the standard techniques, or sufficiently non-Gaussian to instead use non-parametric statistical methods.
This is a key decision point when it comes to choosing statistical methods for your data sample. We can summarize this decision as follows:
|
1 2 3 4 |
If Data Is Gaussian: Use Parametric Statistical Methods Else: Use Nonparametric Statistical Methods |
There is also some middle ground where we can assume that the data is Gaussian-enough to use parametric methods or that we can use data preparation techniques to transform the data to be sufficiently Gaussian to use the parametric methods.
There are three main areas where you may need to make this evaluation of a data sample in a machine learning project; they are:
- Input data to the model in the case of fitting models.
- Model evaluation results in the case of model selection.
- Residual errors from model predictions in the case of regression.
In this tutorial, we will look at two classes of techniques for checking whether a sample of data is Gaussian:
- Graphical Methods. These are methods for plotting the data and qualitatively evaluating whether the data looks Gaussian.
- Statistical Tests. These are methods that calculate statistics on the data and quantify how likely it is that the data was drawn from a Gaussian distribution.
Methods of this type are often called normality tests.
Test Dataset
Before we start looking at normality tests, let’s first develop a test dataset that we can use throughout this tutorial.
We will generate a small sample of random numbers drawn from a Gaussian distribution.
The choice of Gaussian random numbers for the test dataset means that we do expect each test to correctly identify the distribution, nevertheless, the small-ish sample size may introduce some noise into the results.
We will use the randn() NumPy function to generate random Gaussian numbers with a mean of 0 and a standard deviation of 1, so-called standard, normal variables. We will then shift them to have a mean of 50 and a standard deviation of 5.
The complete example is listed below.
|
1 2 3 4 5 6 7 8 9 10 11 |
# generate gaussian data from numpy.random import seed from numpy.random import randn from numpy import mean from numpy import std # seed the random number generator seed(1) # generate univariate observations data = 5 * randn(100) + 50 # summarize print('mean=%.3f stdv=%.3f' % (mean(data), std(data))) |
Running the example generates the sample and prints the mean and standard deviation of the sample.
We can see that the mean and standard deviation are reasonable but rough estimations of the true underlying population mean and standard deviation, given the small-ish sample size.
|
1 |
mean=50.303 stdv=4.426 |
Visual Normality Checks
We can create plots of the data to check whether it is Gaussian.
These checks are qualitative, so less accurate than the statistical methods we will calculate in the next section. Nevertheless, they are fast and like the statistical tests, must still be interpreted before you can make a call about your data sample.
In this section, we will look at two common methods for visually inspecting a dataset to check if it was drawn from a Gaussian distribution.
Histogram Plot
A simple and commonly used plot to quickly check the distribution of a sample of data is the histogram.
In the histogram, the data is divided into a pre-specified number of groups called bins. The data is then sorted into each bin and the count of the number of observations in each bin is retained.
The plot shows the bins across the x-axis maintaining their ordinal relationship, and the count in each bin on the y-axis.
A sample of data has a Gaussian distribution of the histogram plot, showing the familiar bell shape.
A histogram can be created using the hist() matplotlib function. By default, the number of bins is automatically estimated from the data sample.
A complete example demonstrating the histogram plot on the test problem is listed below.
|
1 2 3 4 5 6 7 8 9 10 11 |
# histogram plot from numpy.random import seed from numpy.random import randn from matplotlib import pyplot # seed the random number generator seed(1) # generate univariate observations data = 5 * randn(100) + 50 # histogram plot pyplot.hist(data) pyplot.show() |
Running the example creates a histogram plot showing the number of observations in each bin.
We can see a Gaussian-like shape to the data, that although is not strongly the familiar bell-shape, is a rough approximation.
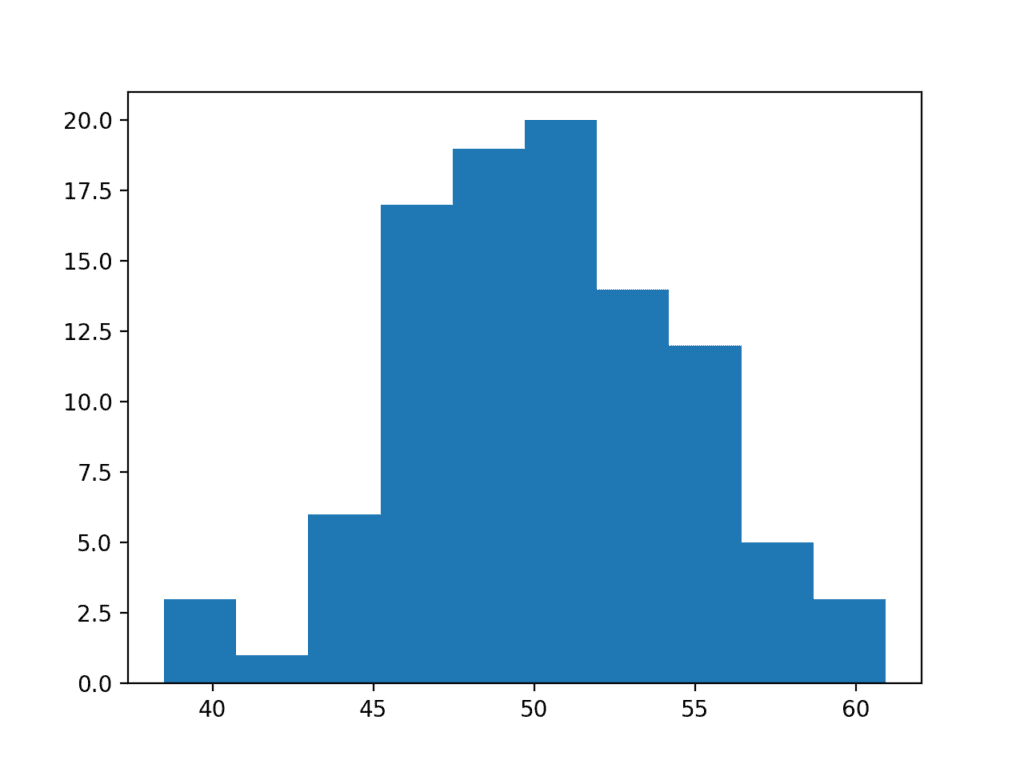
Histogram Plot Normality Check
Quantile-Quantile Plot
Another popular plot for checking the distribution of a data sample is the quantile-quantile plot, Q-Q plot, or QQ plot for short.
This plot generates its own sample of the idealized distribution that we are comparing with, in this case the Gaussian distribution. The idealized samples are divided into groups (e.g. 5), called quantiles. Each data point in the sample is paired with a similar member from the idealized distribution at the same cumulative distribution.
The resulting points are plotted as a scatter plot with the idealized value on the x-axis and the data sample on the y-axis.
A perfect match for the distribution will be shown by a line of dots on a 45-degree angle from the bottom left of the plot to the top right. Often a line is drawn on the plot to help make this expectation clear. Deviations by the dots from the line shows a deviation from the expected distribution.
We can develop a QQ plot in Python using the qqplot() statsmodels function. The function takes the data sample and by default assumes we are comparing it to a Gaussian distribution. We can draw the standardized line by setting the ‘line‘ argument to ‘s‘.
A complete example of plotting the test dataset as a QQ plot is provided below.
|
1 2 3 4 5 6 7 8 9 10 11 12 |
# QQ Plot from numpy.random import seed from numpy.random import randn from statsmodels.graphics.gofplots import qqplot from matplotlib import pyplot # seed the random number generator seed(1) # generate univariate observations data = 5 * randn(100) + 50 # q-q plot qqplot(data, line='s') pyplot.show() |
Running the example creates the QQ plot showing the scatter plot of points in a diagonal line, closely fitting the expected diagonal pattern for a sample from a Gaussian distribution.
There are a few small deviations, especially at the bottom of the plot, which is to be expected given the small data sample.
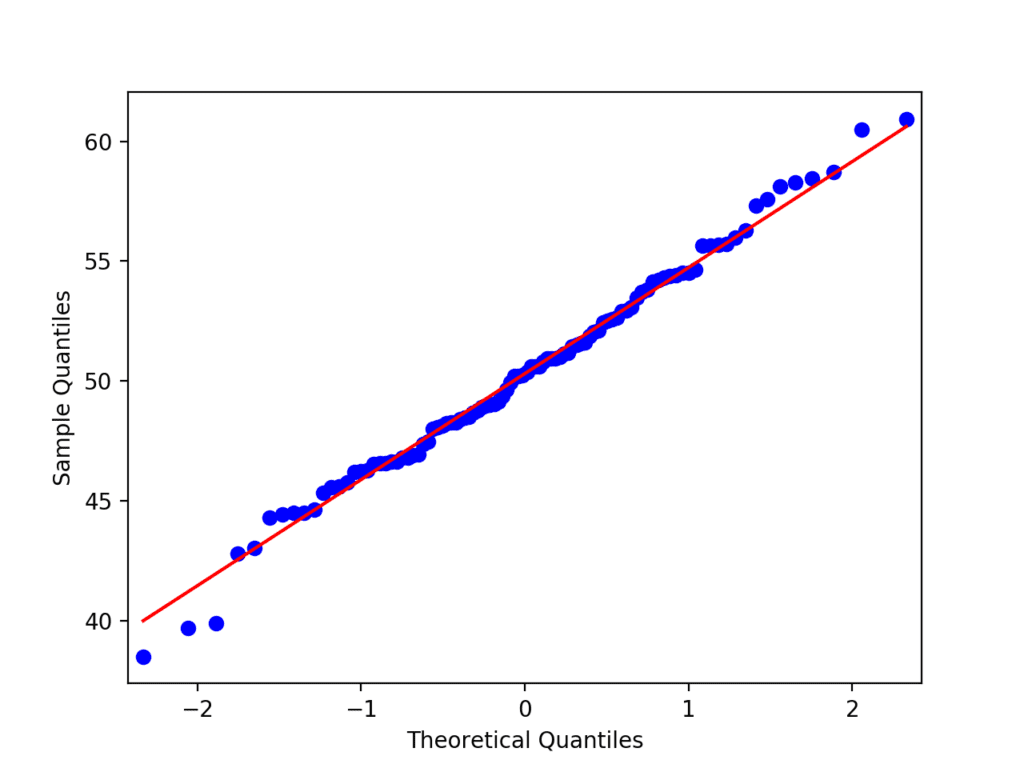
QQ Plot Normality Check
Statistical Normality Tests
There are many statistical tests that we can use to quantify whether a sample of data looks as though it was drawn from a Gaussian distribution.
Each test makes different assumptions and considers different aspects of the data.
We will look at 3 commonly used tests in this section that you can apply to your own data samples.
Interpretation of a Test
Before you can apply the statistical tests, you must know how to interpret the results.
Each test will return at least two things:
- Statistic: A quantity calculated by the test that can be interpreted in the context of the test via comparing it to critical values from the distribution of the test statistic.
- p-value: Used to interpret the test, in this case whether the sample was drawn from a Gaussian distribution.
Each test calculates a test-specific statistic. This statistic can aid in the interpretation of the result, although it may require a deeper proficiency with statistics and a deeper knowledge of the specific statistical test. Instead, the p-value can be used to quickly and accurately interpret the statistic in practical applications.
The tests assume that that the sample was drawn from a Gaussian distribution. Technically this is called the null hypothesis, or H0. A threshold level is chosen called alpha, typically 5% (or 0.05), that is used to interpret the p-value.
In the SciPy implementation of these tests, you can interpret the p value as follows.
- p <= alpha: reject H0, not normal.
- p > alpha: fail to reject H0, normal.
This means that, in general, we are seeking results with a larger p-value to confirm that our sample was likely drawn from a Gaussian distribution.
A result above 5% does not mean that the null hypothesis is true. It means that it is very likely true given available evidence. The p-value is not the probability of the data fitting a Gaussian distribution; it can be thought of as a value that helps us interpret the statistical test.
Shapiro-Wilk Test
The Shapiro-Wilk test evaluates a data sample and quantifies how likely it is that the data was drawn from a Gaussian distribution, named for Samuel Shapiro and Martin Wilk.
In practice, the Shapiro-Wilk test is believed to be a reliable test of normality, although there is some suggestion that the test may be suitable for smaller samples of data, e.g. thousands of observations or fewer.
The shapiro() SciPy function will calculate the Shapiro-Wilk on a given dataset. The function returns both the W-statistic calculated by the test and the p-value.
The complete example of performing the Shapiro-Wilk test on the dataset is listed below.
|
1 2 3 4 5 6 7 8 9 10 11 12 13 14 15 16 17 |
# Shapiro-Wilk Test from numpy.random import seed from numpy.random import randn from scipy.stats import shapiro # seed the random number generator seed(1) # generate univariate observations data = 5 * randn(100) + 50 # normality test stat, p = shapiro(data) print('Statistics=%.3f, p=%.3f' % (stat, p)) # interpret alpha = 0.05 if p > alpha: print('Sample looks Gaussian (fail to reject H0)') else: print('Sample does not look Gaussian (reject H0)') |
Running the example first calculates the test on the data sample, then prints the statistic and calculated p-value.
The p-value is interested and finds that the data is likely drawn from a Gaussian distribution.
|
1 2 |
Statistics=0.992, p=0.822 Sample looks Gaussian (fail to reject H0) |
D’Agostino’s K^2 Test
The D’Agostino’s K^2 test calculates summary statistics from the data, namely kurtosis and skewness, to determine if the data distribution departs from the normal distribution, named for Ralph D’Agostino.
- Skew is a quantification of how much a distribution is pushed left or right, a measure of asymmetry in the distribution.
- Kurtosis quantifies how much of the distribution is in the tail. It is a simple and commonly used statistical test for normality.
The D’Agostino’s K^2 test is available via the normaltest() SciPy function and returns the test statistic and the p-value.
The complete example of the D’Agostino’s K^2 test on the dataset is listed below.
|
1 2 3 4 5 6 7 8 9 10 11 12 13 14 15 16 17 |
# D'Agostino and Pearson's Test from numpy.random import seed from numpy.random import randn from scipy.stats import normaltest # seed the random number generator seed(1) # generate univariate observations data = 5 * randn(100) + 50 # normality test stat, p = normaltest(data) print('Statistics=%.3f, p=%.3f' % (stat, p)) # interpret alpha = 0.05 if p > alpha: print('Sample looks Gaussian (fail to reject H0)') else: print('Sample does not look Gaussian (reject H0)') |
Running the example calculates the statistic and prints the statistic and p-value.
The p-value is interpreted against an alpha of 5% and finds that the test dataset does not significantly deviate from normal.
|
1 2 |
Statistics=0.102, p=0.950 Sample looks Gaussian (fail to reject H0) |
Anderson-Darling Test
Anderson-Darling Test is a statistical test that can be used to evaluate whether a data sample comes from one of among many known data samples, named for Theodore Anderson and Donald Darling.
It can be used to check whether a data sample is normal. The test is a modified version of a more sophisticated nonparametric goodness-of-fit statistical test called the Kolmogorov-Smirnov test.
A feature of the Anderson-Darling test is that it returns a list of critical values rather than a single p-value. This can provide the basis for a more thorough interpretation of the result.
The anderson() SciPy function implements the Anderson-Darling test. It takes as parameters the data sample and the name of the distribution to test it against. By default, the test will check against the Gaussian distribution (dist=’norm’).
The complete example of calculating the Anderson-Darling test on the sample problem is listed below.
|
1 2 3 4 5 6 7 8 9 10 11 12 13 14 15 16 17 18 |
# Anderson-Darling Test from numpy.random import seed from numpy.random import randn from scipy.stats import anderson # seed the random number generator seed(1) # generate univariate observations data = 5 * randn(100) + 50 # normality test result = anderson(data) print('Statistic: %.3f' % result.statistic) p = 0 for i in range(len(result.critical_values)): sl, cv = result.significance_level[i], result.critical_values[i] if result.statistic < result.critical_values[i]: print('%.3f: %.3f, data looks normal (fail to reject H0)' % (sl, cv)) else: print('%.3f: %.3f, data does not look normal (reject H0)' % (sl, cv)) |
Running the example calculates the statistic on the test data set and prints the critical values.
Critical values in a statistical test are a range of pre-defined significance boundaries at which the H0 can be failed to be rejected if the calculated statistic is less than the critical value. Rather than just a single p-value, the test returns a critical value for a range of different commonly used significance levels.
We can interpret the results by failing to reject the null hypothesis that the data is normal if the calculated test statistic is less than the critical value at a chosen significance level.
We can see that at each significance level, the test has found that the data follows a normal distribution
|
1 2 3 4 5 6 |
Statistic: 0.220 15.000: 0.555, data looks normal (fail to reject H0) 10.000: 0.632, data looks normal (fail to reject H0) 5.000: 0.759, data looks normal (fail to reject H0) 2.500: 0.885, data looks normal (fail to reject H0) 1.000: 1.053, data looks normal (fail to reject H0) |
What Test Should You Use?
We have covered a few normality tests, but this is not all of the tests that exist.
So which test do you use?
I recommend using them all on your data, where appropriate.
The question then becomes, how do you interpret the results? What if the tests disagree, which they often will?
I have two suggestions for you to help think about this question.
Hard Fail
Your data may not be normal for lots of different reasons. Each test looks at the question of whether a sample was drawn from a Gaussian distribution from a slightly different perspective.
A failure of one normality test means that your data is not normal. As simple as that.
You can either investigate why your data is not normal and perhaps use data preparation techniques to make the data more normal.
Or you can start looking into the use of nonparametric statistical methods instead of the parametric methods.
Soft Fail
If some of the methods suggest that the sample is Gaussian and some not, then perhaps take this as an indication that your data is Gaussian-like.
In many situations, you can treat your data as though it is Gaussian and proceed with your chosen parametric statistical methods.
Extensions
This section lists some ideas for extending the tutorial that you may wish to explore.
- List two additional examples of when you think a normality test might be useful in a machine learning project.
- Develop your own contrived dataset and apply each normality test.
- Load a standard machine learning dataset and apply normality tests to each real-valued variable.
If you explore any of these extensions, I’d love to know.
Further Reading
This section provides more resources on the topic if you are looking to go deeper.
API
- numpy.random.seed() API
- numpy.random.randn() API
- scipy.stats.normaltest() API
- scipy.stats.shapiro() API
- scipy.stats.anderson() API
- statsmodels.graphics.gofplots.qqplot() API
- matplotlib.pyplot.hist() API
Articles
- Normality test on Wikipedia
- Histogram on Wikipedia
- Q–Q plot on Wikipedia
- D’Agostino’s K-squared test on Wikipedia
- Anderson–Darling test on Wikipedia
- Shapiro–Wilk test on Wikipedia
Summary
In this tutorial, you discovered the importance of checking whether a data sample deviates from the normal distribution and a suite of techniques that you can use to evaluate your data sample.
Specifically, you learned:
- How whether a sample is normal dictates the types of statistical methods to use with a data sample.
- Graphical methods for qualifying deviations from normal such as histograms and the Q-Q plot.
- Statistical normality tests for quantifying deviations from normal.
Do you have any questions?
Ask your questions in the comments below and I will do my best to answer.
Get a Handle on Statistics for Machine Learning!

Develop a working understanding of statistics
...by writing lines of code in python
Discover how in my new Ebook:
Statistical Methods for Machine Learning
It provides self-study tutorials on topics like:
Hypothesis Tests, Correlation, Nonparametric Stats, Resampling, and much more...
Discover how to Transform Data into Knowledge
Skip the Academics. Just Results.
")


Hi Jason,
Thanks for this nice post. In the Anderson-Darling Test paragraph, should the last sentence be:
‘We can see that at each significance level, the test has found that the data follows a normal distribution’
instead of:
‘We can see that at each significance level, the test has found significant departure from normal.’
Best,
Elie
Great catch, thanks! Fixed.
Failed to reject a hypothesis doesn’t mean you accept it. 😀
What does it mean?
You can’t say anything about that hypothesis.
H0: Data is normal
H1: Data is not normal
p alpha: fail to reject H0 (not enough evidence to say data is normal)
Read this
https://stackoverflow.com/questions/7781798/seeing-if-data-is-normally-distributed-in-r/7788452#7788452
Hi,
Brilliantly put together. Thank you for the post. Now that we know if the data is normally distributed or not, how do we transform data that is not normally distributed into normally distributed? Is boxcox the only way or do you prefer any other method?
Thanks.
Awesome question! I have a post on this exact question scheduled. Stand by for a few days.
Sweet!, thank you.
you can log transformation also and some other techniques also there
Thanks once again for nice post.
I’m glad it helped.
Excellent article. I liked the section where you highlighted the use of parametric of non-parametric model for fitting a ML model depending upon whether the data at hand is close to normal or not. I think most of the books do not really state this explicitly.
Thanks, I’m glad it helped.
Jason, this is a great article thanks! so in the case that the data set has multiple real valued features we should be doing this test for each and then if one or more of these features turn out to be non-Gaussian does it mean that whole data set is non-Gaussian? Or should we try to address the non-Gaussian features via the data preparation step?
Also, do you have a similar post about the inductive biases of various machine learning algorithms?
We would address it one variable at a time.
Inductive bias is is more of an abstraction to understand how algorithm design decisions impact the search/choice of mapping hypotheses, it’s not really a measurable quantity.
Shouldn’t the Null Hypothesis (H0) be assuming our data to be normal?
Correct, H0 is that the data is normal.
Great Article ..
I have tried further extension “Load a standard machine learning dataset and apply normality tests to real-valued variable.”
Link : https://github.com/Mamtasadani/Normality-Test-v
Please give your valuable suggestions..
Well done, but your link is broken.
Sorry for above link
Please check this link:
https://github.com/Mamtasadani/Normality-Test-
Thanks
Well done!
Hi Jason,
I’m currently working on project for time series predictions. Basically I use RNN (LSTM) machine learning models for making predictions. Does the normality (or not) of time series I work with affect the way I should construct my models or LSTM can work well even with data that is not normal? Simply, should I always make my time series normal where work with LSTM?
Krzysztof
It may, it really depends on the problem. I’d recommend evaluating multiple different preparations of your input data.
Hi
How would you analyze highly right skewed data like salary data where few people earn a lot and rest is somewhere in the middle / lower range?
Thanks
Sounds like a power/exponential distribution, not Gaussian.
Possibly the only logical and best explained tutorial that I could find after hours of searching. Bookmarked this and will be referring to this over and over again. Can’t thank you enough for your efforts, Dr. Brownlee!
Thanks, I’m happy to hear that.
I did the Shapiro-Wilk test for alpha = 0.05 and I got a p value = 0.04, the null hypothesis is rejected. The D’Agostino K-square test gave a value of p = 0.191, the null hypothesis is not rejected, and the Anderson-Darling test for four critical values the null hypothesis is rejected and for one critical value the null hypothesis is not rejected . What do you recommend me to do next?
and
only confirming, if my data reject the null hypothesis (not normal), should not I use any model (MAchine Learning) that is based on Gaussian distributions, such as Gaussian processes or exponential smoothing?
and if I want to use them, should I process the data ??
Thank you
Each test gives a different perspective on the normality of your data, you must interest the result in the context of your project/goals.
See the section: “What Test Should You Use?”
I’m incredibly greatful for this introduction, I’ve implemented them all to test my data. I’m in doubt about the interpretation of significance levels in the Anderson-Darling Test. Coloquialy speaking: what would it mean that H0 is rejected for 2.5% but not for 5%? What are the percentages? Say, at which level would you be confident that the input data is Gaussian? 5%? 10%?
Maybe it might be useful to have a “not so Gaussian” example, so that it passes say 2 out of 5 significance levels
Thanks, I’m happy it helps!
The probabilities represent how likely the event is real vs a statistical fluke in the data. We can never know for sure, but we can use a statistical test to talk about the likelihood.
Typically you pick the strongest level available, e.g. 5%. Beyond 5% (1 in 20) we often give up and say it’s probably not real.
OK then!
So, to clarify, if the statistic value is lesser than the 15% critical value (don’t reject H0), I’m confident that the distribution is Gaussian. If not (statistic value greater than the critical value), check at 10%. If not, check at 5%. If I can’t pass at 5%, don’t even bother for 2.5% or 1%, right?
This is my approach with visual + statistical tests, I’d really appreciate your opinion
https://gist.github.com/marnunez/6c68248fee14236dab42ef3e46b94116
And thanks for everything!
Typically just the 0.05 is used, e.g. the 5% level.
More here:
https://machinelearningmastery.com/faq/single-faq/how-do-i-interpret-a-p-value
Excellent article!
Do you have some pointers for how to test if the components of a Multimodal distributed data are Normal or not?
Ouch, why?
Well, if forced, you could re-define the distribution and cut out an element you think is bell shaped and test that. Sounds dangerously invalid to me.
I expect there are far better approaches if you spoke to a real statistician! Perhaps post on the math stackoverflow re best practices in this situation.
Hello Jason,
Amazing tutorial.
I was wondering if there is any function in python that assesses multivariate normality.
In R, there is the MVN package that does that (https://cran.r-project.org/web/packages/MVN/vignettes/MVN.pdf).
Best,
Makis
Thanks.
Good question, there might be. I’m not sure off the cuff.
Let me know if you find something.
I understand the importance of testing residuals in a regression model. But the other 2 usages you mention are unclear to me (Input data to the model in the case of fitting models.
Model evaluation results in the case of model selection). Can you point to a resource for further explanation?
Hmm, for comparing algorithms, you could start here:
https://machinelearningmastery.com/statistical-significance-tests-for-comparing-machine-learning-algorithms/
Hi Jason,
Is this post available yet? Could you perhaps link to it?
Thanks!
What post exactly Emily?
In which cases it will be helpful to know about distribution of our data? Please share some examples!
Almost every time – to aid in data preparation and model selection.
Hi Jason,
All of your articles are very informative and helpful.
I just wanted to know does KS test is sensitive to data normalisation? Because I’m getting a totally different results when my data is normalised and non-normalized.
Does it expects the mean and std dev of my dataset should be 0 , 1.
However, other tests like AD and D’agastino doesn’t get affected.
Thanks.
I guess it is – from your results. I recommend checking the documentation.
Hi,
Thank you for the good explanation of how to perform normality test on own data.
How can I transform a non-normally data in normally data?
Thanks again!
It depends on how non-normal it is.
E.g. perhaps remove outliers, or fix simple issues with a power transform like a boxcox.
Hi Jason,
Thanks for the article. I was wondering if I want to apply these tests on streaming data, what would be the proper window size (window size = number of samples)? can I apply these tests on streaming data with a sliding window?
Good question, I don’t know off hand. I expect there might be specific methodologies for handing streaming data.
If not, then a representative sample collected over a large interval might be a good start.
helpful, thank you!
Thanks.
Hi Jason,
Great tutorial. I am using Shapiro-Wilk Test to check if my data is normally distributed. I have two sample of distributions, when i test them individually the test says they have a Gaussian distribution. But after combining both into a single larger sample the test says otherwise.
Should i be looking for the normality of the combined data?
I am trying to compare the two sample distributions to check if they are significantly different.
If they are separate samples then it perhaps does not make sense to combine them.
Hi Jason,
Any pointers regarding correctional measures if data is not normally distributed. Asking particularly for to residual plots.
Yes, see this post:
https://machinelearningmastery.com/how-to-transform-data-to-fit-the-normal-distribution/
Hi jason,
How do we test normality of data for multi-dimensional features? Suppose I have 20 features, how should I know whether I run (plain) linear regression or whether I should take interaction terms or transform some features in squares etc??? How do we get to know about it.
As a start, perhaps per-feature?
Just thank you for your tutorials like this one! Very clear as always
I’m happy that it helped.
It’s a wonderful article. Helped a lot to understand those concepts.
Hope to get some more good articles from u.
Thank you
Thanks, I’m glad it helped.
Thanks for the excellent tutorial. I have a follow-up question that I hope you can help me with.
I have several datasets where I need to calculate the sample statistics like mean, variance, etc. After applying the tests you suggested, I found that many of the datasets aren’t normally distributed, and I wanted to know if you have any recommendations for the steps I should follow. The majority of the remaining appear to have an exponential distribution. Thanks.
It depends on what you want to do with the data as to the action you might want to take.
E.g. modeling with a linear algorithm requires the inputs are gaussian. Modeling with something else does not have this requirement.
Hi,
Thanks for such an informative post. Is there any way to check the normality of entire dataset. Suppose I have 50 columns in my dataset, and I want to check if my data deviates from a Gaussian distribution, Can I do it ?
Thanks in advance
Column by column.
Stay away from multivariate gaussians if you can, it gets very complex (for me).
What to do if the number of observation is very large nearly 40,000 observations?
Is normality test still hold ?
Wonderful question.
Probably, but almost all statistical tests were designed for small data. I think the validity on big data is a great open problem – e.g. the increased likelihood of rare events/outliers.
so in that case, should we break the data in small chunks and test the “gaussianity” of those chunks, and those chunks which do not conform to the tests, should be reviewed and if required, deleted from the dataset on which we are working on ?
I would not advocate that approach, the results would have too much variance.
Hi Json
Thanks for this post. Its really informative. Could you please tell as to why you have not included Dickey Fuller test? I mean from other posts which I have read, Dickey Fuller test is most widely talked about. So, is there specific reason that you chose these three tests over Dickey Fuller to mention about?
sorry for the name misspelt. Jason, hope you didn’t mind I guess i misspelt it as in today’s world, JSON is the most common thing we come across 🙂
No problem.
It is covered here as a test of stationarity:
https://machinelearningmastery.com/time-series-data-stationary-python/
This was very helpful. Now I have a dataset. This is not normal. The histogram of my data set looks this..
.
….
……..
…………
…………………..
……………………….
Now how can I design a model (that will regenerate this data) .
Perhaps select a probability distribution that fits the data or model with with density estimation, then use the model to probabilistically generate new instances.
Thanks, great article. How can I use those tools with and input of a Pandas Dataframe?
Extract the numpy array from the dataframe (.values) and away you go!
Thank you for your answer Jason I tried, for example, with this one
results = pd.DataFrame.from_records(all_stats, columns=[‘Sales’,
‘Commission_Amount’,
‘Sales_Target’])
stat, p = shapiro(results.values)
print(‘Statistics=%.3f, p=%.3f’ % (stat, p))
# interpret
alpha = 0.05
if p > alpha:
print(‘Sample looks Gaussian (fail to reject H0)’)
else:
print(‘Sample does not look Gaussian (reject H0)’)
But the p is always 0.000 . I hope you can help me, really appreciate it. Thank you!
Perhaps double check that you have loaded the data correctly?
I really appreciate your help, thank you. The output of my data seems correct:
[[82024750. 2809815. 82350000.]
[86901250. 2970088. 87000000.]
[81341500. 2776092. 81375000.]
…
[85586000. 2933965. 85875000.]
[82237250. 2742930. 83025000.]
[82130000. 2748805. 82875000.]]
And I always get a result like that:
” Statistics=0.642, p=0.000 ”
Should I change something?
Thank you!
The result suggests the data is not gaussian.
Regarding use of the QQ plot to check for normal distribution, can we simply plot the datapoints or should we take means of random samples to plot against the theoretical? Per the CLT, isn’t it saying that sample means would eventually take the form of a guassian distribution? And for the shapiro test, I get a warning for when sample is over 5000. Is there a better test for high sample?
You plot the data points directly.
Nice article! I am studying the shapiro-wilk test, but i can’t understant.
What statistics, p and alpha stands for exactly?
thank you for the answer man!
Perhaps this will help:
https://machinelearningmastery.com/faq/single-faq/how-do-i-interpret-a-p-value
Hi,
I’m testing if my two samples have different means or not. For that, I’m first testing the normality of two samples. Let’s say they are not normal and after transformation they have become normal. Now if I perform a two-sample t-test on the transformed data, does the conclusion about the same/different means applicable to the original data?
Also, what is an alternative approach to a two-sample t-test if the data is not normal?
You can use the Mann-Whitney U Test:
https://machinelearningmastery.com/nonparametric-statistical-significance-tests-in-python/
Great question!
No, it applies to the transformed data.
You might want to use a rank test instead:
https://machinelearningmastery.com/nonparametric-statistical-significance-tests-in-python/
Thanks for your answer.
I did Mann-Whitney U Test and see the p-value as 0.289 and thereby concluding that the means are not statistically different(as my alpha can be no greater than 0.15)
For the second comment –
I just wanted to get confirmation of what you are saying.
Do you say – “No, it applies to only the transformed data and not on the original data (to draw conclusions)
I appreciate your response
Well done!
Yes, correct.
Excellent Tutorial Sir….when I am working imbalanced classification problem where the majority of instance belongs to one class, several balanced datasets are formed using random undersampling method and other techniques. Can we use any method to evaluate the significance of the sample generated from each method? whether we need to check the sample follows Gaussian distribution or not?
Thanks!
No, I don’t think such analysis is required or meaningful.
whether we need to check the new sample generated using our proposed method follows the distribution of the original dataset
I assume they are multivariate examples. Perhaps look into density based methods, e.g. one class classification to see if new examples fit or don’t fit.
Hi Jason, Nice article. Thanks for sharing the knowledge. Is the alpha-value to all the above tests is 0.05? How can we change the alpha value to desired value. I have seen the documentation, I couldn’t find any answer. Can you please help me on this?
You can specify the alpha value directly, use any value you wish such as 0.01 0.05 or even 0.1.
Hi Jason, Can you please let us know how can we perform the Cramér–von Mises test for normality in python?
Sorry, I am not familiar with that test off the cuff. What is it all about?
I found this on google:
https://pypi.org/project/scikit-gof/
Thanks for the information.
You’re welcome.
This was brilliant, so easy to understand and systematic! This one post has taught me more about normality testing than three years of university! Just excellent thank you!
Thanks, happy it helped!
What are the graphical & statistical normality tests used for categorical variables?
I have a dataset that has only categorical variables. There’s an age column which represents 3 categories. The other attributes have only true, false values. The target attribute has 22 categories.
Thanks
San
Chi squared is a good place to start:
https://machinelearningmastery.com/chi-squared-test-for-machine-learning/
Also see this:
https://machinelearningmastery.com/feature-selection-with-categorical-data/
Hi Jason, you are great. I have a question. What is the mean of W-Statistic in the Shapiro-Wilk test? How can we interpret this?
Good question, this will help:
https://en.wikipedia.org/wiki/Shapiro%E2%80%93Wilk_test
Hi Jason , Great article. Quick question on the critical values in the Anderson-Darling test. Are the critical values equivalent to the confidence levels for examples say 15 = 85% confidence , 5 = 95% confidence and so on.
More on what critical values are here:
https://machinelearningmastery.com/critical-values-for-statistical-hypothesis-testing/
Thank you very much for this article. I was ready to spend ten times as long as I did researching about normality tests. I will still have to see more things by myself to understand better, but this was incredibly useful.
What a time to be alive where you can Google the answer to so many questions.
Thanks, I’m happy to hear that.
A minor comment. Q-Q plots are not diagonal, but simply linear. Even the plot shown for QQ plot as an example here is not diagonal.
Thanks.
I am a beginner in statistics and machine learning. You have given a very good explanation about normality tests! I just have one question. In machine learning algorithms, where we use features to perform a classification task, how do these normality tests matter? I mean even if the features are not normally distributed, they can still contribute to the classification process and perhaps may be important as well?
Thanks!
They may only matter if you are using algorithms that assume or require input or output variables to have a Gaussian distribution.
Super helpful Jason ! Straightforward and ready to use.
You’re welcome.
Thanks for this helpful post!
Just a small suggestion:
Do you think if, in the Anderson’s example, using the “cv” variable into the comparison “if result.statistic < cv" instead of "if result.statistic < result.critical_values[i]:"
Thanks.
Hai Jason,
Excellent work, I appreciate it.
Why did you mention a variable “p = 0” in Anderson Darling test?
Did I?
In case anyone else runs into this issue (getting a p value of exactly 0.000 seems odd), adjust your print statement to be able to include more decimal points. (ie. a quick and easy way to do this is something like changing to ‘ print(‘Statistics=%.3f, p=%.10f’ % (stat, p)) ‘. )
Great tip!
learnt alot from this
thanks jason
your blog is gem
Thanks. Glad you like it.
I am a PhD student from Yemen, and I am a follower of your posts, I really do not know how I should thank you. Thank you so much for your time and efforts and sharing your knowledge.
Outstanding feedback and support Hamzah!
There are a few ways that you can give back and support me and this website.
1. Spread the Word
Word of mouth is still a really big deal.
Share a note on social media about Machine Learning Mastery.
For example:
I am loving the machine learning tutorials on https://machinelearningmastery.com
2. Purchase an Ebook
My best advice on applied machine learning and deep learning is captured in my Ebooks.
They are designed to help you learn and get the results the fastest way I know how.
All Ebook sales directly fund and support my continued work on this website and creating new tutorials.
Discover the Ebook Catalog
3. Make a Donation or Become a Patron
If you want to support this site financially but cannot afford an Ebook, then consider making a one time donation.
Think of it like buying me a coffee or adding a few dollars to the tip jar. Every little bit helps.
You may also want to become a patron and donate a small amount each month.
Discover How to Donate or Become a Patron
Thank You!
This site would not exist without the support of generous readers like you!