An imbalanced classification problem is a problem that involves predicting a class label where the distribution of class labels in the training dataset is not equal.
A challenge for beginners working with imbalanced classification problems is what a specific skewed class distribution means. For example, what is the difference and implication for a 1:10 vs. a 1:100 class ratio?
Differences in the class distribution for an imbalanced classification problem will influence the choice of data preparation and modeling algorithms. Therefore it is critical that practitioners develop an intuition for the implications for different class distributions.
In this tutorial, you will discover how to develop a practical intuition for imbalanced and highly skewed class distributions.
After completing this tutorial, you will know:
How to create a synthetic dataset for binary classification and plot the examples by class.
How to create synthetic classification datasets with any given class distribution.
How different skewed class distributions actually look in practice.
Kick-start your project with my new book Imbalanced Classification with Python, including step-by-step tutorials and the Python source code files for all examples.
Let’s get started.
Update Jan/2020: Updated for changes in scikit-learn v0.22 API.
Develop an Intuition for Severely Skewed Class Distributions Photo by Boris Kasimov, some rights reserved.
Tutorial Overview
This tutorial is divided into three parts; they are:
The make_blobs() function can be used to generate a specified number examples from a test classification problem with a specified number of classes. The function returns the input and output parts of each example ready for modeling.
For example, the snippet below will generate 1,000 examples for a two-class (binary) classification problem with two input variables. The class values have the values of 0 and 1.
Once generated, we can then plot the dataset to get an intuition for the spatial relationship between the examples.
Because there are only two input variables, we can create a scatter plot to plot each example as a point. This can be achieved with the scatter() matplotlib function.
The color of the points can then be varied based on the class values. This can be achieved by first selecting the array indexes for the examples for a given class, then only plotting those points, then repeating the select-and-plot process for the other class. The where() NumPy function can be used to retrieve the array indexes that match a criterion, such as a class label having a given value.
For example:
1
2
3
4
5
6
7
...
# create scatter plot for samples from each class
forclass_value inrange(2):
# get row indexes for samples with this class
row_ix=where(y==class_value)
# create scatter of these samples
pyplot.scatter(X[row_ix,0],X[row_ix,1])
Tying this together, the complete example of creating a binary classification test dataset and plotting the examples as a scatter plot is listed below.
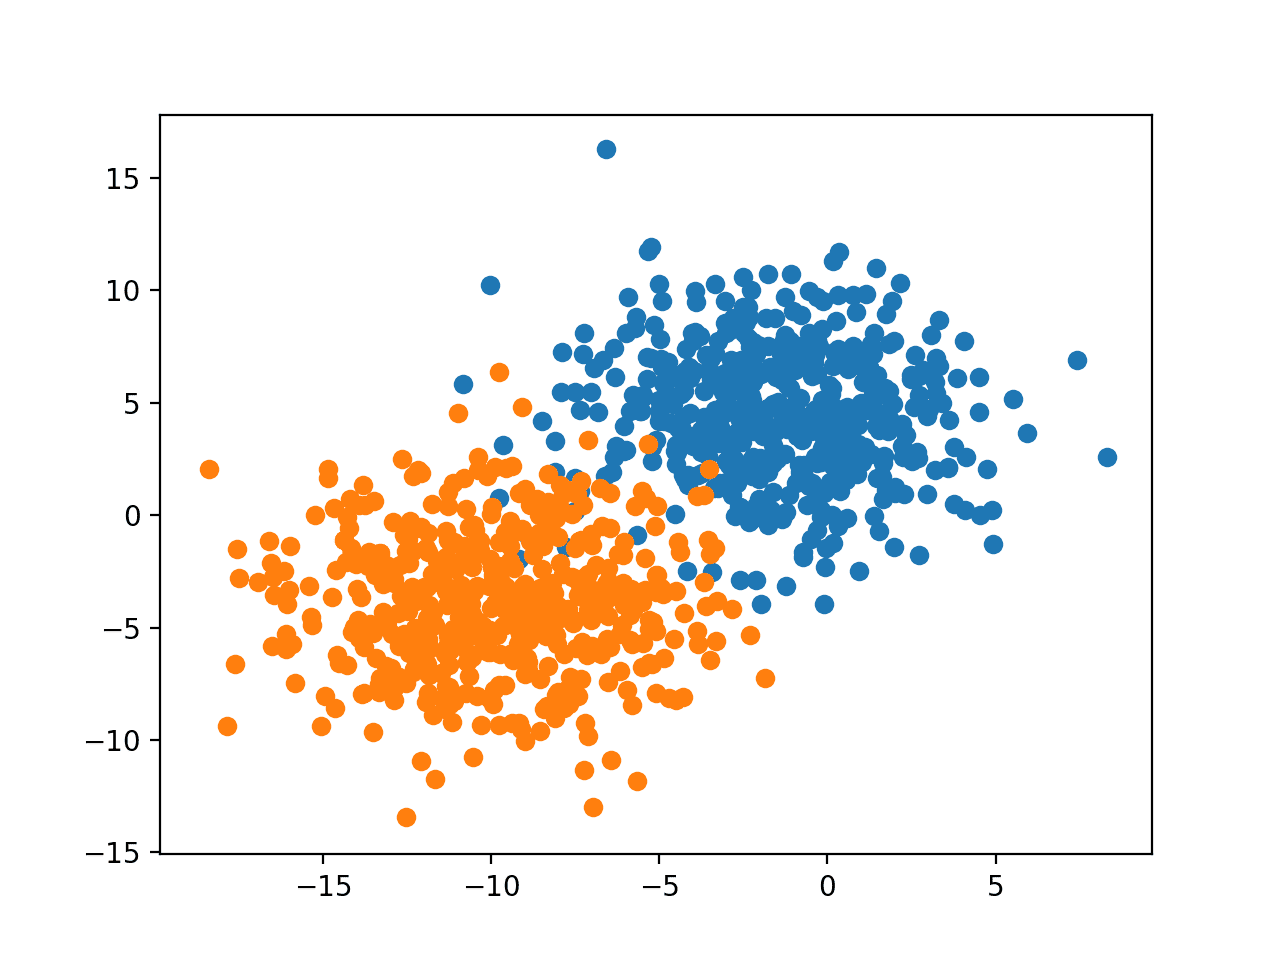
Running the example creates the dataset and scatter plot, showing the examples for each of the two classes with different colors.
We can see that there is an equal number of examples in each class, in this case, 500, and that we can imagine drawing a line to reasonably separate the classes, much like a classification predictive model might in learning how to discriminate the examples.
Scatter Plot of Binary Classification Dataset
Now that we know how to create a synthetic binary classification dataset and plot the examples, let’s look at the example of class imbalances on the example.
Want to Get Started With Imbalance Classification?
Take my free 7-day email crash course now (with sample code).
Click to sign-up and also get a free PDF Ebook version of the course.
Create Synthetic Dataset with Class Distribution
The make_blobs() function will always create synthetic datasets with an equal class distribution.
Nevertheless, we can use this function to create synthetic classification datasets with arbitrary class distributions with a few extra lines of code.
A class distribution can be defined as a dictionary where the key is the class value (e.g. 0 or 1) and the value is the number of randomly generated examples to include in the dataset.
For example, an equal class distribution with 5,000 examples in each class would be defined as:
1
2
3
...
# define the class distribution
proportions={0:5000,1:5000}
We can then enumerate through the different distributions and find the largest distribution, then use the make_blobs() function to create a dataset with that many examples for each of the classes.
1
2
3
4
5
6
...
# determine the number of classes
n_classes=len(proportions)
# determine the number of examples to generate for each class
largest=max([vfork,vinproportions.items()])
n_samples=largest *n_classes
This is a good starting point, but will give us more samples than are required for each class label.
We can then enumerate through the class labels and select the desired number of examples for each class to comprise the dataset that will be returned.
1
2
3
4
5
6
7
8
...
# collect the examples
X_list,y_list=list(),list()
fork,vinproportions.items():
row_ix=where(y==k)[0]
selected=row_ix[:v]
X_list.append(X[selected,:])
y_list.append(y[selected])
We can tie this together into a new function named get_dataset() that will take a class distribution and return a synthetic dataset with that class distribution.
1
2
3
4
5
6
7
8
9
10
11
12
13
14
15
16
17
# create a dataset with a given class distribution
def get_dataset(proportions):
# determine the number of classes
n_classes=len(proportions)
# determine the number of examples to generate for each class
The function can take any number of classes, although we will use it for simple binary classification problems.
Next, we can take the code from the previous section for creating a scatter plot for a created dataset and place it in a helper function. Below is the plot_dataset() function that will plot the dataset and show a legend to indicate the mapping of colors to class labels.
1
2
3
4
5
6
7
8
9
10
11
12
13
# scatter plot of dataset, different color for each class
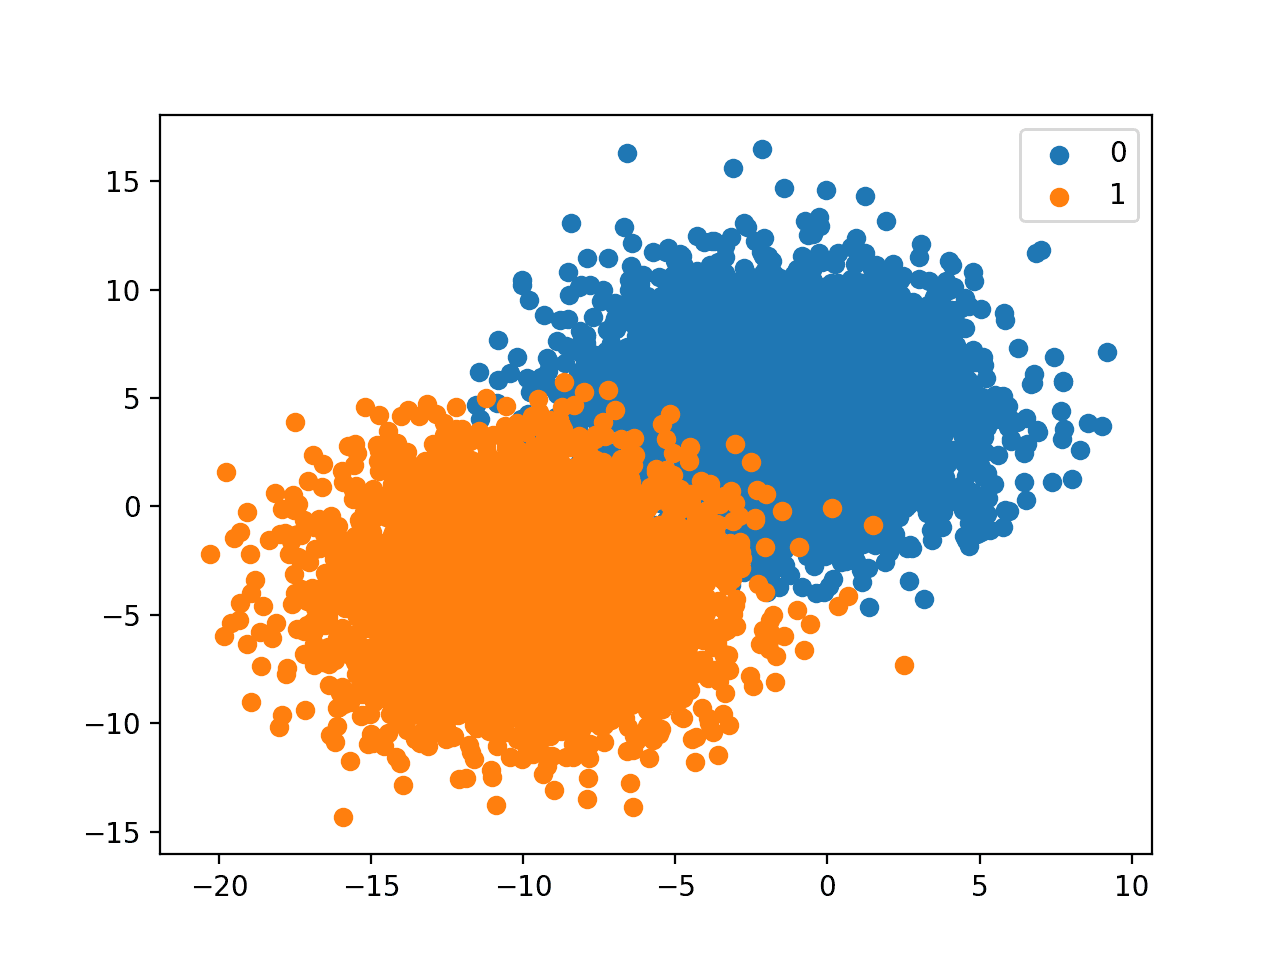
Running the example creates the dataset and plots the result as before, although this time with our provided class distribution.
In this case, we have many more examples for each class and a helpful legend to indicate the mapping of plot colors to class labels.
Scatter Plot of Binary Classification Dataset With Provided Class Distribution
Now that we have the tools to create and plot a synthetic dataset with arbitrary skewed class distributions, let’s look at the effect of different distributions.
Effect of Skewed Class Distributions
It is important to develop an intuition for the spatial relationship for different class imbalances.
For example, what is the 1:1000 class distribution relationship like?
It is an abstract relationship and we need to tie it to something concrete.
We can generate synthetic test datasets with different imbalanced class distribution and use that as a basis for developing an intuition for different skewed distributions we might be likely to encounter in real datasets.
Reviewing scatter plots of different class distributions can give a rough feeling for the relationship between the classes that can be useful when thinking about the selection of techniques and evaluation of models when working with similar class distributions in the future. They provide a point of reference.
We have already seen a 1:1 relationship in the previous section (e.g. 5000:5000).
Note that when working with binary classification problems, especially imbalanced problems, it is important that the majority class is assigned to class 0 and the minority class is assigned to class 1. This is because many evaluation metrics will assume this relationship.
Therefore, we can ensure our class distributions meet this practice by defining the majority then the minority classes in the call to the get_dataset() function; for example:
1
2
3
4
5
6
...
# define the class distribution
proportions={0:10000,1:10}
# generate dataset
X,y=get_dataset(proportions)
...
In this section, we can look at different skewed class distributions with the size of the minority class increasing on a log scale, such as:
1:10 or {0:10000, 1:1000}
1:100 or {0:10000, 1:100}
1:1000 or {0:10000, 1:10}
Let’s take a closer look at each class distribution in turn.
1:10 Imbalanced Class Distribution
A 1:10 class distribution with 10,000 to 1,000 examples means that there will be 11,000 examples in the dataset, with about 91 percent for class 0 and about 9 percent for class 1.
The complete code example is listed below.
1
2
3
4
5
6
7
8
9
10
11
12
13
14
15
16
17
18
19
20
21
22
23
24
25
26
27
28
29
30
31
32
33
34
35
36
37
38
39
40
41
42
43
44
45
46
# create and plot synthetic dataset with a given class distribution
from numpy import unique
from numpy import hstack
from numpy import vstack
from numpy import where
from matplotlib import pyplot
from sklearn.datasets import make_blobs
# create a dataset with a given class distribution
def get_dataset(proportions):
# determine the number of classes
n_classes=len(proportions)
# determine the number of examples to generate for each class
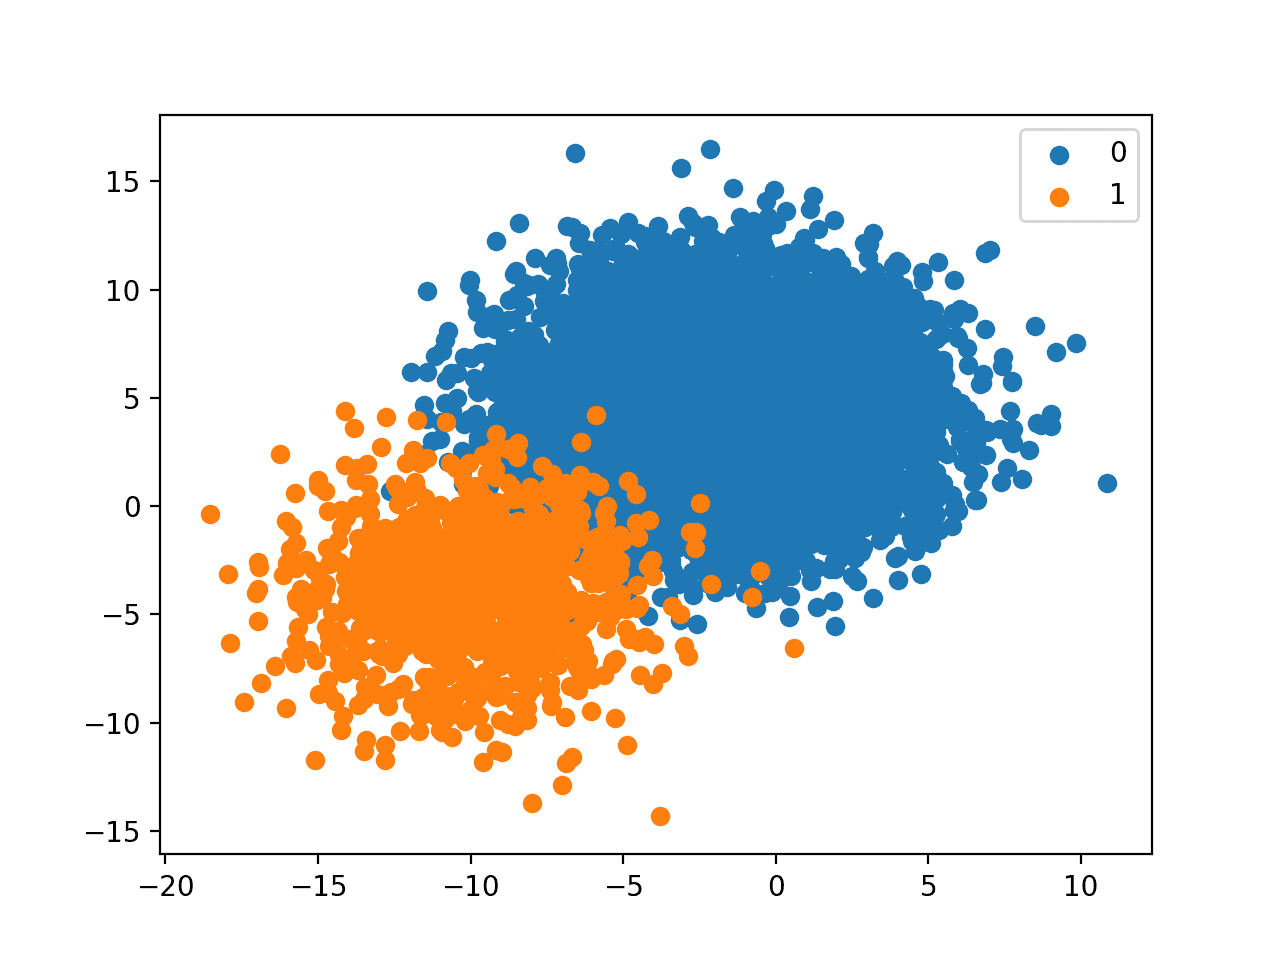
Running the example creates the dataset with the defined class distribution and plots the result.
Although the balance seems stark, the plot shows that about 10 percent of the points in the minority class compared to the majority class is not as bad as we might think.
The relationship appears manageable, although if the classes overlapped significantly, we can imagine a very different story.
Scatter Plot of Binary Classification Dataset With A 1 to 10 Class Distribution
1:100 Imbalanced Class Distribution
A 1:100 class distribution with 10,000 to 100 examples means that there will be 10,100 examples in the dataset, with about 99 percent for class 0 and about 1 percent for class 1.
The complete code example is listed below.
1
2
3
4
5
6
7
8
9
10
11
12
13
14
15
16
17
18
19
20
21
22
23
24
25
26
27
28
29
30
31
32
33
34
35
36
37
38
39
40
41
42
43
44
45
46
# create and plot synthetic dataset with a given class distribution
from numpy import unique
from numpy import hstack
from numpy import vstack
from numpy import where
from matplotlib import pyplot
from sklearn.datasets import make_blobs
# create a dataset with a given class distribution
def get_dataset(proportions):
# determine the number of classes
n_classes=len(proportions)
# determine the number of examples to generate for each class
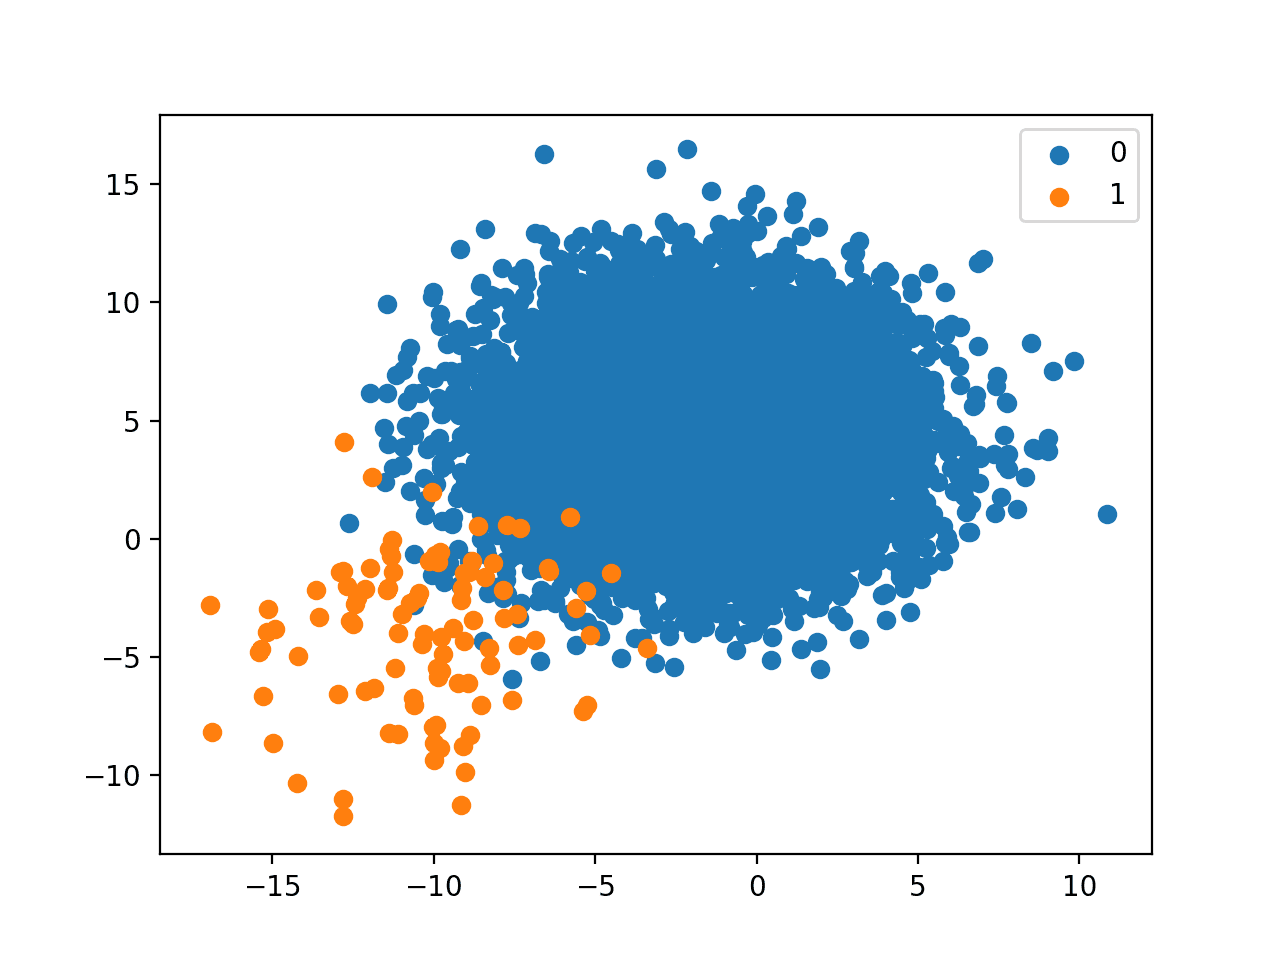
Running the example creates the dataset with the defined class distribution and plots the result.
A 1 to 100 relationship is a large skew.
The plot makes this clear with what feels like a sprinkling of points compared to the enormous mass of the majority class.
It is most likely that a real-world dataset will fall somewhere on the line between a 1:10 and 1:100 class distribution and the plot for 1:100 really highlights the need to carefully consider each point in the minority class, both in terms of measurement errors (e.g. outliers) and in terms of prediction errors that might be made by a model.
Scatter Plot of Binary Classification Dataset With A 1 to 100 Class Distribution
1:1000 Imbalanced Class Distribution
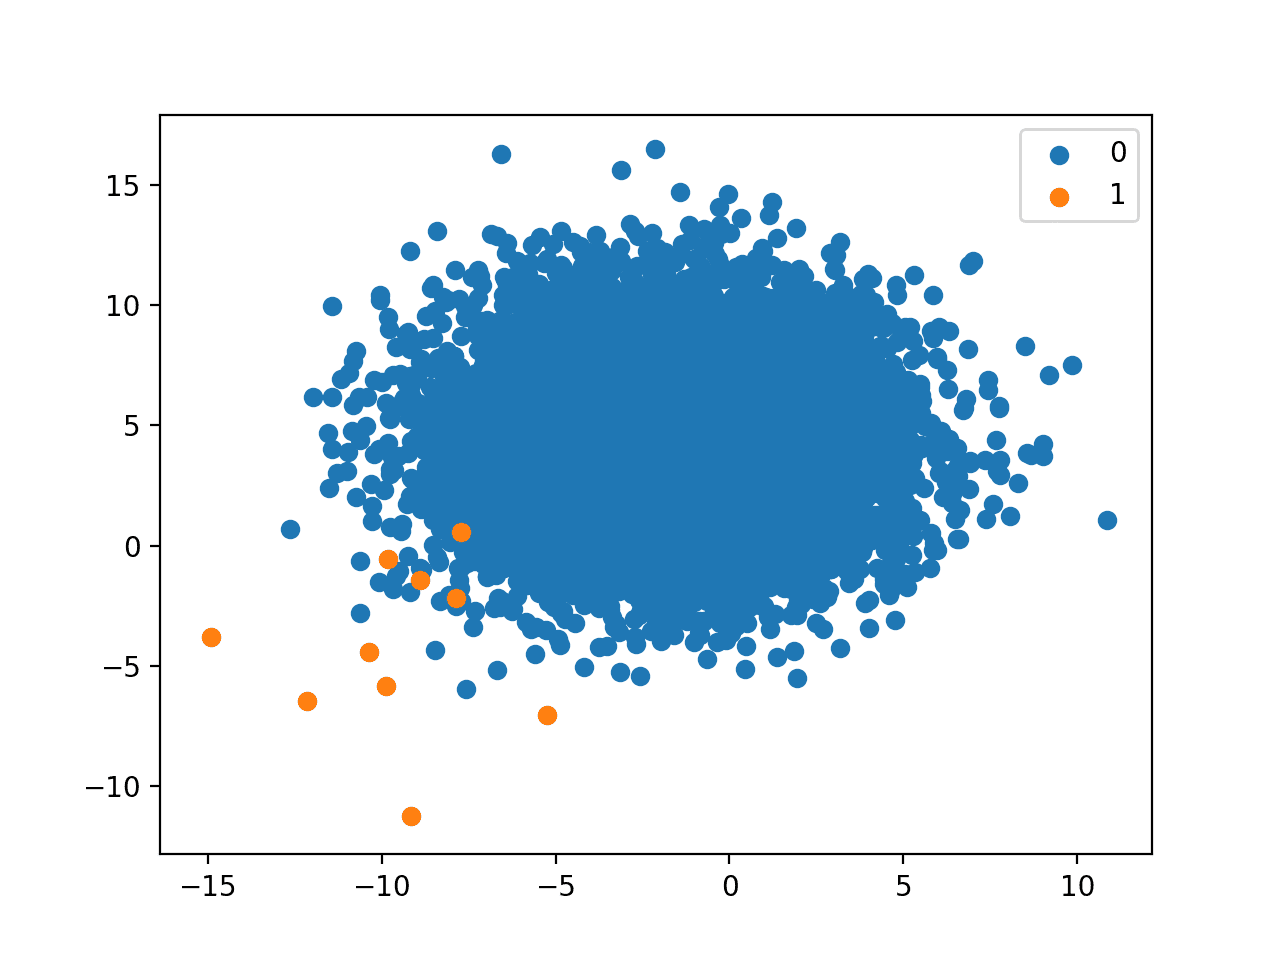
A 1:100 class distribution with 10,000 to 10 examples means that there will be 10,010 examples in the dataset, with about 99.9 percent for class 0 and about 0.1 percent for class 1.
The complete code example is listed below.
1
2
3
4
5
6
7
8
9
10
11
12
13
14
15
16
17
18
19
20
21
22
23
24
25
26
27
28
29
30
31
32
33
34
35
36
37
38
39
40
41
42
43
44
45
46
# create and plot synthetic dataset with a given class distribution
from numpy import unique
from numpy import hstack
from numpy import vstack
from numpy import where
from matplotlib import pyplot
from sklearn.datasets import make_blobs
# create a dataset with a given class distribution
def get_dataset(proportions):
# determine the number of classes
n_classes=len(proportions)
# determine the number of examples to generate for each class
Running the example creates the dataset with the defined class distribution and plots the result.
As we might already suspect, a 1 to 1,000 relationship is aggressive. In our chosen setup, just 10 examples of the minority class are present to 10,000 of the majority class.
With such a lack of data, we can see that on modeling problems with such a dramatic skew, that we should probably spend a lot of time on the actual minority examples that are available and see if domain knowledge can be used in some way. Automatic modeling methods will have a tough challenge.
This example also highlights another important aspect orthogonal to the class distribution and that is the number of examples. For example, although the dataset has a 1:1000 class distribution, having only 10 examples of the minority class is very challenging. Although, if we had the same class distribution with 1,000,000 of the majority class and 1,000 examples of the minority class, the additional 990 minority class examples would likely be invaluable in developing an effective model.
Scatter Plot of Binary Classification Dataset With A 1 to 1000 Class Distribution
Further Reading
This section provides more resources on the topic if you are looking to go deeper.
It provides self-study tutorials and end-to-end projects on: Performance Metrics, Undersampling Methods, SMOTE, Threshold Moving, Probability Calibration, Cost-Sensitive Algorithms
and much more...
Bring Imbalanced Classification Methods to Your Machine Learning Projects
Thanks Jason for beautiful explanation of imbalanced concept. However I would like to know the solution for this type of situation in real world scenario. How should we tackle this. Could you please suggest on this.
Also what’s your opinion for using neural network for such type of imbalance scenario. Is Neural Networks are capable of handling imbalanced data?
Thanks Jason. Could you please, in this post or in future tutorials:
– give examples of how class_weight argument in Keras is applied;
– explain why they only work intermittently; and
– explain what range of methods should we try?
First of all, thank you for creating invaluable sources on these subjects. I would have one question about your last sentence:
‘Although, if we had the same class distribution with 1,000,000 of the majority class and 1,000 examples of the minority class, the additional 990 minority class examples would likely be invaluable in developing an effective model.’
But if we consider classical sampling theory, why would the additional 990 cases from the minority class NOT help a lot for our model to get better trained on the minority class behavior? I understand that the sampling ratio would not change, but I would find strange that 1 case from the minority class would be equal to 1000 cases from the same class for a model.
Sorry for the confusion. The problems would not be comparable. The point I’m making is that we would prefer to model domains that offer more observations from the minority class – under the assumption that the decision boundary is non-trivial.
Hi,
you can include imbalanced multiclass classification for synthetic dataset . Also how to deal /identify and visulaize the class disjuncts like overlapping classes,outliers or overlapping classes multiclass imbalance dataset?
I tend to work with data that is in the 1:10 range and I find that Gradient Boosting outperforms other algorithms consistently which I guess not a surprise. Balancing the data however never seems to offer significant advantage. How does one visualize the distribution when there are more than 2 input values eg 10 or more
Thank you so much for sharing amazing materials. I was wondering if you could share any tutorials related to handling severely imbalanced classes in a big data domain. For instance, Blackbaze hard disk failure data specially Model Seagate is extremely large! It is difficult to use sklearn package or Pandas data frame!
Thank you so much for your reply! I appreciate it! In some cases, working with big data is challenging. PySpark has limited resources to deal with severely imbalanced data!


Hi Jason,
In Python, it is idiomatic to import numpy under the alias np as follows:
> import numpy as np
Why not follow this convention?
Best,
I don’t think it reads cleanly.
Thanks Jason for beautiful explanation of imbalanced concept. However I would like to know the solution for this type of situation in real world scenario. How should we tackle this. Could you please suggest on this.
Also what’s your opinion for using neural network for such type of imbalance scenario. Is Neural Networks are capable of handling imbalanced data?
Sir, please suggest.
Yes, I will give tutorials on this soon.
Neural nets can tackle imbalanced classification by setting the class_weight argument when calling fit() in Keras.
They are good in some cases, and less performant in other. Always try a range of methods.
Thanks Jason. Could you please, in this post or in future tutorials:
– give examples of how class_weight argument in Keras is applied;
– explain why they only work intermittently; and
– explain what range of methods should we try?
Many thanks!
Great suggestions, thanks.
Hi Jason,
First of all, thank you for creating invaluable sources on these subjects. I would have one question about your last sentence:
‘Although, if we had the same class distribution with 1,000,000 of the majority class and 1,000 examples of the minority class, the additional 990 minority class examples would likely be invaluable in developing an effective model.’
But if we consider classical sampling theory, why would the additional 990 cases from the minority class NOT help a lot for our model to get better trained on the minority class behavior? I understand that the sampling ratio would not change, but I would find strange that 1 case from the minority class would be equal to 1000 cases from the same class for a model.
Thank you in advance,
Tamas
You’re welcome.
Sorry for the confusion. The problems would not be comparable. The point I’m making is that we would prefer to model domains that offer more observations from the minority class – under the assumption that the decision boundary is non-trivial.
Amazing per usual. Thank you very much
Thanks Dave!
Hello,
Can you please include tutorial on multiclass imbalance dataset classification in your tutorial?
Great suggestion, thanks.
What problem are you having with imbalanced multi-class problems exactly?
Hi,
you can include imbalanced multiclass classification for synthetic dataset . Also how to deal /identify and visulaize the class disjuncts like overlapping classes,outliers or overlapping classes multiclass imbalance dataset?
Thanks.
I tend to work with data that is in the 1:10 range and I find that Gradient Boosting outperforms other algorithms consistently which I guess not a surprise. Balancing the data however never seems to offer significant advantage. How does one visualize the distribution when there are more than 2 input values eg 10 or more
Nice, thanks for sharing your finding.
You can use pair-wise scatter plots for more than 2 variables, so called scatter plot matrix.
Thank you so much for sharing amazing materials. I was wondering if you could share any tutorials related to handling severely imbalanced classes in a big data domain. For instance, Blackbaze hard disk failure data specially Model Seagate is extremely large! It is difficult to use sklearn package or Pandas data frame!
You’re welcome!
Perhaps the same techniques can be used but implemented using a framework for big data.
Sorry, I don’t have any examples of working with big data.
Thank you so much for your reply! I appreciate it! In some cases, working with big data is challenging. PySpark has limited resources to deal with severely imbalanced data!