The real estate industry is a vast network of stakeholders including agents, homeowners, investors, developers, municipal planners, and tech innovators, each bringing unique perspectives and objectives to the table. Within this intricate ecosystem, data emerges as the critical element that binds these diverse interests together, facilitating collaboration and innovation. PropTech, or Property Technology, illustrates this synergy by applying information technology to real estate, transforming how properties are researched, bought, sold, and managed through the power of data science.
From its nascent stages in the digitization of property listings to the current landscape that includes virtual reality, IoT-enabled smart homes, and blockchain-enhanced transactions, PropTech’s journey reflects an industry increasingly driven by data. This evolution is marked not by the technologies but by how data science harnesses information to streamline operations, enhance user experiences, and introduce efficiencies at every turn.
At the core of PropTech’s transformative impact is data science, which excels in making sense of vast datasets to uncover actionable insights. It equips all players in the real estate domain—from developers optimizing project locations to municipal planners shaping sustainable urban environments—with the tools to make decisions rooted in solid data analysis. Data science lays the groundwork for strategic planning and operational improvements across the real estate sector through sophisticated data management and descriptive analytics.
Exploring the application of data science for luxury homebuyers, you see a specific example of PropTech’s wider influence. This narrative not only showcases the nuanced benefits of data-driven strategies in evaluating luxury properties but also underlines the fundamental role of data in fostering a more integrated, efficient, and consumer-responsive real estate industry.
Let’s get started.

Finding Value with Data: The Cohesive Force Behind Luxury Real Estate Decisions
Photo by Breno Assis. Some rights reserved.
Overview
This post is divided into three parts; they are:
- Folium: A Guide to Interactive Mapping
- Empowering Luxury Homebuyers with Data Science: Finding Value in the Market
- Visualizing Opportunities: Mapping the Path to Accessible Luxury Real Estate
Folium: A Guide to Interactive Mapping
Folium is a powerful Python library that brings the world of geospatial data to life through interactive maps. Leveraging Leaflet.js, Folium allows users to create rich, dynamic visualizations with just a few lines of Python code, making it an invaluable tool for real estate professionals and data scientists alike. Its key strengths lie in its interactivity, allowing for zooming and clicking for details, and its seamless integration with Python’s data science stack, notably pandas, enabling sophisticated data-driven map visualizations with minimal effort.
For the real estate sector, Folium enables the visualization of property data against geographical contexts, offering insights into market trends, property valuations, and demographic overlays with unparalleled clarity. Folium maps can be easily saved as HTML files, facilitating effortless sharing with clients or stakeholders. This feature democratizes access to complex geospatial analyses, enhancing presentations, reports, and listings with interactive maps that provide a comprehensive view of the real estate landscape.
Folium is a package in PyPI. To install, you can use the following commands on your terminal or command-line interface:
|
1 |
pip install folium |
Once you’ve successfully installed the required packages, you’re ready to follow through with the examples below.
Kick-start your project with my book The Beginner’s Guide to Data Science. It provides self-study tutorials with working code.
Empowering Luxury Homebuyers with Data Science: Finding Value in the Market
In today’s real estate market, potential homeowners, especially those interested in the luxury segment, encounter the significant challenge of finding properties that not only satisfy their aesthetic and comfort preferences but also offer substantial value. This is where data science plays a pivotal role, transforming the daunting task of locating the perfect home into a journey rich with insights and discoveries.
The power of data science in real estate lies in its ability to analyze vast amounts of information, uncovering patterns, trends, and opportunities that might not be visible at first glance. For luxury homebuyers, this means the ability to identify properties that represent both opulence and value, ensuring their investment is as sound as it is beautiful.
Your first step is to identify the top 10 most expensive homes in Ames. This initial filter serves as your starting point, showcasing properties considered most valuable by the market. To do this, you’ll use the pandas library in Python to load your dataset and perform the necessary analysis.
Here’s the code that marks the beginning of your data-driven journey:
|
1 2 3 4 5 6 7 8 9 10 11 |
# Import the pandas library and load the dataset import pandas as pd Ames = pd.read_csv('Ames.csv') pd.set_option('display.max_columns', None) pd.set_option('display.width', 1000) # Identify the 10 most expensive homes based on SalePrice with key features top_10_expensive_homes = Ames.nlargest(10, 'SalePrice') features = ['SalePrice', 'GrLivArea', 'OverallQual', 'KitchenQual', 'TotRmsAbvGrd', 'Fireplaces'] top_10_df = top_10_expensive_homes[features] print(top_10_df) |
This block of code efficiently sifts through the Ames dataset to extract the 10 most expensive homes, focusing on key attributes that define luxury living: “SalePrice”, “GrLivArea” (above grade living area), “OverallQual” (overall material and finish quality), “KitchenQual” (kitchen quality), “TotRmsAbvGrd” (total rooms above grade), and “Fireplaces.” These features set the stage for differentiating between mere aesthetic appeal and true quality.
|
1 2 3 4 5 6 7 8 9 10 11 |
SalePrice GrLivArea OverallQual KitchenQual TotRmsAbvGrd Fireplaces 1007 755000 4316 10 Ex 10 2 1325 625000 3627 10 Gd 10 1 65 615000 2470 10 Ex 7 2 584 611657 2364 9 Ex 11 2 1639 610000 2674 10 Ex 8 2 615 591587 2338 9 Gd 8 2 2087 584500 3500 9 Ex 11 1 1112 555000 2402 10 Ex 10 2 802 538000 3279 8 Ex 12 1 407 535000 2698 10 Ex 11 1 |
To refine your search further, you apply specific criteria that embody the essence of luxury living. You focus on homes that boast an Overall Quality rating of 10, indicating the highest level of craftsmanship and materials. Additionally, you look for properties with exceptional kitchen quality (KitchenQual of “Ex”) and a significant feature of luxury comfort: the presence of two or more fireplaces. These criteria help you sift through the top contenders to highlight properties that truly represent the pinnacle of luxury in Ames.
Let’s execute the next block of code to filter the list of the top 10 most expensive homes down to those that meet these elite standards:
|
1 2 3 |
# Refine the search with highest quality, excellent kitchen, and 2 fireplaces elite = top_10_df.query('OverallQual == 10 & KitchenQual == "Ex" & Fireplaces >= 2').copy() print(elite) |
|
1 2 3 4 5 |
SalePrice GrLivArea OverallQual KitchenQual TotRmsAbvGrd Fireplaces 1007 755000 4316 10 Ex 10 2 65 615000 2470 10 Ex 7 2 1639 610000 2674 10 Ex 8 2 1112 555000 2402 10 Ex 10 2 |
This refined search narrows your focus to four elite properties that not only rank as some of the most expensive in Ames but also meet the stringent criteria for luxury.
As you delve deeper, it becomes imperative to introduce feature engineering. Feature engineering is the process of creating new variables or features from existing data that better represent the underlying problem. In your case, to enhance your understanding of real estate value. One such innovative feature is the Price Per Square Foot (PSF). The PSF metric emerges as a critical tool in your analytical arsenal, offering a perspective on value beyond mere listing prices. By calculating the PSF for each property, you can compare properties more equitably, irrespective of their size or the absolute price. This measure illuminates the investment value per square foot of living space, providing a standardized scale for assessing the true worth of luxury properties.
Let’s apply this calculation to your elite selection of homes:
|
1 2 3 |
# Introduce PSF to rank the options elite['PSF'] = elite['SalePrice']/elite['GrLivArea'] print(elite.sort_values(by='PSF')) |
This action yields the following insights, allowing you to rank the properties by their relative value:
|
1 2 3 4 5 |
SalePrice GrLivArea OverallQual KitchenQual TotRmsAbvGrd Fireplaces PSF 1007 755000 4316 10 Ex 10 2 174.930491 1639 610000 2674 10 Ex 8 2 228.122663 1112 555000 2402 10 Ex 10 2 231.057452 65 615000 2470 10 Ex 7 2 248.987854 |
Upon analyzing the PSF, it becomes evident that not all luxury homes are created equal. Despite being the most expensive on your list, the property with the lowest PSF offers the best value, underscoring the importance of this metric in evaluating luxury properties.
Now you can identify additional properties that embody the luxury standards and present exceptional value as defined by the PSF metric. By broadening your criteria to include all homes in the dataset with an Overall Quality rating of 10, excellent kitchen quality, and at least two fireplaces, but with a PSF under $175. The aim is to uncover homes that offer luxury at a more accessible price point.
Here’s how you proceed with this expanded analysis:
|
1 2 3 4 |
# Cross check entire homes to search for better value Ames['PSF'] = Ames['SalePrice']/Ames['GrLivArea'] value = Ames.query('PSF < 175 & OverallQual == 10 & KitchenQual == "Ex" & Fireplaces >=2') print(value[['SalePrice', 'GrLivArea', 'OverallQual', 'KitchenQual', 'TotRmsAbvGrd', 'Fireplaces', 'PSF']]) |
This refined search yields intriguing results:
|
1 2 3 |
SalePrice GrLivArea OverallQual KitchenQual TotRmsAbvGrd Fireplaces PSF 1007 755000 4316 10 Ex 10 2 174.930491 2003 475000 3608 10 Ex 12 2 131.651885 |
In this comprehensive search across the Ames dataset, you have uncovered two properties that not only embody the pinnacle of luxury with their superior amenities and craftsmanship but also stand as paragons of value within the luxury market. Remarkably, one of these homes presents a Price Per Square Foot (PSF) that significantly undercuts your established threshold, offering an exceptional opportunity for luxury homebuyers. This discovery underscores the potency of data science in real estate, enabling buyers to find homes that offer an extraordinary living experience and exceptional financial value.
Transitioning from numerical analysis to spatial visualization, let’s turn to Folium to map these standout properties within the geographical tapestry of Ames. This next step will provide a visual context to your findings and illustrate the practical application of data science in enhancing the real estate selection process, making the journey towards finding the perfect luxury home both informed and visually engaging.
Visualizing Opportunities: Mapping the Path to Accessible Luxury Real Estate
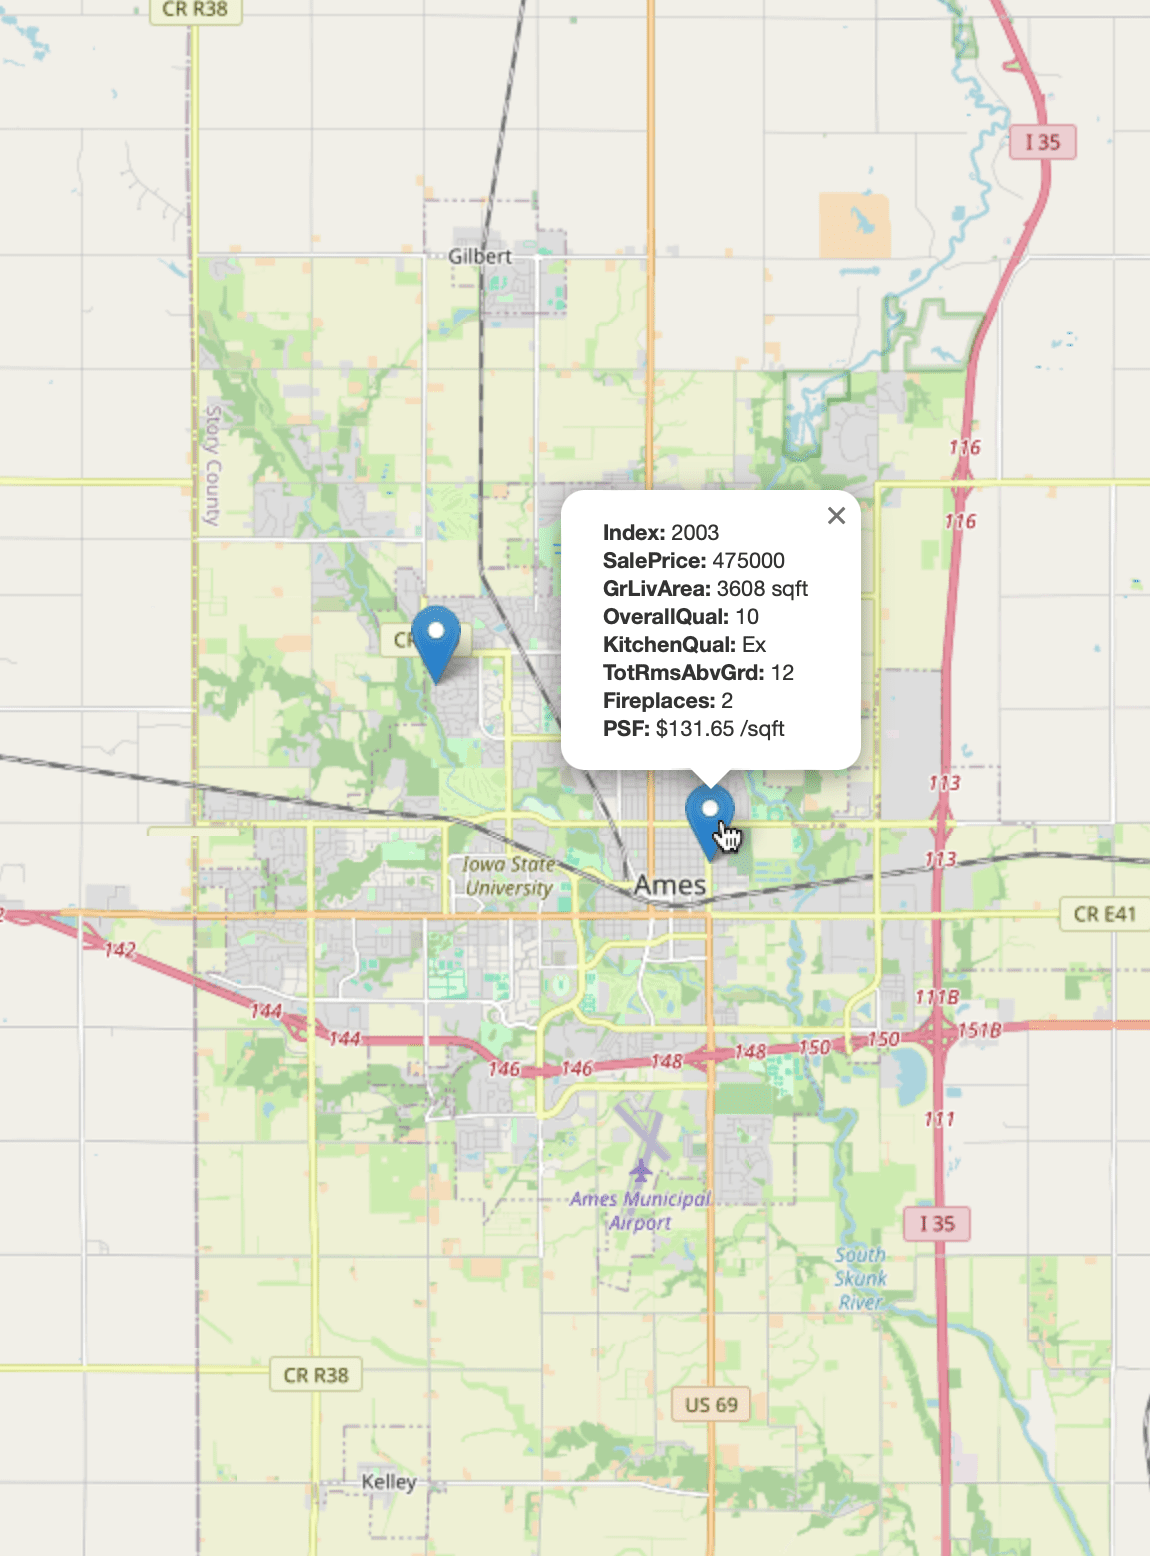
With the two standout properties identified, your next step leverages the power of Folium to bring these findings to life on an interactive map. This visualization not only situates each property within the geographical context of Ames, Iowa, but also enriches your analysis by allowing you to embed detailed information directly on the map.
Using Folium, you can create markers for each of these exceptional properties, providing potential buyers and stakeholders with a comprehensive overview at a glance. Each marker contains key data points about the property, including sale price, gross living area, quality ratings, and the calculated Price Per Square Foot (PSF), offering an intuitive and engaging way to explore these luxury homes. Below, you detail the process of adding this rich information to your map, ensuring each property is not just a point on a map, but a gateway to its unique story and value proposition.
|
1 2 3 4 5 6 7 8 9 10 11 12 13 14 15 16 17 18 19 20 21 22 23 24 25 26 27 28 |
# Visualize the results using folium import folium final_observation_indexes = value.index.tolist() # Filter the dataset for these observations to get their latitude and longitude final_locations = Ames.loc[final_observation_indexes, ['Latitude', 'Longitude']] # Create a Folium map centered around the average location of the final observations map_center = [final_locations['Latitude'].mean(), final_locations['Longitude'].mean()] value_map = folium.Map(location=map_center, zoom_start=12) # Add information to markers for idx, row in final_locations.iterrows(): # Extract additional information for the popup info = value.loc[idx, ['SalePrice', 'GrLivArea', 'OverallQual', 'KitchenQual', 'TotRmsAbvGrd', 'Fireplaces', 'PSF']] popup_text = f"""<b>Index:</b> {idx}<br> <b>SalePrice:</b> {info['SalePrice']}<br> <b>GrLivArea:</b> {info['GrLivArea']} sqft<br> <b>OverallQual:</b> {info['OverallQual']}<br> <b>KitchenQual:</b> {info['KitchenQual']}<br> <b>TotRmsAbvGrd:</b> {info['TotRmsAbvGrd']}<br> <b>Fireplaces:</b> {info['Fireplaces']}<br> <b>PSF:</b> ${info['PSF']:.2f} /sqft""" folium.Marker([row['Latitude'], row['Longitude']], popup=folium.Popup(popup_text, max_width=250)).add_to(value_map) # Save the map to an HTML file on working directory value_map.save('value_map.html') |
Executing this code will not only populate the Folium map with interactive markers but will also encapsulate the culmination of your data-driven quest within an HTML file, effortlessly saved to your working directory as value_map.html. This file serves as a tangible artifact, ready to be shared and explored further, inviting stakeholders to engage with your findings in an intuitive and dynamic format. Here is a static output of the file:
As you encapsulate your analytical journey, this visualization emerges as a pivotal resource, guiding potential homeowners through a market replete with hidden gems, illuminated by the meticulous application of data science. This approach not only empowers buyers with a deeper understanding of luxury real estate values but also fosters a more informed, strategic, and ultimately fulfilling decision-making process.
Heat map is another powerful visualization technique offered by Folium. It provides a vivid representation of data density or intensity in a given geographical area, allowing you to identify hotspots of activity or interest within the Ames real estate market.
|
1 2 3 4 5 6 7 8 9 10 11 12 13 14 15 16 17 18 19 20 21 22 23 24 25 26 27 28 29 |
# Import HeatMap from folium from folium.plugins import HeatMap # Filter out rows with NaN values in 'Latitude' or 'Longitude' Ames_Heat = Ames.dropna(subset=['Latitude', 'Longitude']) # Group by 'Neighborhood' and calculate mean 'Latitude' and 'Longitude' neighborhood_locs = Ames_Heat.groupby('Neighborhood').agg({'Latitude':'mean', 'Longitude':'mean'}).reset_index() # Create a map centered around Ames, Iowa ames_map_center = [Ames_Heat['Latitude'].mean(), Ames_Heat['Longitude'].mean()] ames_heatmap = folium.Map(location=ames_map_center, zoom_start=12) # Extract latitude and longitude data for the heatmap heat_data = [[row['Latitude'], row['Longitude']] for index, row in Ames_Heat.iterrows()] # Create and add a HeatMap layer to the map HeatMap(heat_data, radius=12).add_to(ames_heatmap) # Add one black flag per neighborhood to the map for index, row in neighborhood_locs.iterrows(): folium.Marker( location=[row['Latitude'], row['Longitude']], popup=row['Neighborhood'], icon=folium.Icon(color='black', icon='flag') ).add_to(ames_heatmap) # Save the map to an HTML file in the working directory ames_heatmap.save('ames_heatmap.html') |
In the output, you’ve strategically placed flags to mark each neighborhood within Ames, providing immediate visual cues to their locations. These flags, distinguished by their black color, bear the full name of each neighborhood, serving as a navigational guide through your exploration. Additionally, the heat map utilizes a color gradient to indicate the density of properties, with warmer colors representing higher concentrations of homes. This color coding not only enhances the visual appeal of your map but also offers an intuitive understanding of market activity and potential areas of interest for developers and buyers alike.

Leveraging insights from your heat map visualization enables developers to strategically target lower-density neighborhoods. By focusing on emerging neighborhoods and prioritizing innovative design and construction efficiency, developers can introduce a new dimension of affordable luxury homes. This strategy caters to the demand for high-quality living spaces and expands the market by making luxury homes more accessible to a broader audience. This combined strategy, informed by data science, geospatial analysis, and domain experts, underscores the transformative potential of these disciplines in shaping the future of accessible luxury real estate, ensuring that high-quality living is within reach for more people.
Want to Get Started With Beginner's Guide to Data Science?
Take my free email crash course now (with sample code).
Click to sign-up and also get a free PDF Ebook version of the course.
Further Reading
Python Libraries
Tutorials
Resources
Summary
In this comprehensive exploration, you delved into the transformative role of data science and interactive mapping in the real estate market, particularly focusing on the luxury segment in Ames, Iowa. Through a meticulous application of data analysis and visualization techniques, you uncovered invaluable insights that not only empower luxury homebuyers but also open new avenues for developers looking to innovate within the realm of accessible luxury real estate.
Specifically, you learned:
- The application of data science in identifying luxury properties.
- The introduction of feature engineering and the calculation of Price Per Square Foot (PSF) as innovative methods to assess relative value.
- How to utilize Folium, a powerful Python library, for creating dynamic visuals to enhance real estate decisions.
Do you have any questions? Please ask your questions in the comments below, and I will do my best to answer.
Get Started on The Beginner's Guide to Data Science!

Learn the mindset to become successful in data science projects
...using only minimal math and statistics, acquire your skill through short examples in Python
Discover how in my new Ebook:
The Beginner's Guide to Data Science
It provides self-study tutorials with all working code in Python to turn you from a novice to an expert. It shows you how to find outliers, confirm the normality of data, find correlated features, handle skewness, check hypotheses, and much more...all to support you in creating a narrative from a dataset.


")
No comments yet.