In the vast universe of data, it’s not always about what you can see but rather what you can infer. Confidence intervals, a cornerstone of inferential statistics, empower you to make educated guesses about a larger population based on your sample data. Using the Ames Housing dataset, let’s unravel the concept of confidence intervals and see how they can provide actionable insights into the real estate market.
Let’s get started.

Inferential Insights: How Confidence Intervals Illuminate the Ames Real Estate Market.
Photo by Jonathan Klok. Some rights reserved.
Overview
This post unfolds through the following segments:
- The Core of Inferential Statistics
- What are Confidence Intervals?
- Estimating Sales Prices with Confidence Intervals
- Understanding the Assumptions Behind Confidence Intervals
The Core of Inferential Statistics
Inferential Statistics uses a sample of data to make inferences about the population from which it was drawn. The main components include:
- Confidence Intervals: Range within which a population parameter is likely to lie.
- Hypothesis Testing: Process of making inferences about population parameters.
Inferential Statistics is indispensable when it is impractical to study an entire population, and insights need to be derived from a representative sample, as is the case with the Ames properties dataset.
Kick-start your project with my book The Beginner’s Guide to Data Science. It provides self-study tutorials with working code.
What are Confidence Intervals?
Imagine you’ve taken a random sample of houses from a city and calculated the average sales price. While this gives you a single estimate, wouldn’t it be more informative to have a range in which the true average sales price for the entire city likely falls? This range estimate is what a confidence interval provides. In essence, a confidence interval gives us a range of values within which we can be reasonably sure (e.g., 95% confident) that the true population parameter (like the mean or proportion) lies.
Estimating Sales Prices with Confidence Intervals
While point estimates like means and medians give us an idea about central tendency, they don’t inform us about the range in which the true population parameter might lie. Confidence intervals bridge this gap. For instance, if you want to estimate the mean sales price of all houses in Ames, you can use the dataset to compute a 95% confidence interval for the mean sales price. This interval will give us a range in which we can be 95% confident that the true mean sales price of all houses in Ames lies.
You will use the t-distribution to find the confidence interval:
|
1 2 3 4 5 6 7 8 9 10 11 12 13 14 15 16 17 18 |
# Import the necessary libraries and load the data import scipy.stats as stats import pandas as pd Ames = pd.read_csv('Ames.csv') #Define the confidence level and degrees of freedom confidence_level = 0.95 degrees_freedom = Ames['SalePrice'].count() - 1 #Calculate the confidence interval for 'SalePrice' confidence_interval = stats.t.interval(confidence_level, degrees_freedom, loc=Ames['SalePrice'].mean(), scale=Ames['SalePrice'].sem()) # Print out the sentence with the confidence interval figures print(f"The 95% confidence interval for the " f"true mean sales price of all houses in Ames is " f"between \${confidence_interval[0]:.2f} and \${confidence_interval[1]:.2f}.") |
|
1 2 |
The 95% confidence interval for the true mean sales price of all houses in Ames is between $175155.78 and $180951.11. |
Confidence Intervals provide a range that, with a certain level of confidence, is believed to encompass the true population parameter. Interpreting this range allows us to understand the variability and precision of our estimate. If a 95% confidence interval for the mean ‘SalePrice’ is (\$175,156, \$180,951), we can be 95% confident that the true mean sales price for all properties in Ames lies between \$175,156 and \$180,951.
|
1 2 3 4 5 6 7 8 9 10 11 12 13 14 15 16 17 18 19 20 |
# Import additional libraries import matplotlib.pyplot as plt # Plot the main histogram plt.figure(figsize=(10, 7)) plt.hist(Ames['SalePrice'], bins=30, color='lightblue', edgecolor='black', alpha=0.5, label='Sales Prices Distribution') # Vertical lines for sample mean and confidence interval with adjusted styles plt.axvline(Ames['SalePrice'].mean(), color='blue', linestyle='-', label=f'Mean: ${Ames["SalePrice"].mean():,.2f}') plt.axvline(confidence_interval[0], color='red', linestyle='--', label=f'Lower 95% CI: ${confidence_interval[0]:,.2f}') plt.axvline(confidence_interval[1], color='green', linestyle='--', label=f'Upper 95% CI: ${confidence_interval[1]:,.2f}') # Annotations and labels plt.title('Distribution of Sales Prices with Confidence Interval', fontsize=20) plt.xlabel('Sales Price', fontsize=16) plt.ylabel('Frequency', fontsize=16) plt.xlim([min(Ames['SalePrice']) - 5000, max(Ames['SalePrice']) + 5000]) plt.legend() plt.grid(axis='y') plt.show() |
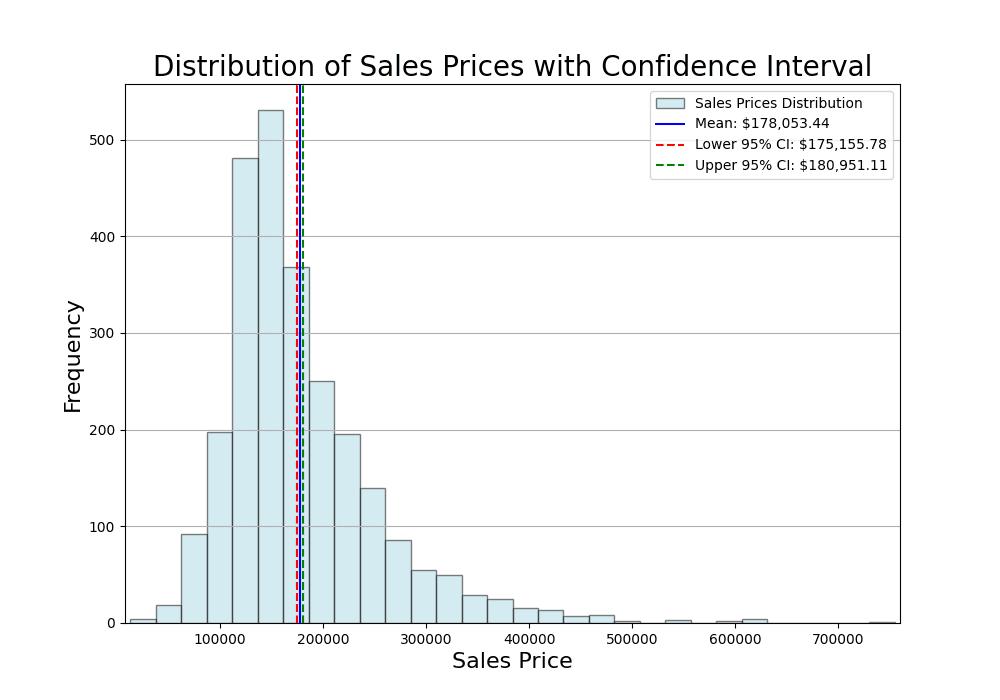
Distribution of sales prices and the mean
In the visual above, the histogram represents the distribution of sales prices in the Ames Housing dataset. The blue vertical line corresponds to the sample mean, providing a point estimate for the average sales price. The dashed red and green lines represent the 95% lower and upper confidence intervals, respectively.
Let’s delve deeper into the price range between \$150,000 and \$200,000.
|
1 2 3 4 5 6 7 8 9 10 11 12 13 14 15 16 17 18 19 |
# Creating a second plot focused on the mean and confidence intervals plt.figure(figsize=(10, 7)) plt.hist(Ames['SalePrice'], bins=30, color='lightblue', edgecolor='black', alpha=0.5, label='Sales Prices') # Zooming in around the mean and confidence intervals plt.xlim([150000, 200000]) # Vertical lines for sample mean and confidence interval with adjusted styles plt.axvline(Ames['SalePrice'].mean(), color='blue', linestyle='-', label=f'Mean: ${Ames["SalePrice"].mean():,.2f}') plt.axvline(confidence_interval[0], color='red', linestyle='--', label=f'Lower 95% CI: ${confidence_interval[0]:,.2f}') plt.axvline(confidence_interval[1], color='green', linestyle='--', label=f'Upper 95% CI: ${confidence_interval[1]:,.2f}') # Annotations and labels for the zoomed-in plot plt.title('Zoomed-in View of Mean and Confidence Intervals', fontsize=20) plt.xlabel('Sales Price', fontsize=16) plt.ylabel('Frequency', fontsize=16) plt.legend() plt.grid(axis='y') plt.show() |
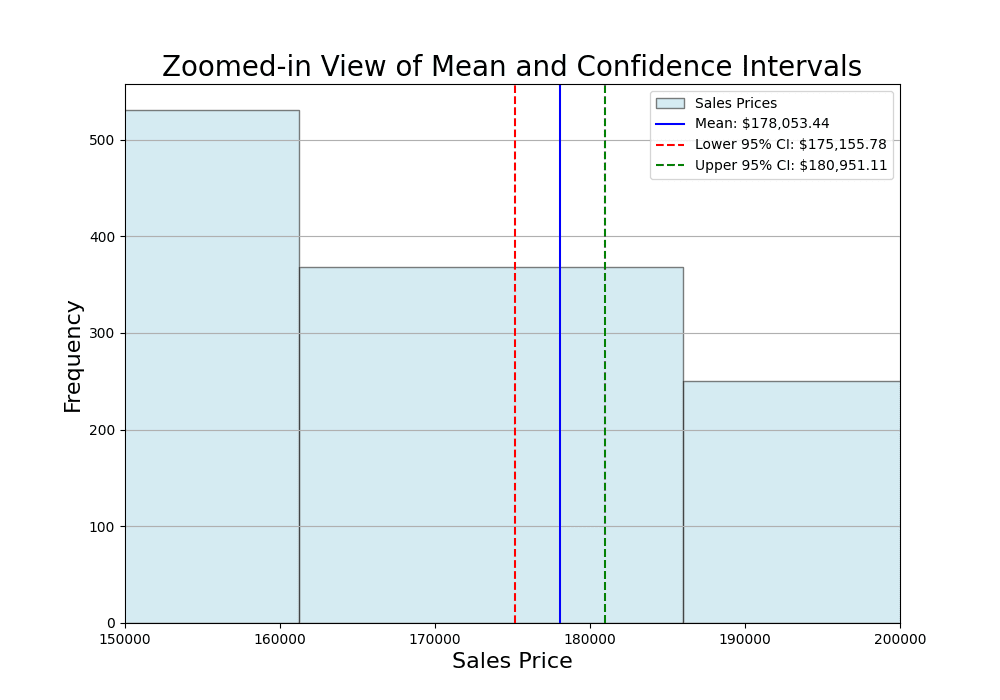
The confidence interval is interpreted as follows: We are 95% confident that the true mean sales price for all houses in Ames lies between the lower confidence level of \$175,156 and the upper confidence level of \$180,951. This range accounts for the inherent variability in estimating population parameters from a sample. The mean computed from the collected sample is \$178,053, but the actual value from the entire population may differ. In other words, this interval is narrow because it is calculated from a large number of samples.
Want to Get Started With Beginner's Guide to Data Science?
Take my free email crash course now (with sample code).
Click to sign-up and also get a free PDF Ebook version of the course.
Understanding the Assumptions Behind Confidence Intervals
To skillfully apply confidence intervals in the dynamic landscape of the Ames real estate market, it’s crucial to apprehend the foundational assumptions underpinning our analysis.
Assumption 1: Random Sampling. Our analysis assumes that the data is collected through a random sampling process, ensuring that each property in Ames has an equal chance of being included. This randomness enhances the generalizability of our findings to the entire real estate market.
Assumption 2: The Central Limit Theorem (CLT) and Large Samples. A pivotal assumption in our analysis is the Central Limit Theorem (CLT), which enables the use of the t-distribution in calculating confidence intervals. The CLT holds that for large samples, the sampling distribution of the sample mean approximates a normal distribution, regardless of the population’s distribution. In our case, with 2,579 observations, the CLT is robustly satisfied.
Assumption 3: Independence. We assume that the sales prices of individual houses are independent of each other. This assumption is crucial, ensuring that the sales price of one house does not influence the sales price of another. It’s particularly relevant in the diverse real estate market of Ames.
Assumption 4: Known or Estimated Population Standard Deviation (for Z-Interval). While our primary approach involves using the t-distribution, it’s worth noting that confidence intervals can be calculated using the Z-score, requiring knowledge or a reliable estimate of the population standard deviation. However, our analysis favors the t-distribution, which is more robust when dealing with smaller sample sizes or when the population standard deviation is unknown.
Assumption 5: Continuous Data. Confidence intervals are applied to continuous data. In our context, the sales prices of houses in Ames are continuous variables, making confidence intervals appropriate for estimating population parameters.
These assumptions form the bedrock of our analysis, and it’s imperative to recognize their role and assess their validity for dependable and insightful real estate market analysis. Violations of these assumptions could compromise the reliability of our conclusions. In summary, our methodology, rooted in the t-distribution, leverages these assumptions to provide nuanced insights into market trends and property values in Ames.
Further Reading
Tutorials
Resources
Summary
Specifically, you learned:
- The foundational concept of confidence intervals in inferential statistics.
- How to estimate and interpret the 95% confidence interval for the mean sales price in the Ames housing market.
- The critical assumptions underlying confidence interval calculations.
Do you have any questions? Please ask your questions in the comments below, and I will do my best to answer.
Get Started on The Beginner's Guide to Data Science!

Learn the mindset to become successful in data science projects
...using only minimal math and statistics, acquire your skill through short examples in Python
Discover how in my new Ebook:
The Beginner's Guide to Data Science
It provides self-study tutorials with all working code in Python to turn you from a novice to an expert. It shows you how to find outliers, confirm the normality of data, find correlated features, handle skewness, check hypotheses, and much more...all to support you in creating a narrative from a dataset.


No comments yet.