When we finish a Python project and roll it out for other people to use, the easiest way is to present our project as a command-line program. If you want to make it friendlier, you may want to develop a GUI for your program so people can interact with it with mouse clicks while it runs. Developing a GUI can be difficult as the model of human-computer interaction is complex. Therefore, a compromise is to create a web interface for your program. It requires some extra work compared to a pure command-line program, but not as heavy as writing an interface using, say, Qt5 library. In this post, we will show you the details of a web interface and how easy it is to give your program one.
After finishing this tutorial, you will learn:
- The Flask framework from a simple example
- Using Dash to build an interactive web page entirely in Python
- How a web application operates
Kick-start your project with my new book Python for Machine Learning, including step-by-step tutorials and the Python source code files for all examples.
Let’s get started!
Web Frameworks for Your Python Projects
Photo by Quang Nguyen Vinh. Some rights reserved.
Overview
This tutorial is divided into five parts; they are:
- Python and the web
- Flask for web API applications
- Dash for interactive widgets
- Polling in Dash
- Combining Flask and Dash
Python and the Web
The web is served using the hypertext transfer protocol (HTTP). Python’s standard library comes with support for interacting with HTTP. If you simply want to run a web server with Python, nothing can be easier than going to a directory of files to serve and run the command.
|
1 |
python -m http.server |
This will usually launch a web server at port 8000. If index.html exists in the directory, that would be the default page to serve if we open a browser on the same computer with the address http://localhost:8000/.
This built-in web server is great if we just need to quickly set up a web server (e.g., let another computer on the local network download a file). But it would not be sufficient if we want to do more, such as having some dynamic content.
Before we move on to the details, let’s review what we would like to achieve when we speak of the web interface. Firstly, a web page in the modern day would be an interface for disseminating information to the user interactively. This means not only sending information from the server but also receiving input from the user. The browser is capable of rendering the information aesthetically.
Alternatively, we may use a web page without a browser. A case would be to download a file using web protocols. In Linux, we have the wget tool famous for doing this task. Another case is to query information or pass information to the server. For example, in AWS EC2 instances, you can check the machine instances’ metadata at the address http://169.254.169.254/latest/meta-data/ (where the 169.254.169.254 is the special IP address available on EC2 machines). In Linux instances, we may use the curl tool to check. Its output will not be in HTML but in a plain-text machine-readable format. Sometimes, we call this the web API as we use it like a remotely executed function.
These are two different paradigms in web applications. The first one needs to write code for the interaction between user and server. The second one needs to set up various end-points on the URL so users can request different things using different addresses. In Python, there are third-party libraries to do both.
Want to Get Started With Python for Machine Learning?
Take my free 7-day email crash course now (with sample code).
Click to sign-up and also get a free PDF Ebook version of the course.
Flask for Web API Applications
The tools that allow us to write programs in Python to build a web-based application are called web frameworks. There are a lot. Django is probably the most famous one. However, the learning curve of different web frameworks can vary dramatically. Some web frameworks assume you use a model-view design, and you need to understand the rationale behind it to make sense of how you should use it.
As a machine learning practitioner, you probably want to do something quick, not too complex, and yet powerful enough to meet many use cases. Flask is probably a good choice in this class.
Flask is a lightweight web framework. You can run it as a command and use it as a Python module. Let’s say we want to write a web server that reports the current time in any user-specified time zone. It can be done using Flask in a trivial way:
|
1 2 3 4 5 6 7 8 9 10 11 12 13 14 15 16 |
from datetime import datetime import pytz from flask import Flask app = Flask("time now") @app.route("/now/<path:timezone>") def timenow(timezone): try: zone = pytz.timezone(timezone) now = datetime.now(zone) return now.strftime("%Y-%m-%d %H:%M:%S %z %Z\n") except pytz.exceptions.UnknownTimeZoneError: return f"Unknown time zone: {timezone}\n" app.run() |
Save the above into server.py or any filename you like, then run it on a terminal. You will see the following:
|
1 2 3 4 5 6 |
* Serving Flask app 'time now' (lazy loading) * Environment: production WARNING: This is a development server. Do not use it in a production deployment. Use a production WSGI server instead. * Debug mode: off * Running on http://127.0.0.1:5000 (Press CTRL+C to quit) |
This means your script is now running as a web server at http://127.0.0.1:5000. It will serve web requests forever until you interrupt it with Ctrl-C.
If you open up another terminal and query for the URL, e.g., using curl in Linux:
|
1 2 |
$ curl http://127.0.0.1:5000/now/Asia/Tokyo 2022-04-20 13:29:42 +0900 JST |
You will see the time printed on the screen in the time zone you requested (Asia/Tokyo in this case, you can see the list of all supported time zone on Wikipedia). The string returned by the function in your code will be the content responded by the URL. If the time zone is not recognized, you will see the “Unknown time zone” message as returned by the except block in the code above.
If we want to extend this a little bit such that we will assume UTC if no time zone is provided, we just need to add another decorator to the function:
|
1 2 3 4 5 6 7 8 9 10 11 12 13 14 15 16 17 18 19 20 |
from datetime import datetime import pytz from flask import Flask app = Flask("time now") @app.route('/now', defaults={'timezone': ''}) @app.route("/now/<path:timezone>") def timenow(timezone): try: if not timezone: zone = pytz.utc else: zone = pytz.timezone(timezone) now = datetime.now(zone) return now.strftime("%Y-%m-%d %H:%M:%S %z %Z\n") except pytz.exceptions.UnknownTimeZoneError: return f"Unknown timezone: {timezone}\n" app.run() |
Restarting the server, we can see the result as follows:
|
1 2 3 4 5 6 |
$ curl http://127.0.0.1:5000/now/Asia/Tokyo 2022-04-20 13:37:27 +0900 JST $ curl http://127.0.0.1:5000/now/Asia/Tok Unknown timezone: Asia/Tok $ curl http://127.0.0.1:5000/now 2022-04-20 04:37:29 +0000 UTC |
Nowadays, many such applications return a JSON string for more complex data, but technically anything can be delivered. If you wish to create more web APIs, simply define your functions to return the data and decorate it with @app.route() as in the above examples.
Dash for Interactive Widgets
The web end points, as provided by Flask, are powerful. A lot of web applications are done in this way. For example, we can write the web user interface using HTML and handle the user interaction with Javascript. Once the user triggers an event, we can let Javascript handle any UI change and create an AJAX call to the server by sending data to an end point and waiting for the reply. An AJAX call is asynchronous; hence when the web server’s response is received (usually within a fraction of a section), Javascript is triggered again to further update the UI to let the user know about it.
However, as the web interface gets more and more complex, writing Javascript code can be tedious. Hence there are many client-side libraries to simplify this. Some are to simplify Javascript programming, such as jQuery. Some are to change the way HTML and Javascript should interact, such as ReactJS. But since we are developing machine learning projects in Python, it would be great to develop an interactive web application in Python without resorting to Javascript. Dash is a tool for this.
Let’s consider an example in machine learning: We want to use the MNIST handwritten digits dataset to train a handwritten digit recognizer. The LeNet5 model is famous for this task. But we want to let the user fine-tune the LeNet5 model, retrain it, and then use it for recognition. Training a simple LeNet5 model can be done with only a few lines of code:
|
1 2 3 4 5 6 7 8 9 10 11 12 13 14 15 16 17 18 19 20 21 22 23 24 25 26 27 28 29 30 31 32 33 34 |
import numpy as np import tensorflow as tf from tensorflow.keras.datasets import mnist from tensorflow.keras.models import Sequential from tensorflow.keras.layers import Conv2D, Dense, AveragePooling2D, Flatten from tensorflow.keras.utils import to_categorical # Load MNIST digits (X_train, y_train), (X_test, y_test) = mnist.load_data() # Reshape data to (n_samples, height, width, n_channel) X_train = np.expand_dims(X_train, axis=3).astype("float32") X_test = np.expand_dims(X_test, axis=3).astype("float32") # One-hot encode the output y_train = to_categorical(y_train) y_test = to_categorical(y_test) # LeNet5 model model = Sequential([ Conv2D(6, (5,5), activation="tanh", input_shape=(28,28,1), padding="same"), AveragePooling2D((2,2), strides=2), Conv2D(16, (5,5), activation="tanh"), AveragePooling2D((2,2), strides=2), Conv2D(120, (5,5), activation="tanh"), Flatten(), Dense(84, activation="tanh"), Dense(10, activation="softmax") ]) # Train the model model.compile(loss="categorical_crossentropy", optimizer="adam", metrics=["accuracy"]) model.fit(X_train, y_train, validation_data=(X_test, y_test), epochs=100, batch_size=32) |
There are several hyperparameters that we can change in this code, such as the activation function, the optimizer for training, the number of epochs, and the batch size. We can make an interface in Dash to let the user change these and retrain the model. This interface will be presented in HTML but coded in Python:
|
1 2 3 4 5 6 7 8 9 10 11 12 13 14 15 16 17 18 19 20 21 22 23 24 25 26 27 28 29 30 31 32 33 34 35 36 37 38 39 40 41 42 43 44 45 46 47 48 49 50 51 52 53 54 55 56 57 58 59 60 61 62 63 64 65 66 67 68 |
... from flask import Flask from dash import Dash, html, dcc # default values model_data = { "activation": "relu", "optimizer": "adam", "epochs": 100, "batchsize": 32, } ... server = Flask("mlm") app = Dash(server=server) app.layout = html.Div( id="parent", children=[ html.H1( children="LeNet5 training", style={"textAlign": "center"} ), html.Div( className="flex-container", children=[ html.Div(children=[ html.Div(id="activationdisplay", children="Activation:"), dcc.Dropdown( id="activation", options=[ {"label": "Rectified linear unit", "value": "relu"}, {"label": "Hyperbolic tangent", "value": "tanh"}, {"label": "Sigmoidal", "value": "sigmoid"}, ], value=model_data["activation"] ) ]), html.Div(children=[ html.Div(id="optimizerdisplay", children="Optimizer:"), dcc.Dropdown( id="optimizer", options=[ {"label": "Adam", "value": "adam"}, {"label": "Adagrad", "value": "adagrad"}, {"label": "Nadam", "value": "nadam"}, {"label": "Adadelta", "value": "adadelta"}, {"label": "Adamax", "value": "adamax"}, {"label": "RMSprop", "value": "rmsprop"}, {"label": "SGD", "value": "sgd"}, {"label": "FTRL", "value": "ftrl"}, ], value=model_data["optimizer"] ), ]), html.Div(children=[ html.Div(id="epochdisplay", children="Epochs:"), dcc.Slider(1, 200, 1, marks={1: "1", 100: "100", 200: "200"}, value=model_data["epochs"], id="epochs"), ]), html.Div(children=[ html.Div(id="batchdisplay", children="Batch size:"), dcc.Slider(1, 128, 1, marks={1: "1", 128: "128"}, value=model_data["batchsize"], id="batchsize"), ]), ] ), html.Button(id="train", n_clicks=0, children="Train"), ] ) |
Here we set up a Dash app built on top of a Flask server. The majority of the code above is to set up the layout of the Dash app that will be displayed on the web browser. The layout has a title on top, a button (with the label “Train”) at the bottom, and a large box containing multiple option widgets in the middle. There is a dropdown box for an activation function, another for a training optimizer, and two sliders, one for the number of epochs and one for the batch size. The layout will be like the following:
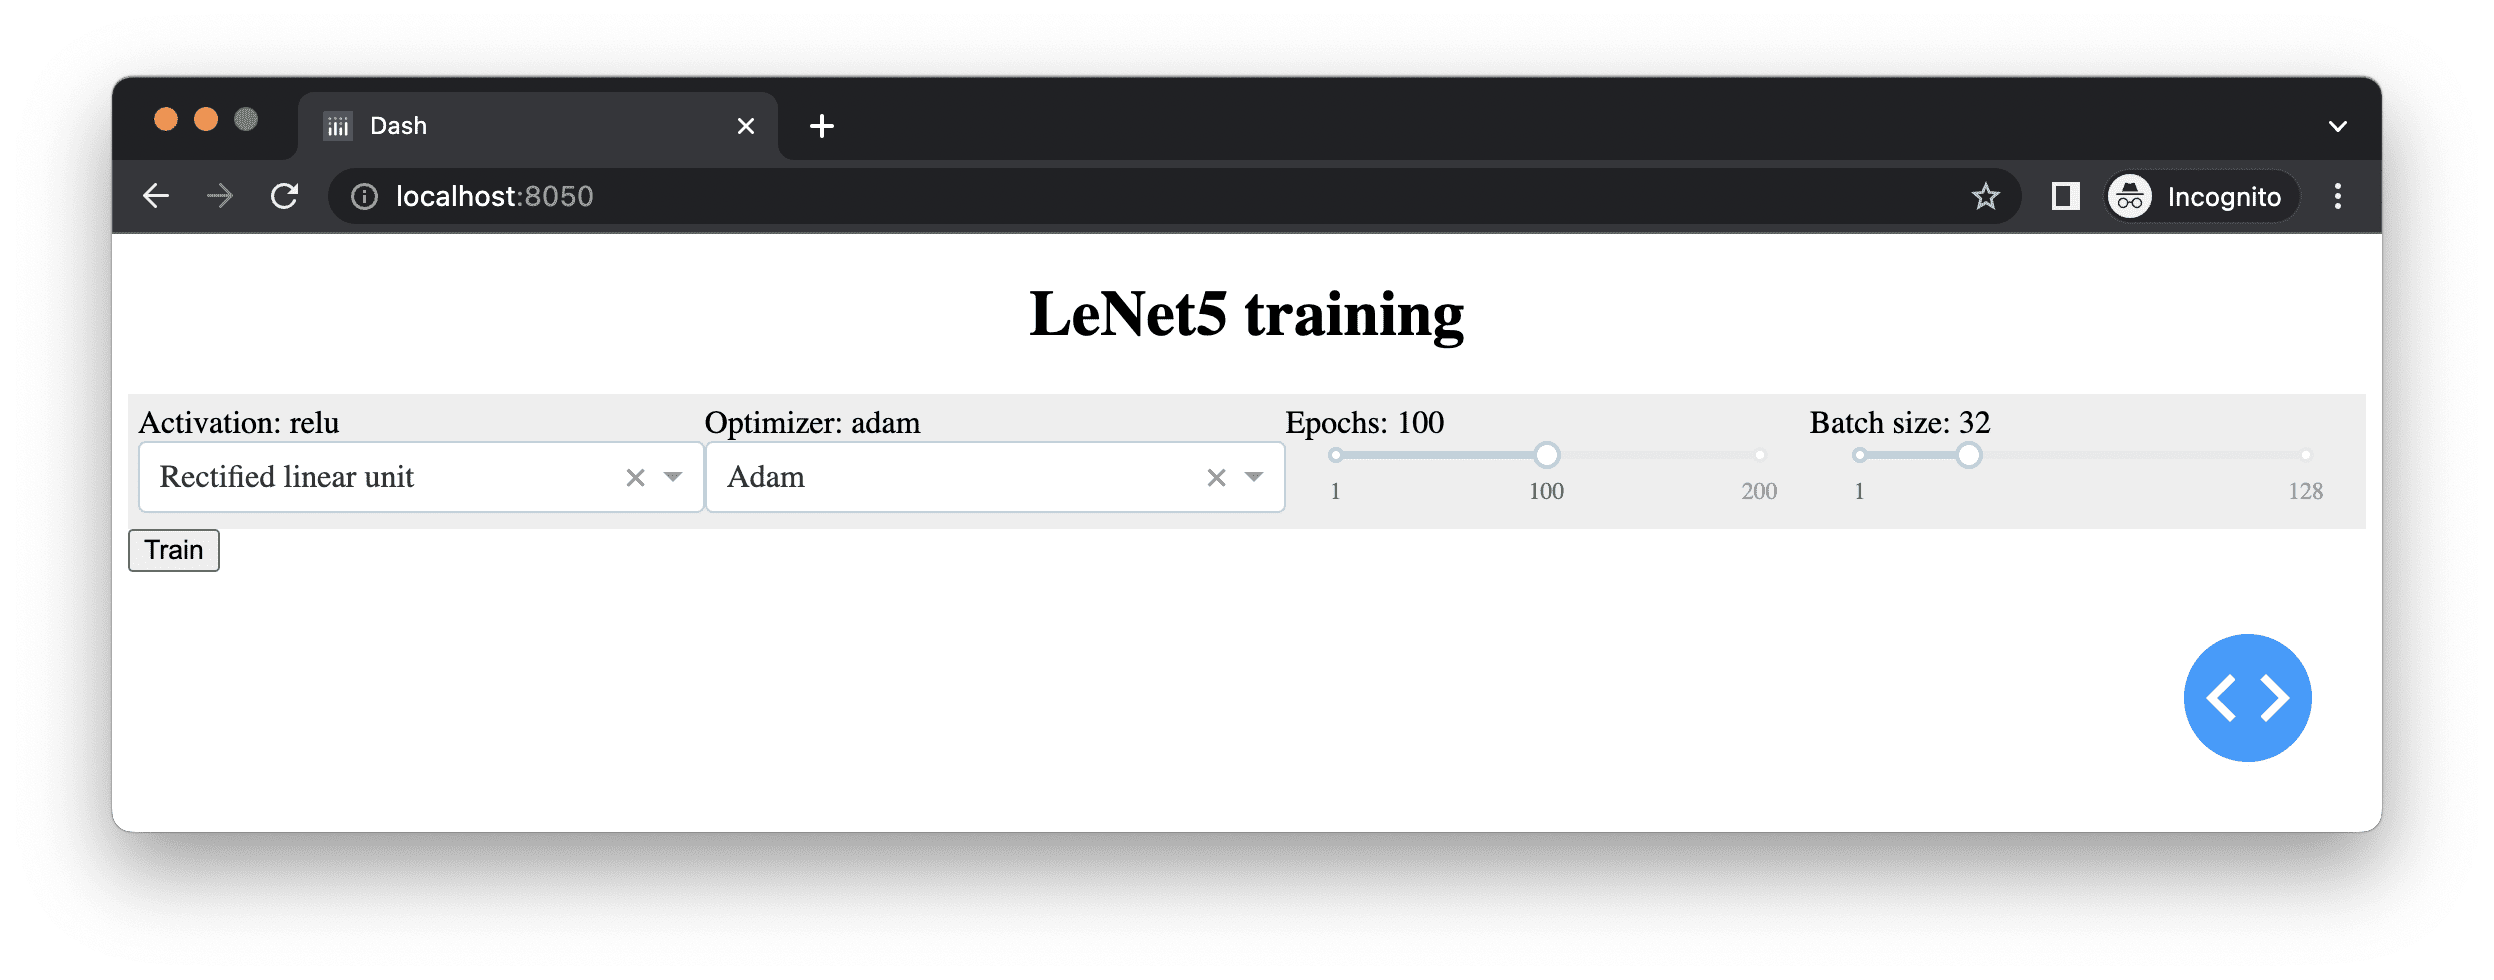
If you’re familiar with HTML development, you probably noticed we used many <div> elements above. Moreover, we provided style arguments to some elements to change the way they are rendered on the browser. Indeed, we saved this Python code into file server.py and created a file assets/main.css with the following content:
|
1 2 3 4 5 6 7 8 9 10 |
.flex-container { display: flex; padding: 5px; flex-wrap: nowrap; background-color: #EEEEEE; } .flex-container > * { flex-grow: 1 } |
This is how we can have the four different user options aligned horizontally when this code is run.
After we have the HTML frontend created, the key is to let the user change the hyperparameter by selecting from the dropdown list or moving the slider. Then, we kick start the model training after the user clicks on the “Train” button. Let’s define the training function as follows:
|
1 2 3 4 5 6 7 8 9 10 11 12 13 14 15 16 17 18 19 20 21 22 23 24 25 26 27 28 29 |
... from tensorflow.keras.models import Sequential from tensorflow.keras.layers import Conv2D, Dense, AveragePooling2D, Flatten from tensorflow.keras.callbacks import EarlyStopping def train(): activation = model_data["activation"] model = Sequential([ Conv2D(6, (5, 5), activation=activation, input_shape=(28, 28, 1), padding="same"), AveragePooling2D((2, 2), strides=2), Conv2D(16, (5, 5), activation=activation), AveragePooling2D((2, 2), strides=2), Conv2D(120, (5, 5), activation=activation), Flatten(), Dense(84, activation=activation), Dense(10, activation="softmax") ]) model.compile(loss="categorical_crossentropy", optimizer=model_data["optimizer"], metrics=["accuracy"]) earlystop = EarlyStopping(monitor="val_loss", patience=3, restore_best_weights=True) history = model.fit( X_train, y_train, validation_data=(X_test, y_test), epochs=model_data["epochs"], batch_size=model_data["batchsize"], verbose=0, callbacks=[earlystop]) return model, history |
This function depends on an external dictionary model_data for the parameters and the dataset, such as X_train and y_train, defined outside of the function. It will just create a new model, train it, and return the model with the training history. We just need to run this function when the “Train” button on the browser is clicked. We set verbose=0 in the fit() function to ask the training process not to print anything to the screen since it is supposed to run in the server while the user is looking at the browser. The user cannot see the terminal output at the server anyway. We can also take one step further to display the history of loss and evaluation metrics along the training epochs. This is what we need to do:
|
1 2 3 4 5 6 7 8 9 10 11 12 13 14 15 16 17 18 19 20 21 22 23 24 25 26 27 28 29 30 31 32 33 34 35 36 37 |
... import pandas as pd import plotly.express as px from dash.dependencies import Input, Output, State ... app.layout = html.Div( id="parent", children=[ ... html.Button(id="train", n_clicks=0, children="Train"), dcc.Graph(id="historyplot"), ] ) ... @app.callback(Output("historyplot", "figure"), Input("train", "n_clicks"), State("activation", "value"), State("optimizer", "value"), State("epochs", "value"), State("batchsize", "value"), prevent_initial_call=True) def train_action(n_clicks, activation, optimizer, epoch, batchsize): model_data.update({ "activation": activation, "optimizer": optimizer, "epoch": epoch, "batchsize": batchsize, }) model, history = train() model_data["model"] = model # keep the trained model history = pd.DataFrame(history.history) fig = px.line(history, title="Model training metrics") fig.update_layout(xaxis_title="epochs", yaxis_title="metric value", legend_title="metrics") return fig |
We first add a Graph component to the web page to display our training metrics. The Graph component is not a standard HTML element but a Dash component. There are a number of such components provided by Dash as its major feature. Dash is a sister project of Plotly, another visualization library similar to Bokeh that renders interactive charts into HTML. The Graph component is to display a Plotly chart.
Then we defined a function train_action() and decorated it with our Dash application’s callback function. The function train_action() takes several inputs (model hyperparameters) and returns an output. In Dash, the output is usually a string, but we return a Plotly graph object here. The callback decorator requires us to specify the input and output. These are the web page components specified by their ID field and the property that served as the input or output. In this example, in addition to input and output, we also need some additional data called “states.”
In Dash, input is what triggers an action. In this example, a button in Dash will remember the number of times it has been pressed in the component’s property n_clicks. So we declared the change in this property as the trigger for this function. Similarly, when this function is returned, the graph object will replace the Graph component. The state parameters are provided as non-trigger arguments to this function. The order of specifying the output, input, and states is essential as this is what the callback decorator expects, as well as the order of arguments to the function we defined.
We are not going to explain the Plotly syntax in detail. If you learned what a visualization library like Bokeh does, it should not be very difficult to adapt your knowledge to Plotly after consulting its documentation.
However, there is one thing we need to mention about Dash callbacks: When the web page is first loaded, all callbacks will be invoked once because the components are newly created. Since all components’ properties changed from non-existence to some values, they are trigger events. If we do not want to have them invoked on the page load (e.g., in this case, we do not want our time-consuming training process to start until the user confirms the hyperparameters), we need to specify prevent_initial_call=True in the decorator.
We can go one step further by getting the hyperparameter selection interactive as well. This is polite because you give the user feedback on their action. As we already have a <div> element for the title of each selection component, we can make use of it for feedback by creating the following functions:
|
1 2 3 4 5 6 7 8 9 10 11 12 13 14 15 16 17 18 19 20 21 22 23 24 |
... @app.callback(Output(component_id="epochdisplay", component_property="children"), Input(component_id="epochs", component_property="value")) def update_epochs(value): return f"Epochs: {value}" @app.callback(Output("batchdisplay", "children"), Input("batchsize", "value")) def update_batchsize(value): return f"Batch size: {value}" @app.callback(Output("activationdisplay", "children"), Input("activation", "value")) def update_activation(value): return f"Activation: {value}" @app.callback(Output("optimizerdisplay", "children"), Input("optimizer", "value")) def update_optimizer(value): return f"Optimizer: {value}" |
These functions are trivial and return a string, which will become the “children” of the <div> elements. We also demonstrated the named arguments in the first function’s decorator in case you prefer to be more explicit.
Putting everything together, the following is the complete code that can control a model training from a web interface:
|
1 2 3 4 5 6 7 8 9 10 11 12 13 14 15 16 17 18 19 20 21 22 23 24 25 26 27 28 29 30 31 32 33 34 35 36 37 38 39 40 41 42 43 44 45 46 47 48 49 50 51 52 53 54 55 56 57 58 59 60 61 62 63 64 65 66 67 68 69 70 71 72 73 74 75 76 77 78 79 80 81 82 83 84 85 86 87 88 89 90 91 92 93 94 95 96 97 98 99 100 101 102 103 104 105 106 107 108 109 110 111 112 113 114 115 116 117 118 119 120 121 122 123 124 125 126 127 128 129 130 131 132 133 134 135 136 137 138 139 140 141 142 143 144 145 146 147 148 149 150 151 152 153 154 155 156 157 158 159 160 161 162 163 164 165 166 167 |
import numpy as np import pandas as pd from tensorflow.keras.datasets import mnist from tensorflow.keras.models import Sequential from tensorflow.keras.layers import Conv2D, Dense, AveragePooling2D, Flatten from tensorflow.keras.utils import to_categorical from tensorflow.keras.callbacks import EarlyStopping import plotly.express as px from dash import Dash, html, dcc from dash.dependencies import Input, Output, State from flask import Flask server = Flask("mlm") app = Dash(server=server) # Load MNIST digits (X_train, y_train), (X_test, y_test) = mnist.load_data() X_train = np.expand_dims(X_train, axis=3).astype("float32") X_test = np.expand_dims(X_test, axis=3).astype("float32") y_train = to_categorical(y_train) y_test = to_categorical(y_test) model_data = { "activation": "relu", "optimizer": "adam", "epochs": 100, "batchsize": 32, } def train(): activation = model_data["activation"] model = Sequential([ Conv2D(6, (5, 5), activation=activation, input_shape=(28, 28, 1), padding="same"), AveragePooling2D((2, 2), strides=2), Conv2D(16, (5, 5), activation=activation), AveragePooling2D((2, 2), strides=2), Conv2D(120, (5, 5), activation=activation), Flatten(), Dense(84, activation=activation), Dense(10, activation="softmax") ]) model.compile(loss="categorical_crossentropy", optimizer=model_data["optimizer"], metrics=["accuracy"]) earlystop = EarlyStopping(monitor="val_loss", patience=3, restore_best_weights=True) history = model.fit( X_train, y_train, validation_data=(X_test, y_test), epochs=model_data["epochs"], batch_size=model_data["batchsize"], verbose=0, callbacks=[earlystop]) return model, history app.layout = html.Div( id="parent", children=[ html.H1( children="LeNet5 training", style={"textAlign": "center"} ), html.Div( className="flex-container", children=[ html.Div(children=[ html.Div(id="activationdisplay"), dcc.Dropdown( id="activation", options=[ {"label": "Rectified linear unit", "value": "relu"}, {"label": "Hyperbolic tangent", "value": "tanh"}, {"label": "Sigmoidal", "value": "sigmoid"}, ], value=model_data["activation"] ) ]), html.Div(children=[ html.Div(id="optimizerdisplay"), dcc.Dropdown( id="optimizer", options=[ {"label": "Adam", "value": "adam"}, {"label": "Adagrad", "value": "adagrad"}, {"label": "Nadam", "value": "nadam"}, {"label": "Adadelta", "value": "adadelta"}, {"label": "Adamax", "value": "adamax"}, {"label": "RMSprop", "value": "rmsprop"}, {"label": "SGD", "value": "sgd"}, {"label": "FTRL", "value": "ftrl"}, ], value=model_data["optimizer"] ), ]), html.Div(children=[ html.Div(id="epochdisplay"), dcc.Slider(1, 200, 1, marks={1: "1", 100: "100", 200: "200"}, value=model_data["epochs"], id="epochs"), ]), html.Div(children=[ html.Div(id="batchdisplay"), dcc.Slider(1, 128, 1, marks={1: "1", 128: "128"}, value=model_data["batchsize"], id="batchsize"), ]), ] ), html.Button(id="train", n_clicks=0, children="Train"), dcc.Graph(id="historyplot"), ] ) @app.callback(Output(component_id="epochdisplay", component_property="children"), Input(component_id="epochs", component_property="value")) def update_epochs(value): model_data["epochs"] = value return f"Epochs: {value}" @app.callback(Output("batchdisplay", "children"), Input("batchsize", "value")) def update_batchsize(value): model_data["batchsize"] = value return f"Batch size: {value}" @app.callback(Output("activationdisplay", "children"), Input("activation", "value")) def update_activation(value): model_data["activation"] = value return f"Activation: {value}" @app.callback(Output("optimizerdisplay", "children"), Input("optimizer", "value")) def update_optimizer(value): model_data["optimizer"] = value return f"Optimizer: {value}" @app.callback(Output("historyplot", "figure"), Input("train", "n_clicks"), State("activation", "value"), State("optimizer", "value"), State("epochs", "value"), State("batchsize", "value"), prevent_initial_call=True) def train_action(n_clicks, activation, optimizer, epoch, batchsize): model_data.update({ "activation": activation, "optimizer": optimizer, "epcoh": epoch, "batchsize": batchsize, }) model, history = train() model_data["model"] = model # keep the trained model history = pd.DataFrame(history.history) fig = px.line(history, title="Model training metrics") fig.update_layout(xaxis_title="epochs", yaxis_title="metric value", legend_title="metrics") return fig # run server, with hot-reloading app.run_server(debug=True, threaded=True) |
The final line of the above code is to run the Dash application, just like we run our Flask app in the previous section. The debug=True argument to the run_server() function is for “hot-reloading,” which means to reload everything whenever Dash detects our script has been changed. It is convenient to see how it will work while editing our code on another window, as it doesn’t require us to terminate our Dash server and run it again. The threaded=True is to ask the Dash server to run in multithreads when serving multiple requests. It is generally not recommended for Python programs to run in multithread due to the issue of global interpreter locks. However, it is acceptable in the web server environment as mostly the server is waiting for I/O. If not multithread, the option would be to run in multiprocesses. We cannot run a server in a single thread in a single process because even if we serve only one user, the browser will launch multiple HTTP queries at the same time (e.g., request for the CSS file we created above while loading the web page).
Polling in Dash
If we run the above Dash application with a moderate number of epochs, it would take noticeable time to complete. We want to see it running rather than just having the chart updated after it is finished. There is a way to ask Dash to push updates to our browser, but that would require a plugin (e.g., dash_devices package can do this). But we can also ask the browser to pull for any updates. This design is called polling.
In the train() function we defined above, we set verbose=0 to skip the terminal output. But we still need to know the progress of the training process. In Keras, this can be done with a custom callback. We can define one as follows:
|
1 2 3 4 5 6 7 8 9 10 11 12 13 14 15 16 17 18 19 20 21 22 23 24 25 26 27 28 29 30 31 32 33 34 35 36 37 38 |
... from tensorflow.keras.callbacks import Callback train_status = { "running": False, "epoch": 0, "batch": 0, "batch metric": None, "last epoch": None, } class ProgressCallback(Callback): def on_train_begin(self, logs=None): train_status["running"] = True train_status["epoch"] = 0 def on_train_end(self, logs=None): train_status["running"] = False def on_epoch_begin(self, epoch, logs=None): train_status["epoch"] = epoch train_status["batch"] = 0 def on_epoch_end(self, epoch, logs=None): train_status["last epoch"] = logs def on_train_batch_begin(self, batch, logs=None): train_status["batch"] = batch def on_train_batch_end(self, batch, logs=None): train_status["batch metric"] = logs def train(): ... history = model.fit( X_train, y_train, validation_data=(X_test, y_test), epochs=model_data["epochs"], batch_size=model_data["batchsize"], verbose=0, callbacks=[earlystop, ProgressCallback()]) return model, history |
If we provide an instance of this class to the fit() function of a Keras model, the member function of this class will be invoked at the beginning or the end of the training cycle, or epoch, or a batch in one epoch. It is quite flexible on what we can do inside the function. At the end of an epoch or a batch, the logs arguments to the functions are a dictionary of the loss and validation metrics. Hence we defined a global dictionary object to remember the metrics.
Now given we can check the dictionary train_status any time to know the progress of our model training, we can modify our web page to display it:
|
1 2 3 4 5 6 7 8 9 10 11 12 13 14 15 16 17 18 19 20 21 |
... app.layout = html.Div( id="parent", children=[ ... html.Button(id="train", n_clicks=0, children="Train"), html.Pre(id="progressdisplay"), dcc.Interval(id="trainprogress", n_intervals=0, interval=1000), dcc.Graph(id="historyplot"), ] ) import json @app.callback(Output("progressdisplay", "children"), Input("trainprogress", "n_intervals")) def update_progress(n): return json.dumps(train_status, indent=4) |
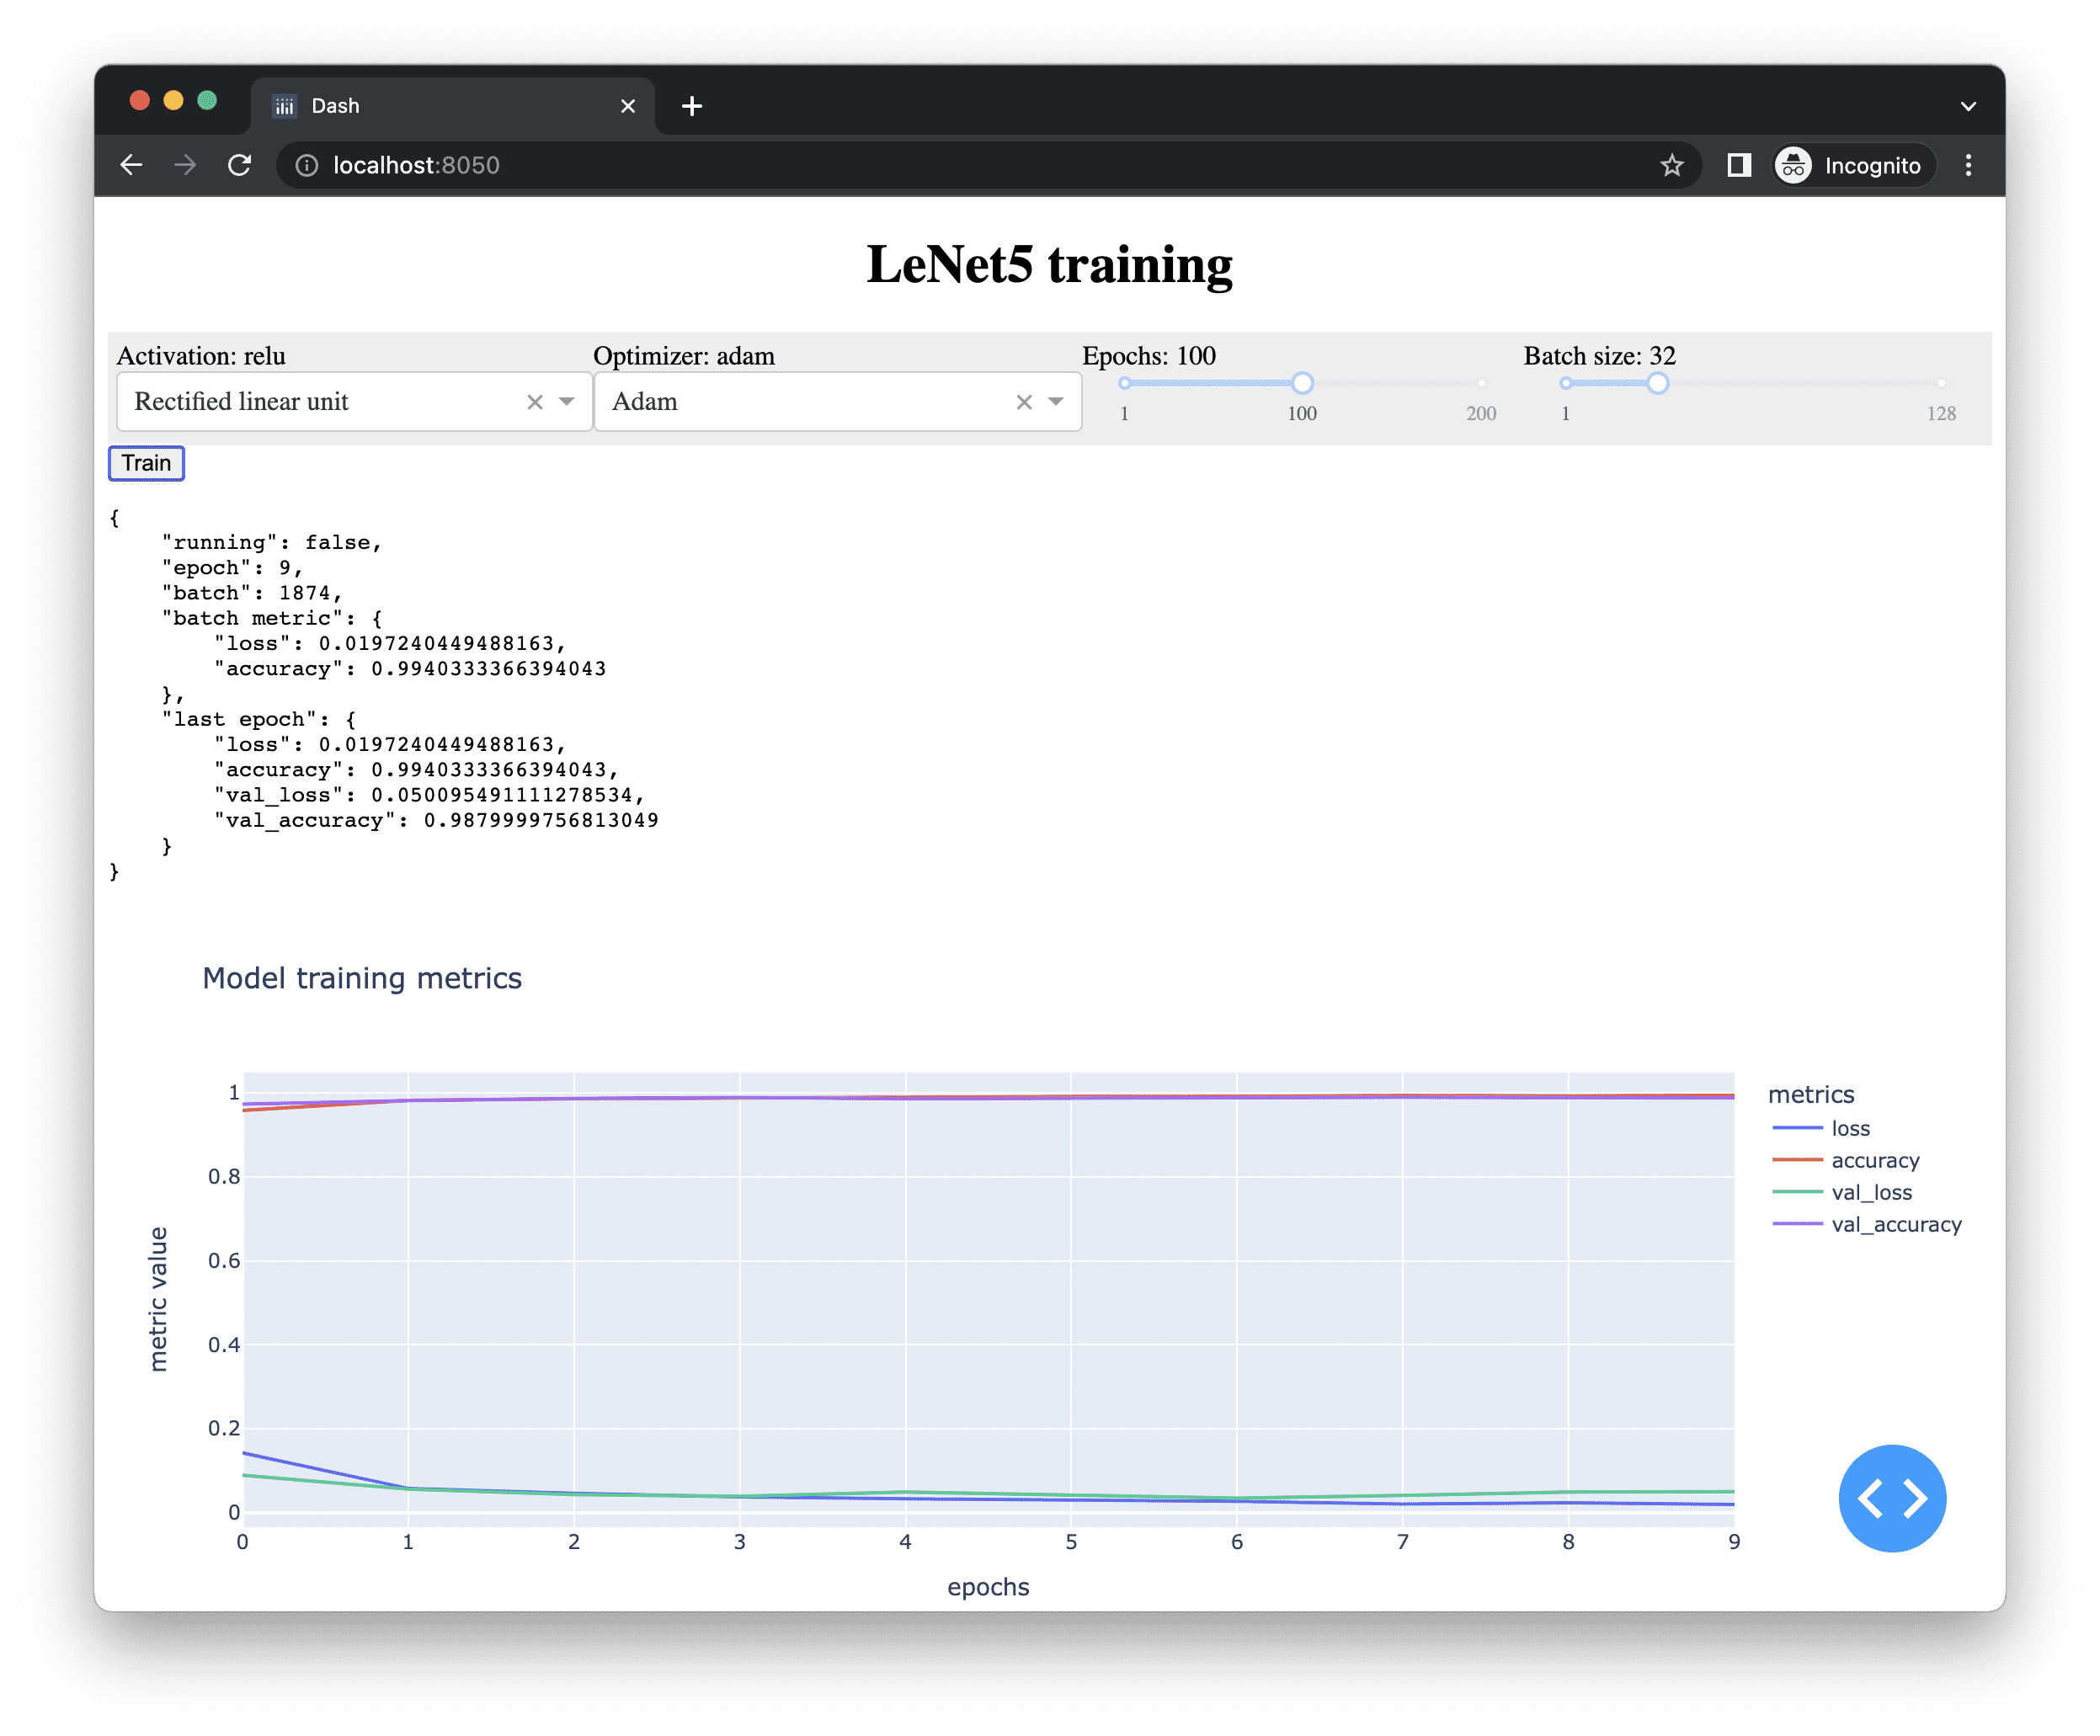
We create a non-visible component dcc.Interval() that changes its property n_intervals automatically once every 1000 milliseconds (= 1 second). Then we create a <pre> element below our “Train” button and name it progressdisplay. Whenever the Interval component fires, we convert the train_status dictionary into a JSON string and display it in that <pre> element. If you prefer, you can make a widget to display this information. Dash has a few provided.
With just these changes, your browser will look like the following when your model is trained:
Below is the complete code. Don’t forget you also need the assets/main.css file to properly render the web page:
|
1 2 3 4 5 6 7 8 9 10 11 12 13 14 15 16 17 18 19 20 21 22 23 24 25 26 27 28 29 30 31 32 33 34 35 36 37 38 39 40 41 42 43 44 45 46 47 48 49 50 51 52 53 54 55 56 57 58 59 60 61 62 63 64 65 66 67 68 69 70 71 72 73 74 75 76 77 78 79 80 81 82 83 84 85 86 87 88 89 90 91 92 93 94 95 96 97 98 99 100 101 102 103 104 105 106 107 108 109 110 111 112 113 114 115 116 117 118 119 120 121 122 123 124 125 126 127 128 129 130 131 132 133 134 135 136 137 138 139 140 141 142 143 144 145 146 147 148 149 150 151 152 153 154 155 156 157 158 159 160 161 162 163 164 165 166 167 168 169 170 171 172 173 174 175 176 177 178 179 180 181 182 183 184 185 186 187 188 189 190 191 192 193 194 195 196 197 198 199 |
import json import numpy as np import pandas as pd from tensorflow.keras.datasets import mnist from tensorflow.keras.models import Sequential from tensorflow.keras.layers import Conv2D, Dense, AveragePooling2D, Flatten from tensorflow.keras.utils import to_categorical from tensorflow.keras.callbacks import Callback, EarlyStopping import plotly.express as px from dash import Dash, html, dcc from dash.dependencies import Input, Output, State from flask import Flask server = Flask("mlm") app = Dash(server=server) # Load MNIST digits (X_train, y_train), (X_test, y_test) = mnist.load_data() X_train = np.expand_dims(X_train, axis=3).astype("float32") X_test = np.expand_dims(X_test, axis=3).astype("float32") y_train = to_categorical(y_train) y_test = to_categorical(y_test) model_data = { "activation": "relu", "optimizer": "adam", "epochs": 100, "batchsize": 32, } train_status = { "running": False, "epoch": 0, "batch": 0, "batch metric": None, "last epoch": None, } class ProgressCallback(Callback): def on_train_begin(self, logs=None): train_status["running"] = True train_status["epoch"] = 0 def on_train_end(self, logs=None): train_status["running"] = False def on_epoch_begin(self, epoch, logs=None): train_status["epoch"] = epoch train_status["batch"] = 0 def on_epoch_end(self, epoch, logs=None): train_status["last epoch"] = logs def on_train_batch_begin(self, batch, logs=None): train_status["batch"] = batch def on_train_batch_end(self, batch, logs=None): train_status["batch metric"] = logs def train(): activation = model_data["activation"] model = Sequential([ Conv2D(6, (5, 5), activation=activation, input_shape=(28, 28, 1), padding="same"), AveragePooling2D((2, 2), strides=2), Conv2D(16, (5, 5), activation=activation), AveragePooling2D((2, 2), strides=2), Conv2D(120, (5, 5), activation=activation), Flatten(), Dense(84, activation=activation), Dense(10, activation="softmax") ]) model.compile(loss="categorical_crossentropy", optimizer=model_data["optimizer"], metrics=["accuracy"]) earlystop = EarlyStopping(monitor="val_loss", patience=3, restore_best_weights=True) history = model.fit( X_train, y_train, validation_data=(X_test, y_test), epochs=model_data["epochs"], batch_size=model_data["batchsize"], verbose=0, callbacks=[earlystop, ProgressCallback()]) return model, history app.layout = html.Div( id="parent", children=[ html.H1( children="LeNet5 training", style={"textAlign": "center"} ), html.Div( className="flex-container", children=[ html.Div(children=[ html.Div(id="activationdisplay"), dcc.Dropdown( id="activation", options=[ {"label": "Rectified linear unit", "value": "relu"}, {"label": "Hyperbolic tangent", "value": "tanh"}, {"label": "Sigmoidal", "value": "sigmoid"}, ], value=model_data["activation"] ) ]), html.Div(children=[ html.Div(id="optimizerdisplay"), dcc.Dropdown( id="optimizer", options=[ {"label": "Adam", "value": "adam"}, {"label": "Adagrad", "value": "adagrad"}, {"label": "Nadam", "value": "nadam"}, {"label": "Adadelta", "value": "adadelta"}, {"label": "Adamax", "value": "adamax"}, {"label": "RMSprop", "value": "rmsprop"}, {"label": "SGD", "value": "sgd"}, {"label": "FTRL", "value": "ftrl"}, ], value=model_data["optimizer"] ), ]), html.Div(children=[ html.Div(id="epochdisplay"), dcc.Slider(1, 200, 1, marks={1: "1", 100: "100", 200: "200"}, value=model_data["epochs"], id="epochs"), ]), html.Div(children=[ html.Div(id="batchdisplay"), dcc.Slider(1, 128, 1, marks={1: "1", 128: "128"}, value=model_data["batchsize"], id="batchsize"), ]), ] ), html.Button(id="train", n_clicks=0, children="Train"), html.Pre(id="progressdisplay"), dcc.Interval(id="trainprogress", n_intervals=0, interval=1000), dcc.Graph(id="historyplot"), ] ) @app.callback(Output(component_id="epochdisplay", component_property="children"), Input(component_id="epochs", component_property="value")) def update_epochs(value): return f"Epochs: {value}" @app.callback(Output("batchdisplay", "children"), Input("batchsize", "value")) def update_batchsize(value): return f"Batch size: {value}" @app.callback(Output("activationdisplay", "children"), Input("activation", "value")) def update_activation(value): return f"Activation: {value}" @app.callback(Output("optimizerdisplay", "children"), Input("optimizer", "value")) def update_optimizer(value): return f"Optimizer: {value}" @app.callback(Output("historyplot", "figure"), Input("train", "n_clicks"), State("activation", "value"), State("optimizer", "value"), State("epochs", "value"), State("batchsize", "value"), prevent_initial_call=True) def train_action(n_clicks, activation, optimizer, epoch, batchsize): model_data.update({ "activation": activation, "optimizer": optimizer, "epoch": epoch, "batchsize": batchsize, }) model, history = train() model_data["model"] = model # keep the trained model history = pd.DataFrame(history.history) fig = px.line(history, title="Model training metrics") fig.update_layout(xaxis_title="epochs", yaxis_title="metric value", legend_title="metrics") return fig @app.callback(Output("progressdisplay", "children"), Input("trainprogress", "n_intervals")) def update_progress(n): return json.dumps(train_status, indent=4) # run server, with hot-reloading app.run_server(debug=True, threaded=True) |
Combining Flask and Dash
Can you also provide a web interface to use the trained model? Certainly. It will be easier if the model takes a few numerical inputs because we can just provide an input box element on the page. In this case, since it is a handwritten digit recognition model, we need to have a way to provide an image on the browser and pass it on to the model at the server. Only then can we get the result and display it. There are two options we can do this: We can let the user upload an image of a digit for our model to recognize it, or we can let the user draw the image directly on the browser.
In HTML5, we have a <canvas> element that allows us to draw or display pixels in an area on the web page. We can make use of this to let the user draw on it, then convert it into a numerical matrix of size 28×28, and send it to the server side for the model to predict and display the prediction result.
Doing this would not be Dash’s job because we want to read the <canvas> element and convert it to a matrix of the correct format. We will do this in Javascript. But after that, we would invoke the model in a web URL like what we described at the beginning of this post. A query is sent with the parameter, and the response from the server would be the digit that our model recognized.
Behind the scene, Dash uses Flask, and the root URL points to the Dash application. We can create a Flask endpoint that makes use of the model as follows:
|
1 2 3 4 5 6 7 8 9 10 |
... @server.route("/recognize", methods=["POST"]) def recognize(): if not model_data.get("model"): return "Please train your model." matrix = json.loads(request.form["matrix"]) matrix = np.asarray(matrix).reshape(1, 28, 28) proba = model_data["model"].predict(matrix).reshape(-1) result = np.argmax(proba) return "Digit "+str(result) |
As we can recall, the variable server is the Flask server upon which we build our Dash application. We create an endpoint with its decorator. Since we are going to pass a 28×28 matrix as the parameter, we use the HTTP POST method, which is more suitable for a large block of data. The data provided by the POST method will not be part of the URL. Hence we do not set up a path parameter to the @server.route() decorator. Instead, we read the data with request.form["matrix"] in which "matrix" is the name of the parameter we passed in. Then we convert the string into a list of numbers by assuming it is in JSON format, and then further convert it into a NumPy array and give it to the model to predict the digit. We kept our trained model in model_data["model"], but we can make the above code more robust by checking if this trained model exists and returning an error message if it does not.
To modify the web page, we just add a few more components:
|
1 2 3 4 5 6 7 8 9 10 11 12 13 14 15 16 17 18 19 20 21 22 |
app.layout = html.Div( id="parent", children=[ ... dcc.Graph(id="historyplot"), html.Div( className="flex-container", id="predict", children=[ html.Div( children=html.Canvas(id="writing"), style={"textAlign": "center"} ), html.Div(id="predictresult", children="?"), html.Pre( id="lastinput", ), ] ), html.Div(id="dummy", style={"display": "none"}), ] ) |
The bottom one is a hidden <div> element that we will use later. The main block is another <div> element with three items in it, namely, a <canvas> element (with ID "writing"), a <div> element (with ID "predictresult") to display the result, and a <pre> element (with ID "lastinput") to display the matrix that we passed to the server.
Since these elements are not handled by Dash, we do not need to create any more functions in Python. But instead, we need to create a Javascript file assets/main.js for the interaction with these components. A Dash application will automatically load everything under the directory assets and send it to the user when the web page is loaded. We can write this in plain Javascript, but to make our code more concise, we will use jQuery. Hence we need to tell Dash that we will require jQuery in this web application:
|
1 2 3 4 5 |
... app = Dash(server=server, external_scripts=[ "https://code.jquery.com/jquery-3.6.0.min.js" ]) |
The external_scripts argument is a list of URLs to be loaded as additional scripts before the web page is loaded. Hence we usually provide the library here but keep our own code away.
Our own Javascript code would be a single function because it is called after our web page is fully loaded:
|
1 2 3 4 5 6 7 8 9 10 11 |
function pageinit() { // Set up canvas object var canvas = document.getElementById("writing"); canvas.width = parseInt($("#writing").css("width")); canvas.height = parseInt($("#writing").css("height")); var context = canvas.getContext("2d"); // to remember drawing context.strokeStyle = "#FF0000"; // draw in bright red context.lineWidth = canvas.width / 15; // thickness adaptive to canvas size ... }; |
We first set up our <canvas> element in Javascript. These are specific to our requirement. Firstly, we added the following into our assets/main.css:
|
1 2 3 4 5 6 7 8 |
canvas#writing { width: 300px; height: 300px; margin: auto; padding: 10px; border: 3px solid #7f7f7f; background-color: #FFFFFF; } |
This fixed the width and height to 300 pixels to make our canvas square, along with other cosmetic fine tuning. Since ultimately, we would convert our handwriting into a 28×28 pixel image to fit what our model expects, every stroke we write on the canvas cannot be too thin. Therefore we set the stoke width relative to the canvas size.
Having this is not enough to make our canvas usable. Let’s assume we never use it on mobile devices but only on a desktop browser, the drawing is done by mouse click and movements. We need to define what a mouse click does on the canvas. Hence we added the following functions to Javascript code:
|
1 2 3 4 5 6 7 8 9 10 11 12 13 14 15 16 17 18 19 20 21 22 23 24 25 26 27 28 29 30 31 32 33 34 35 36 37 38 39 40 41 42 43 44 45 46 47 48 49 50 51 52 53 54 55 56 |
function pageinit() { ... // Canvas reset by timeout var timeout = null; // holding the timeout event var reset = function() { // clear the canvas context.clearRect(0, 0, canvas.width, canvas.height); } // Set up drawing with mouse var mouse = {x:0, y:0}; // to remember the coordinate w.r.t. canvas var onPaint = function() { clearTimeout(timeout); // event handler for mouse move in canvas context.lineTo(mouse.x, mouse.y); context.stroke(); }; // HTML5 Canvas mouse event - in case of desktop browser canvas.addEventListener("mousedown", function(e) { clearTimeout(timeout); // mouse down, begin path at current mouse position context.moveTo(mouse.x, mouse.y); context.beginPath(); // all mouse move from now on should be painted canvas.addEventListener("mousemove", onPaint, false); }, false); canvas.addEventListener("mousemove", function(e) { // mouse move remember position w.r.t. canvas mouse.x = e.pageX - this.offsetLeft; mouse.y = e.pageY - this.offsetTop; }, false); canvas.addEventListener("mouseup", function(e) { clearTimeout(timeout); // all mouse move from now on should NOT be painted canvas.removeEventListener("mousemove", onPaint, false); // read drawing into image var img = new Image(); // on load, this will be the canvas in same WxH img.onload = function() { // Draw the 28x28 to top left corner of canvas context.drawImage(img, 0, 0, 28, 28); // Extract data: Each pixel becomes a RGBA value, hence 4 bytes each var data = context.getImageData(0, 0, 28, 28).data; var input = []; for (var i=0; i<data.length; i += 4) { // scan each pixel, extract first byte (R component) input.push(data[i]); }; // TODO: use "input" for prediction }; img.src = canvas.toDataURL("image/png"); timeout = setTimeout(reset, 5000); // clear canvas after 5 sec }, false); }; |
This is a bit verbose but essentially we ask to listen on three mouse events on the canvas, namely, press down the mouse button, moving the mouse, and release the mouse button. These three events combined is how we draw one stroke on the canvas.
Firstly, the mousemove event handler we added to the <canvas> element is to simply remember the current mouse position in the Javascript object mouse.
Then in the mousedown event handler, we start our drawing context at the latest mouse position. And since the drawing is started, all subsequent mouse move should be painted on the canvas. We defined the onPaint function to extend a line segment on the canvas to the current mouse position. This function is now registered as an additional event handler to the mousemove event.
Finally, the mouseup event handler is to handle the case when user finished one stroke and released the mouse button. All subsequent mouse movement should not be painted on the canvas so we need to remove the event handler of the onPaint function. Then, as we finished one stroke, this may be a finished digit so we want to extract it into a 28×28 pixel version. This can be done easily. We simply create a new Image object in Javascript and load our entire canvas into it. When this is finished, Javascript will automatically invoke the onload function associated with it. In which, we will transform this Image object into 28×28 pixel and draw into the top left corner of our context object. Then we read it back pixel by pixel (each will be the RGB values of 0 to 255 per channel, but since we paint in red, we concern only the red channel) into the Javascript array input. We just need to give this input array to our model and the prediction can be carryed out.
We do not want to create any additional buttons to clear our canvas or submit our digit for recognition. Hence we want to clear our canvas automatically if the user has not draw anything new for 5 seconds. This is achieved with the Javascript function setTimeout() and clearTimeout(). We make a reset function to clear the canvas which will be fired at 5 seconds after the mouseup event. And this scheduled call to the reset function will be cancelled whenever a drawing event happens before the timeout. Similarly, the recognition is automatic whenever a mouseup event happens.
Given we have the input data in 28×28 pixels transformed into a Javascript array, we can just make use of the recognize end point we created with Flask. It would be helpful if we can see what we passed into recognize and what it returns. So we display the input in the <pre> element with ID lastinput, and display the result returned by the recognize end point in the <div> element with ID predictresult. This can be done easily by extending a bit on the mouseup event handler:
|
1 2 3 4 5 6 7 8 9 10 11 12 13 14 15 16 17 18 19 20 21 22 23 24 25 26 27 28 29 30 31 32 33 |
function pageinit() { canvas.addEventListener("mouseup", function(e) { ... img.onload = function() { ... var input = []; for (var i=0; i<data.length; i += 4) { // scan each pixel, extract first byte (R component) input.push(data[i]); }; var matrix = []; for (var i=0; i<input.length; i+=28) { matrix.push(input.slice(i, i+28).toString()); }; $("#lastinput").html("[[" + matrix.join("],<br/>[") + "]]"); // call predict function with the matrix predict(input); }; img.src = canvas.toDataURL("image/png"); setTimeout(reset, 5000); // clear canvas after 5 sec }, false); function predict(input) { $.ajax({ type: "POST", url: "/recognize", data: {"matrix": JSON.stringify(input)}, success: function(result) { $("#predictresult").html(result); } }); }; }; |
We defined a new Javascript funuction predict() that fires a AJAX call to the recognize end point that we set up with Flask. It is using POST method with the data matrix assigned with a JSON version of the Javascript array. We cannot pass an array directly on a HTTP request because everything have to be serialized. When the AJAX call returns, we update our <div> element with the result.
This predict() function is invoked by the mouseup event handler, when we finished transforming our 28×28 pixel image into numerical array. At the same time, we write a version into the <pre> element solely for display purpose.
Up to here, our application is finished. But we still need to call the pageinit() function when our Dash application is loaded. Behind the scene, Dash application is using React for the web for delayed rendering, therefore we should not hook our pageinit() function to the document.onload event handler or we will find that the components we are looking for does not exists. The correct way to call a Javascript function only when Dash application is fully loaded is to set up a client callback, which means it is a callback but handled by the browser-side Javascript rather than on the server-side Python. We add the following function call to our Python program, server.py:
|
1 2 3 4 5 6 |
... app.clientside_callback( "pageinit", Output("dummy", "children"), Input("dummy", "children") ) |
The clientside_callback() function is not used as a decorator but a complete function call. It takes the Javascript function as the first argument, and the Output and Input object as the second and third argument like the case of callback decorators. Because of this, we created a hidden dummy component in our web page layout just to help triggering the Javascript function at page load, all Dash callback would be invoked once unless prevent_initial_call=True is an argument to the callback.
Here we are all set. We can now run our server.py script to start our web server, and it will load the two files under the assets/ directory. Opening a browser to visit the URL reported by our Dash application, we can change the hyperparameter and train the model, then use the model for prediction.
Tying everything together, the below is the complete code on our Javascript part, saved as assets/main.js:
|
1 2 3 4 5 6 7 8 9 10 11 12 13 14 15 16 17 18 19 20 21 22 23 24 25 26 27 28 29 30 31 32 33 34 35 36 37 38 39 40 41 42 43 44 45 46 47 48 49 50 51 52 53 54 55 56 57 58 59 60 61 62 63 64 65 66 67 68 69 70 71 72 73 74 75 76 77 78 |
function pageinit() { // Set up canvas object var canvas = document.getElementById("writing"); canvas.width = parseInt($("#writing").css("width")); canvas.height = parseInt($("#writing").css("height")); var context = canvas.getContext("2d"); // to remember drawing context.strokeStyle = "#FF0000"; // draw in bright red context.lineWidth = canvas.width / 15; // thickness adaptive to canvas size // Canvas reset by timeout var timeout = null; // holding the timeout event var reset = function() { // clear the canvas context.clearRect(0, 0, canvas.width, canvas.height); } // Set up drawing with mouse var mouse = {x:0, y:0}; // to remember the coordinate w.r.t. canvas var onPaint = function() { clearTimeout(timeout); // event handler for mousemove in canvas context.lineTo(mouse.x, mouse.y); context.stroke(); }; // HTML5 Canvas mouse event - in case of desktop browser canvas.addEventListener("mousedown", function(e) { clearTimeout(timeout); // mousedown, begin path at mouse position context.moveTo(mouse.x, mouse.y); context.beginPath(); // all mousemove from now on should be painted canvas.addEventListener("mousemove", onPaint, false); }, false); canvas.addEventListener("mousemove", function(e) { // mousemove remember position w.r.t. canvas mouse.x = e.pageX - this.offsetLeft; mouse.y = e.pageY - this.offsetTop; }, false); canvas.addEventListener("mouseup", function(e) { clearTimeout(timeout); // all mousemove from now on should NOT be painted canvas.removeEventListener("mousemove", onPaint, false); // read drawing into image var img = new Image(); // on load, this will be the canvas in same WxH img.onload = function() { // Draw the 28x28 to top left corner of canvas context.drawImage(img, 0, 0, 28, 28); // Extract data: Each pixel becomes a RGBA value, hence 4 bytes each var data = context.getImageData(0, 0, 28, 28).data; var input = []; for (var i=0; i<data.length; i += 4) { // scan each pixel, extract first byte (R component) input.push(data[i]); }; var matrix = []; for (var i=0; i<input.length; i+=28) { matrix.push(input.slice(i, i+28).toString()); }; $("#lastinput").html("[[" + matrix.join("],\n[") + "]]"); // call predict function with the matrix predict(input); }; img.src = canvas.toDataURL("image/png"); timeout = setTimeout(reset, 5000); // clear canvas after 5 sec }, false); function predict(input) { $.ajax({ type: "POST", url: "/recognize", data: {"matrix": JSON.stringify(input)}, success: function(result) { $("#predictresult").html(result); } }); }; }; |
and the following are the complete code for the CSS, assets/main.css (the pre#lastinput part is to use smaller font to display our input matrix):
|
1 2 3 4 5 6 7 8 9 10 11 12 13 14 15 16 17 18 19 20 21 22 23 |
.flex-container { display: flex; padding: 5px; flex-wrap: nowrap; background-color: #EEEEEE; } .flex-container > * { flex-grow: 1 } canvas#writing { width: 300px; height: 300px; margin: auto; padding: 10px; border: 3px solid #7f7f7f; background-color: #FFFFFF; } pre#lastinput { font-size: 50%; } |
and the following is the main Python program, server.py:
|
1 2 3 4 5 6 7 8 9 10 11 12 13 14 15 16 17 18 19 20 21 22 23 24 25 26 27 28 29 30 31 32 33 34 35 36 37 38 39 40 41 42 43 44 45 46 47 48 49 50 51 52 53 54 55 56 57 58 59 60 61 62 63 64 65 66 67 68 69 70 71 72 73 74 75 76 77 78 79 80 81 82 83 84 85 86 87 88 89 90 91 92 93 94 95 96 97 98 99 100 101 102 103 104 105 106 107 108 109 110 111 112 113 114 115 116 117 118 119 120 121 122 123 124 125 126 127 128 129 130 131 132 133 134 135 136 137 138 139 140 141 142 143 144 145 146 147 148 149 150 151 152 153 154 155 156 157 158 159 160 161 162 163 164 165 166 167 168 169 170 171 172 173 174 175 176 177 178 179 180 181 182 183 184 185 186 187 188 189 190 191 192 193 194 195 196 197 198 199 200 201 202 203 204 205 206 207 208 209 210 211 212 213 214 215 216 217 218 219 220 221 222 223 224 225 226 227 228 229 230 231 232 233 234 235 236 237 238 239 |
import json import numpy as np import pandas as pd from tensorflow.keras.datasets import mnist from tensorflow.keras.models import Sequential, load_model from tensorflow.keras.layers import Conv2D, Dense, AveragePooling2D, Flatten from tensorflow.keras.utils import to_categorical from tensorflow.keras.callbacks import Callback, EarlyStopping import plotly.express as px from dash import Dash, html, dcc from dash.dependencies import Input, Output, State from flask import Flask, request server = Flask("mlm") app = Dash(server=server, external_scripts=[ "https://code.jquery.com/jquery-3.6.0.min.js" ]) # Load MNIST digits (X_train, y_train), (X_test, y_test) = mnist.load_data() X_train = np.expand_dims(X_train, axis=3).astype("float32") X_test = np.expand_dims(X_test, axis=3).astype("float32") y_train = to_categorical(y_train) y_test = to_categorical(y_test) model_data = { "activation": "relu", "optimizer": "adam", "epochs": 100, "batchsize": 32, "model": load_model("lenet5.h5"), } train_status = { "running": False, "epoch": 0, "batch": 0, "batch metric": None, "last epoch": None, } class ProgressCallback(Callback): def on_train_begin(self, logs=None): train_status["running"] = True train_status["epoch"] = 0 def on_train_end(self, logs=None): train_status["running"] = False def on_epoch_begin(self, epoch, logs=None): train_status["epoch"] = epoch train_status["batch"] = 0 def on_epoch_end(self, epoch, logs=None): train_status["last epoch"] = logs def on_train_batch_begin(self, batch, logs=None): train_status["batch"] = batch def on_train_batch_end(self, batch, logs=None): train_status["batch metric"] = logs def train(): activation = model_data["activation"] model = Sequential([ Conv2D(6, (5, 5), activation=activation, input_shape=(28, 28, 1), padding="same"), AveragePooling2D((2, 2), strides=2), Conv2D(16, (5, 5), activation=activation), AveragePooling2D((2, 2), strides=2), Conv2D(120, (5, 5), activation=activation), Flatten(), Dense(84, activation=activation), Dense(10, activation="softmax") ]) model.compile(loss="categorical_crossentropy", optimizer=model_data["optimizer"], metrics=["accuracy"]) earlystop = EarlyStopping(monitor="val_loss", patience=3, restore_best_weights=True) history = model.fit( X_train, y_train, validation_data=(X_test, y_test), epochs=model_data["epochs"], batch_size=model_data["batchsize"], verbose=0, callbacks=[earlystop, ProgressCallback()]) return model, history app.layout = html.Div( id="parent", children=[ html.H1( children="LeNet5 training", style={"textAlign": "center"} ), html.Div( className="flex-container", children=[ html.Div(children=[ html.Div(id="activationdisplay"), dcc.Dropdown( id="activation", options=[ {"label": "Rectified linear unit", "value": "relu"}, {"label": "Hyperbolic tangent", "value": "tanh"}, {"label": "Sigmoidal", "value": "sigmoid"}, ], value=model_data["activation"] ) ]), html.Div(children=[ html.Div(id="optimizerdisplay"), dcc.Dropdown( id="optimizer", options=[ {"label": "Adam", "value": "adam"}, {"label": "Adagrad", "value": "adagrad"}, {"label": "Nadam", "value": "nadam"}, {"label": "Adadelta", "value": "adadelta"}, {"label": "Adamax", "value": "adamax"}, {"label": "RMSprop", "value": "rmsprop"}, {"label": "SGD", "value": "sgd"}, {"label": "FTRL", "value": "ftrl"}, ], value=model_data["optimizer"] ), ]), html.Div(children=[ html.Div(id="epochdisplay"), dcc.Slider(1, 200, 1, marks={1: "1", 100: "100", 200: "200"}, value=model_data["epochs"], id="epochs"), ]), html.Div(children=[ html.Div(id="batchdisplay"), dcc.Slider(1, 128, 1, marks={1: "1", 128: "128"}, value=model_data["batchsize"], id="batchsize"), ]), ] ), html.Button(id="train", n_clicks=0, children="Train"), html.Pre(id="progressdisplay"), dcc.Interval(id="trainprogress", n_intervals=0, interval=1000), dcc.Graph(id="historyplot"), html.Div( className="flex-container", id="predict", children=[ html.Div( children=html.Canvas(id="writing"), style={"textAlign": "center"} ), html.Div(id="predictresult", children="?"), html.Pre( id="lastinput", ), ] ), html.Div(id="dummy", style={"display": "none"}), ] ) @app.callback(Output(component_id="epochdisplay", component_property="children"), Input(component_id="epochs", component_property="value")) def update_epochs(value): model_data["epochs"] = value return f"Epochs: {value}" @app.callback(Output("batchdisplay", "children"), Input("batchsize", "value")) def update_batchsize(value): model_data["batchsize"] = value return f"Batch size: {value}" @app.callback(Output("activationdisplay", "children"), Input("activation", "value")) def update_activation(value): model_data["activation"] = value return f"Activation: {value}" @app.callback(Output("optimizerdisplay", "children"), Input("optimizer", "value")) def update_optimizer(value): model_data["optimizer"] = value return f"Optimizer: {value}" @app.callback(Output("historyplot", "figure"), Input("train", "n_clicks"), State("activation", "value"), State("optimizer", "value"), State("epochs", "value"), State("batchsize", "value"), prevent_initial_call=True) def train_action(n_clicks, activation, optimizer, epoch, batchsize): model_data.update({ "activation": activation, "optimizer": optimizer, "epoch": epoch, "batchsize": batchsize, }) model, history = train() model_data["model"] = model # keep the trained model history = pd.DataFrame(history.history) fig = px.line(history, title="Model training metrics") fig.update_layout(xaxis_title="epochs", yaxis_title="metric value", legend_title="metrics") return fig @app.callback(Output("progressdisplay", "children"), Input("trainprogress", "n_intervals")) def update_progress(n): return json.dumps(train_status, indent=4) app.clientside_callback( "function() { pageinit(); };", Output("dummy", "children"), Input("dummy", "children") ) @server.route("/recognize", methods=["POST"]) def recognize(): if not model_data.get("model"): return "Please train your model." matrix = json.loads(request.form["matrix"]) matrix = np.asarray(matrix).reshape(1, 28, 28) proba = model_data["model"].predict(matrix).reshape(-1) result = np.argmax(proba) return "Digit "+str(result) # run server, with hot-reloading app.run_server(debug=True, threaded=True) |
If we run all of these, we should see a screen like the following: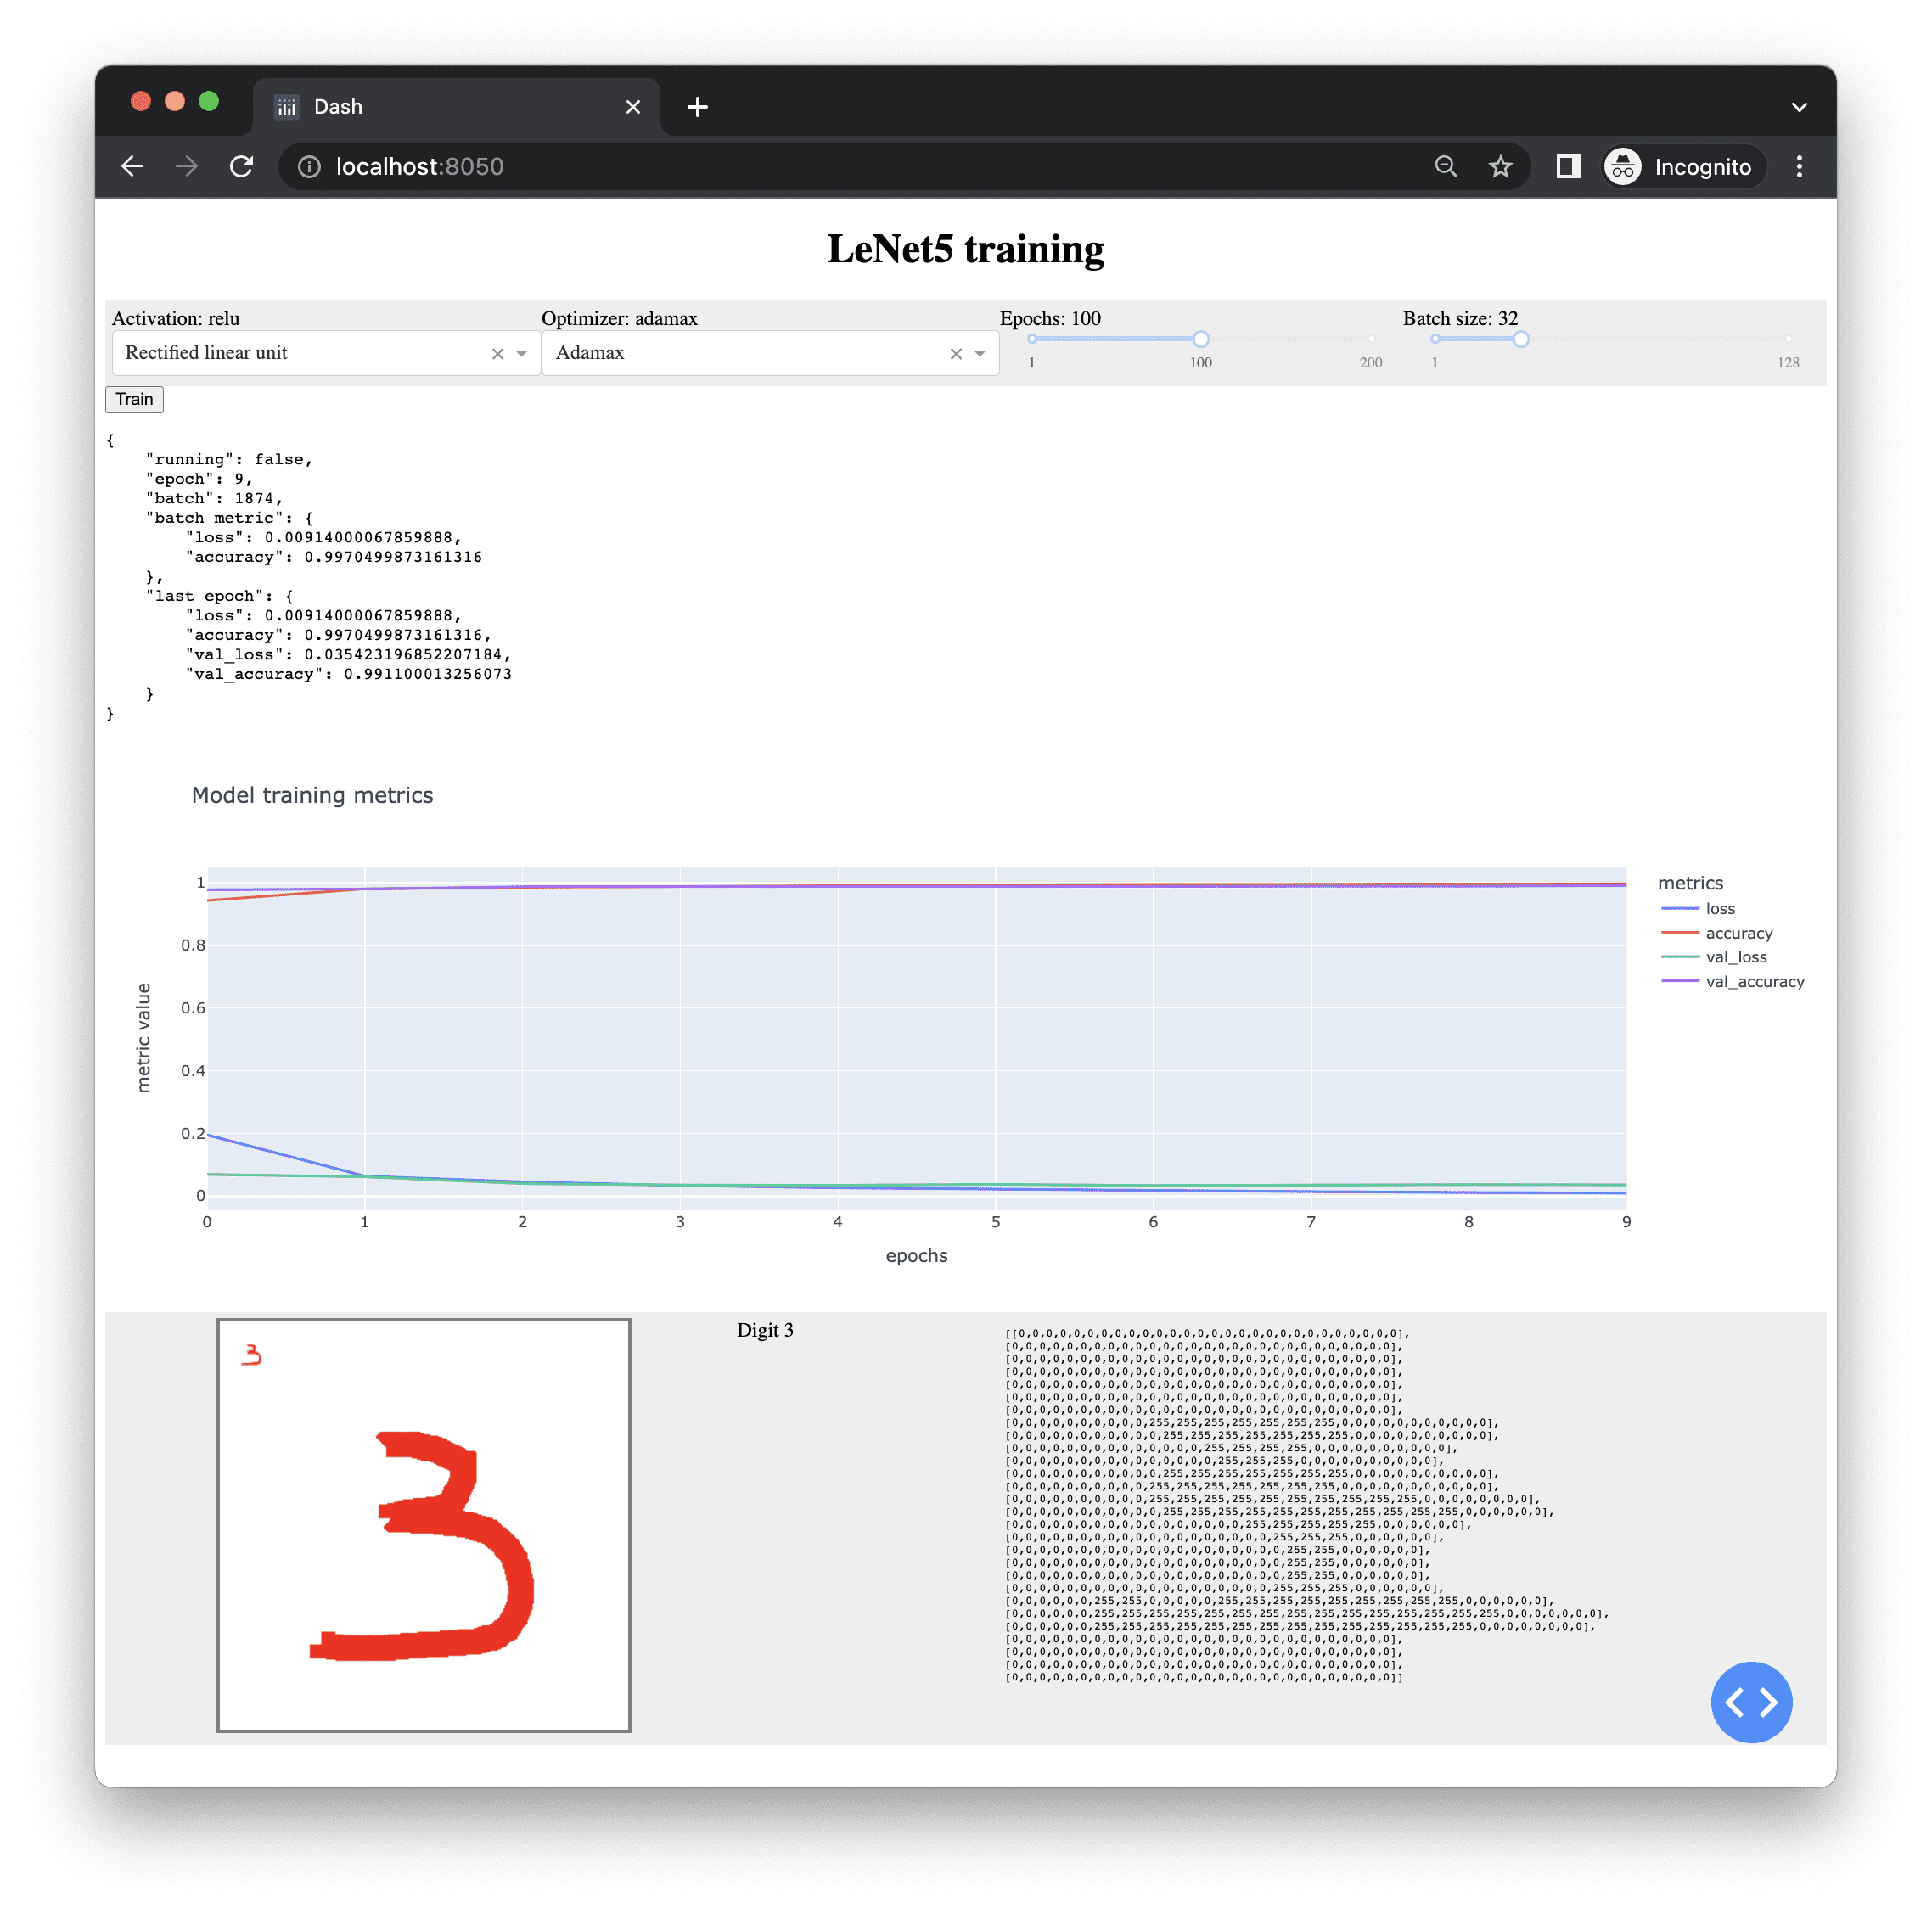
Further Reading
There are a vast amount of web framework available and Flask is just one of them. Another popular one is CherryPy. Below are resources on the topic if you are looking to go deeper.
Books
- Python Dash: Build Stunning Data Analysis and Visualization Apps with Plotly by Adam Schroeder, Christian Mayer, and Ann Marie Ward
- Interactive Dashboards and Data Apps with Plotly and Dash by Elias Dabbas
- Flask Web Development, 2nd Edition, by Miguel Grinberg
- Flask Framework Cookbook, 2nd Edition, by Shalabh Aggarwal
Articles
- Web Frameworks, Python.org wiki
APIs and software
- CherryPy
- Django
- Flask
- Dash
- Plotly
- MDN Javascript
- MDN Canvas API
- jQuery
Summary
In this tutorial, you learned how we can build a web app easily in Python with the Dash library. You also learned how we can create some web API using Flask. Specifically you learned
- The mechanism of a web application
- How we can use Dash to build a simple web application triggered by web page components
- How can we use Flask to create a web API
- How a web application can be built in Javascript and run on a browser that uses the web API we built with Flask
Get a Handle on Python for Machine Learning!

Be More Confident to Code in Python
...from learning the practical Python tricks
Discover how in my new Ebook:
Python for Machine Learning
It provides self-study tutorials with hundreds of working code to equip you with skills including:
debugging, profiling, duck typing, decorators, deployment,
and much more...


Amazing post, Adrian! Love the client-side callback, and the interval as well. Keep up the good work, team!
Hey, Adrian
The final result is indeed amazing. But the complexity of the solution is significant!!! So many things to learn, falling outside the typical data scientists/analyst day to day knowledge
Dash/Plotly is a famous combo – but they seem “too powerful” – like the parallel you drew with Django as a web framework.
So, in this analogy, the “Flask” version (simpler, lightweight implementation) would be Streamlit.
I have used it in the past and it abstracts away all the underlying HTML tags/concepts. Very easy to use and feature rich – with beautiful style and useful components out of the box.
The layout is vertical by default – but it was in their roadmap to allow more flexible/customization.
Great content! Would be nice to see an implementation comparison between this solution: dash vs Streamlit.
Cheers!
Thanks Adrian! Very informative.
I’ve only had to change imports of html and dcc but still getting error:
Traceback (most recent call last):
File “~~~path~~~.server.py”, line 133, in
dcc.Slider(1, 200, 1, marks={1: “1”, 100: “100”, 200: “200”},
File “~~~root~~~\Anaconda3\lib\site-packages\dash\development\base_component.py”, line 366, in wrapper
return func(*args, **kwargs)
TypeError: __init__() got multiple values for argument ‘marks’
and if comment out these dcc.Sliders, (127.0.0.1:port) keeps constant updating page without any output aka Blank page