In all programming exercises, it is difficult to go far and deep without a handy debugger. The built-in debugger, pdb, in Python is a mature and capable one that can help us a lot if you know how to use it. In this tutorial, we are going to see what the pdb can do for you as well as some of its alternatives.
In this tutorial, you will learn:
What a debugger can do
How to control a debugger
The limitation of Python’s pdb and its alternatives
Kick-start your project with my new book Python for Machine Learning, including step-by-step tutorials and the Python source code files for all examples.
Let’s get started.
Python debugging tools Photo by Thomas Park. Some rights reserved.
Tutorial Overview
This tutorial is in 4 parts; they are
The concept of running a debugger
Walk-through of using a debugger
Debugger in Visual Studio Code
Using GDB on a running Python program
The concept of running a debugger
The purpose of a debugger is to provide you with a slow-motion button to control the flow of a program. It also allows you to freeze the program at a certain time and examine the state.
The simplest operation under a debugger is to step through the code. That is to run one line of code at a time and wait for your acknowledgment before proceeding to the next. The reason we want to run the program in a stop-and-go fashion is to allow us to check the logic and value or verify the algorithm.
For a larger program, we may not want to step through the code from the beginning as it may take a long time before we reach the line that we are interested in. Therefore, debuggers also provide a breakpoint feature that will kick in when a specific line of code is reached. From that point onward, we can step through it line by line.
Walk-through of using a debugger
Let’s see how we can make use of a debugger with an example. The following is the Python code for showing the particle swarm optimization in an animation:
print("PSO found best solution at f({})={}".format(gbest,gbest_obj))
print("Global optimal at f({})={}".format([x_min,y_min],f(x_min,y_min)))
The particle swarm optimization is done by executing the update() function a number of times. Each time it runs, we are closer to the optimal solution to the objective function. We are using matplotlib’s FuncAnimation() function instead of a loop to run update(), so we can capture the position of the particles at each iteration.
Assume this program is saved as pso.py. To run this program in the command line simply requires entering:
1
python pso.py
The solution will be printed to the screen, and the animation will be saved as PSO.gif. But if we want to run it with the Python debugger, we enter the following in the command line:
1
python -m pdb pso.py
The -m pdb part will load the pdb module and let the module execute the file pso.py for you. When you run this command, you will be welcomed with the pdb prompt as follows:
1
2
3
> /Users/mlm/pso.py(1)<module>()
-> import numpy as np
(Pdb)
At the prompt, you can type in the debugger commands. To show the list of supported commands, we can use h. And to show the details of the specific command (such as list), we can use h list:
1
2
3
4
5
6
7
8
9
10
11
12
13
14
15
16
17
18
19
> /Users/mlm/pso.py(1)<module>()
-> import numpy as np
(Pdb) h
Documented commands (type help <topic>):
========================================
EOF c d h list q rv undisplay
a cl debug help ll quit s unt
alias clear disable ignore longlist r source until
args commands display interact n restart step up
b condition down j next return tbreak w
break cont enable jump p retval u whatis
bt continue exit l pp run unalias where
Miscellaneous help topics:
==========================
exec pdb
(Pdb)
At the beginning of a debugger session, we start with the first line of the program. Normally, a Python program would start with a few lines of import. We can use n to move to the next line or s to step into a function:
1
2
3
4
5
6
7
8
9
10
11
12
13
14
15
16
17
18
19
20
21
22
23
24
25
26
27
28
29
30
31
32
> /Users/mlm/pso.py(1)<module>()
-> import numpy as np
(Pdb) n
> /Users/mlm/pso.py(2)<module>()
-> import matplotlib.pyplot as plt
(Pdb) n
> /Users/mlm/pso.py(3)<module>()
-> from matplotlib.animation import FuncAnimation
(Pdb) n
> /Users/mlm/pso.py(5)<module>()
-> def f(x,y):
(Pdb) n
> /Users/mlm/pso.py(10)<module>()
-> x, y = np.array(np.meshgrid(np.linspace(0,5,100), np.linspace(0,5,100)))
In pdb, the line of code will be printed before the prompt. Usually, the n command is what we would prefer as it executes that line of code and moves the flow at the same level without drilling down deeper. When we are at a line that calls a function (such as line 11 of the above program, that runs z = f(x, y)), we can use s to step into the function.
In the above example, we first step into the f() function, then another step to execute the computation, and finally, collect the return value from the function to give it back to the line that invoked the function. We see there are multiple s commands needed for a function as simple as one line because finding the function from the statement, calling the function, and returning it each takes one step. We can also see that in the body of the function, we called np.sin() like a function, but the debugger’s s command does not go into it. It is because the np.sin() function is not implemented in Python but in C. The pdb does not support compiled code.
If the program is long, it is quite boring to use the n command many times to move to somewhere we are interested. We can use the until command with a line number to let the debugger run the program until that line is reached:
A command similar to until is return, which will execute the current function until the point that it is about to return. You can consider that as until with the line number equal to the last line of the current function. The until command is a one-off, meaning it will bring you to that line only. If you want to stop at a particular line whenever it is being run, we can make a breakpoint on it. For example, if we are interested in how each iteration of the optimization algorithm moves the solution, we can set a breakpoint right after the update is applied:
After we set a breakpoint with the b command, we can let the debugger run our program until the breakpoint is hit. The c command means to continue until a trigger is met. At any point, we can use the bt command to show the traceback to check how we reached that point. We can also use the p command to print the variables (or an expression) to check what value they are holding.
Indeed, we can place a breakpoint with a condition so that it will stop only if the condition is met. The below will impose a condition that the first random number (r1) is greater than 0.5:
1
2
3
4
5
6
7
8
9
10
11
12
13
(Pdb) b 40, r1 > 0.5
Breakpoint 1 at /Users/mlm/pso.py:40
(Pdb) c
> /Users/mlm/pso.py(40)update()
-> obj = f(X[0], X[1])
(Pdb) p r1, r2
(0.8054505373292797, 0.7543489945823536)
(Pdb) c
> /Users/mlm/pso.py(40)update()
-> obj = f(X[0], X[1])
(Pdb) p r1, r2
(0.5404045753007164, 0.2967937508800147)
(Pdb)
Indeed, we can also try to manipulate variables while we are debugging.
1
2
3
4
5
6
7
8
9
10
11
12
13
14
15
16
17
18
19
20
21
22
23
24
25
26
27
28
29
30
31
32
33
34
35
36
37
38
39
40
41
42
(Pdb) l
35 global V, X, pbest, pbest_obj, gbest, gbest_obj
36 # Update params
37 r1, r2 = np.random.rand(2)
38 V = w * V + c1*r1*(pbest - X) + c2*r2*(gbest.reshape(-1,1)-X)
In the above, we use the l command to list the code around the current statement (identified by the arrow ->). In the listing, we can also see the breakpoint (marked with B) is set at line 40. As we can see the current value of V and r1, we can modify r1 from 0.54 to 0.2 and run the statement on V again by using j (jump) to line 38. And as we see after we execute the statement with the n command, the value of V is changed.
If we use a breakpoint and find something unexpected, chances are that it was caused by issues in a different level of the call stack. Debuggers allow you to navigate to different levels:
62 "Steps of PSO: algorithm update and show in plot"
63 title = 'Iteration {:02d}'.format(i)
64 # Update params
65 -> update()
66 # Set picture
67 ax.set_title(title)
68 pbest_plot.set_offsets(pbest.T)
69 p_plot.set_offsets(X.T)
70 p_arrow.set_offsets(X.T)
(Pdb) p title
'Iteration 02'
(Pdb)
In the above, the first bt command gives the call stack when we are at the bottom frame, i.e., the deepest of the call stack. We can see that we are about to execute the statement X = X + V. Then the up command moves our focus to one level up on the call stack, which is the line running the update() function (as we see at the line preceded with >). Since our focus is changed, the list command l will print a different fragment of code, and the p command can examine a variable in a different scope.
The above covers most of the useful commands in the debugger. If we want to terminate the debugger (which also terminates the program), we can use the q command to quit or hit Ctrl-D if your terminal supports it.
Want to Get Started With Python for Machine Learning?
Take my free 7-day email crash course now (with sample code).
Click to sign-up and also get a free PDF Ebook version of the course.
Debugger in Visual Studio Code
If you are not very comfortable running the debugger in command line, you can rely on the debugger from your IDE. Almost always, the IDE will provide you with some debugging facility. In Visual Studio Code, for example, you can launch the debugger in the “Run” menu.
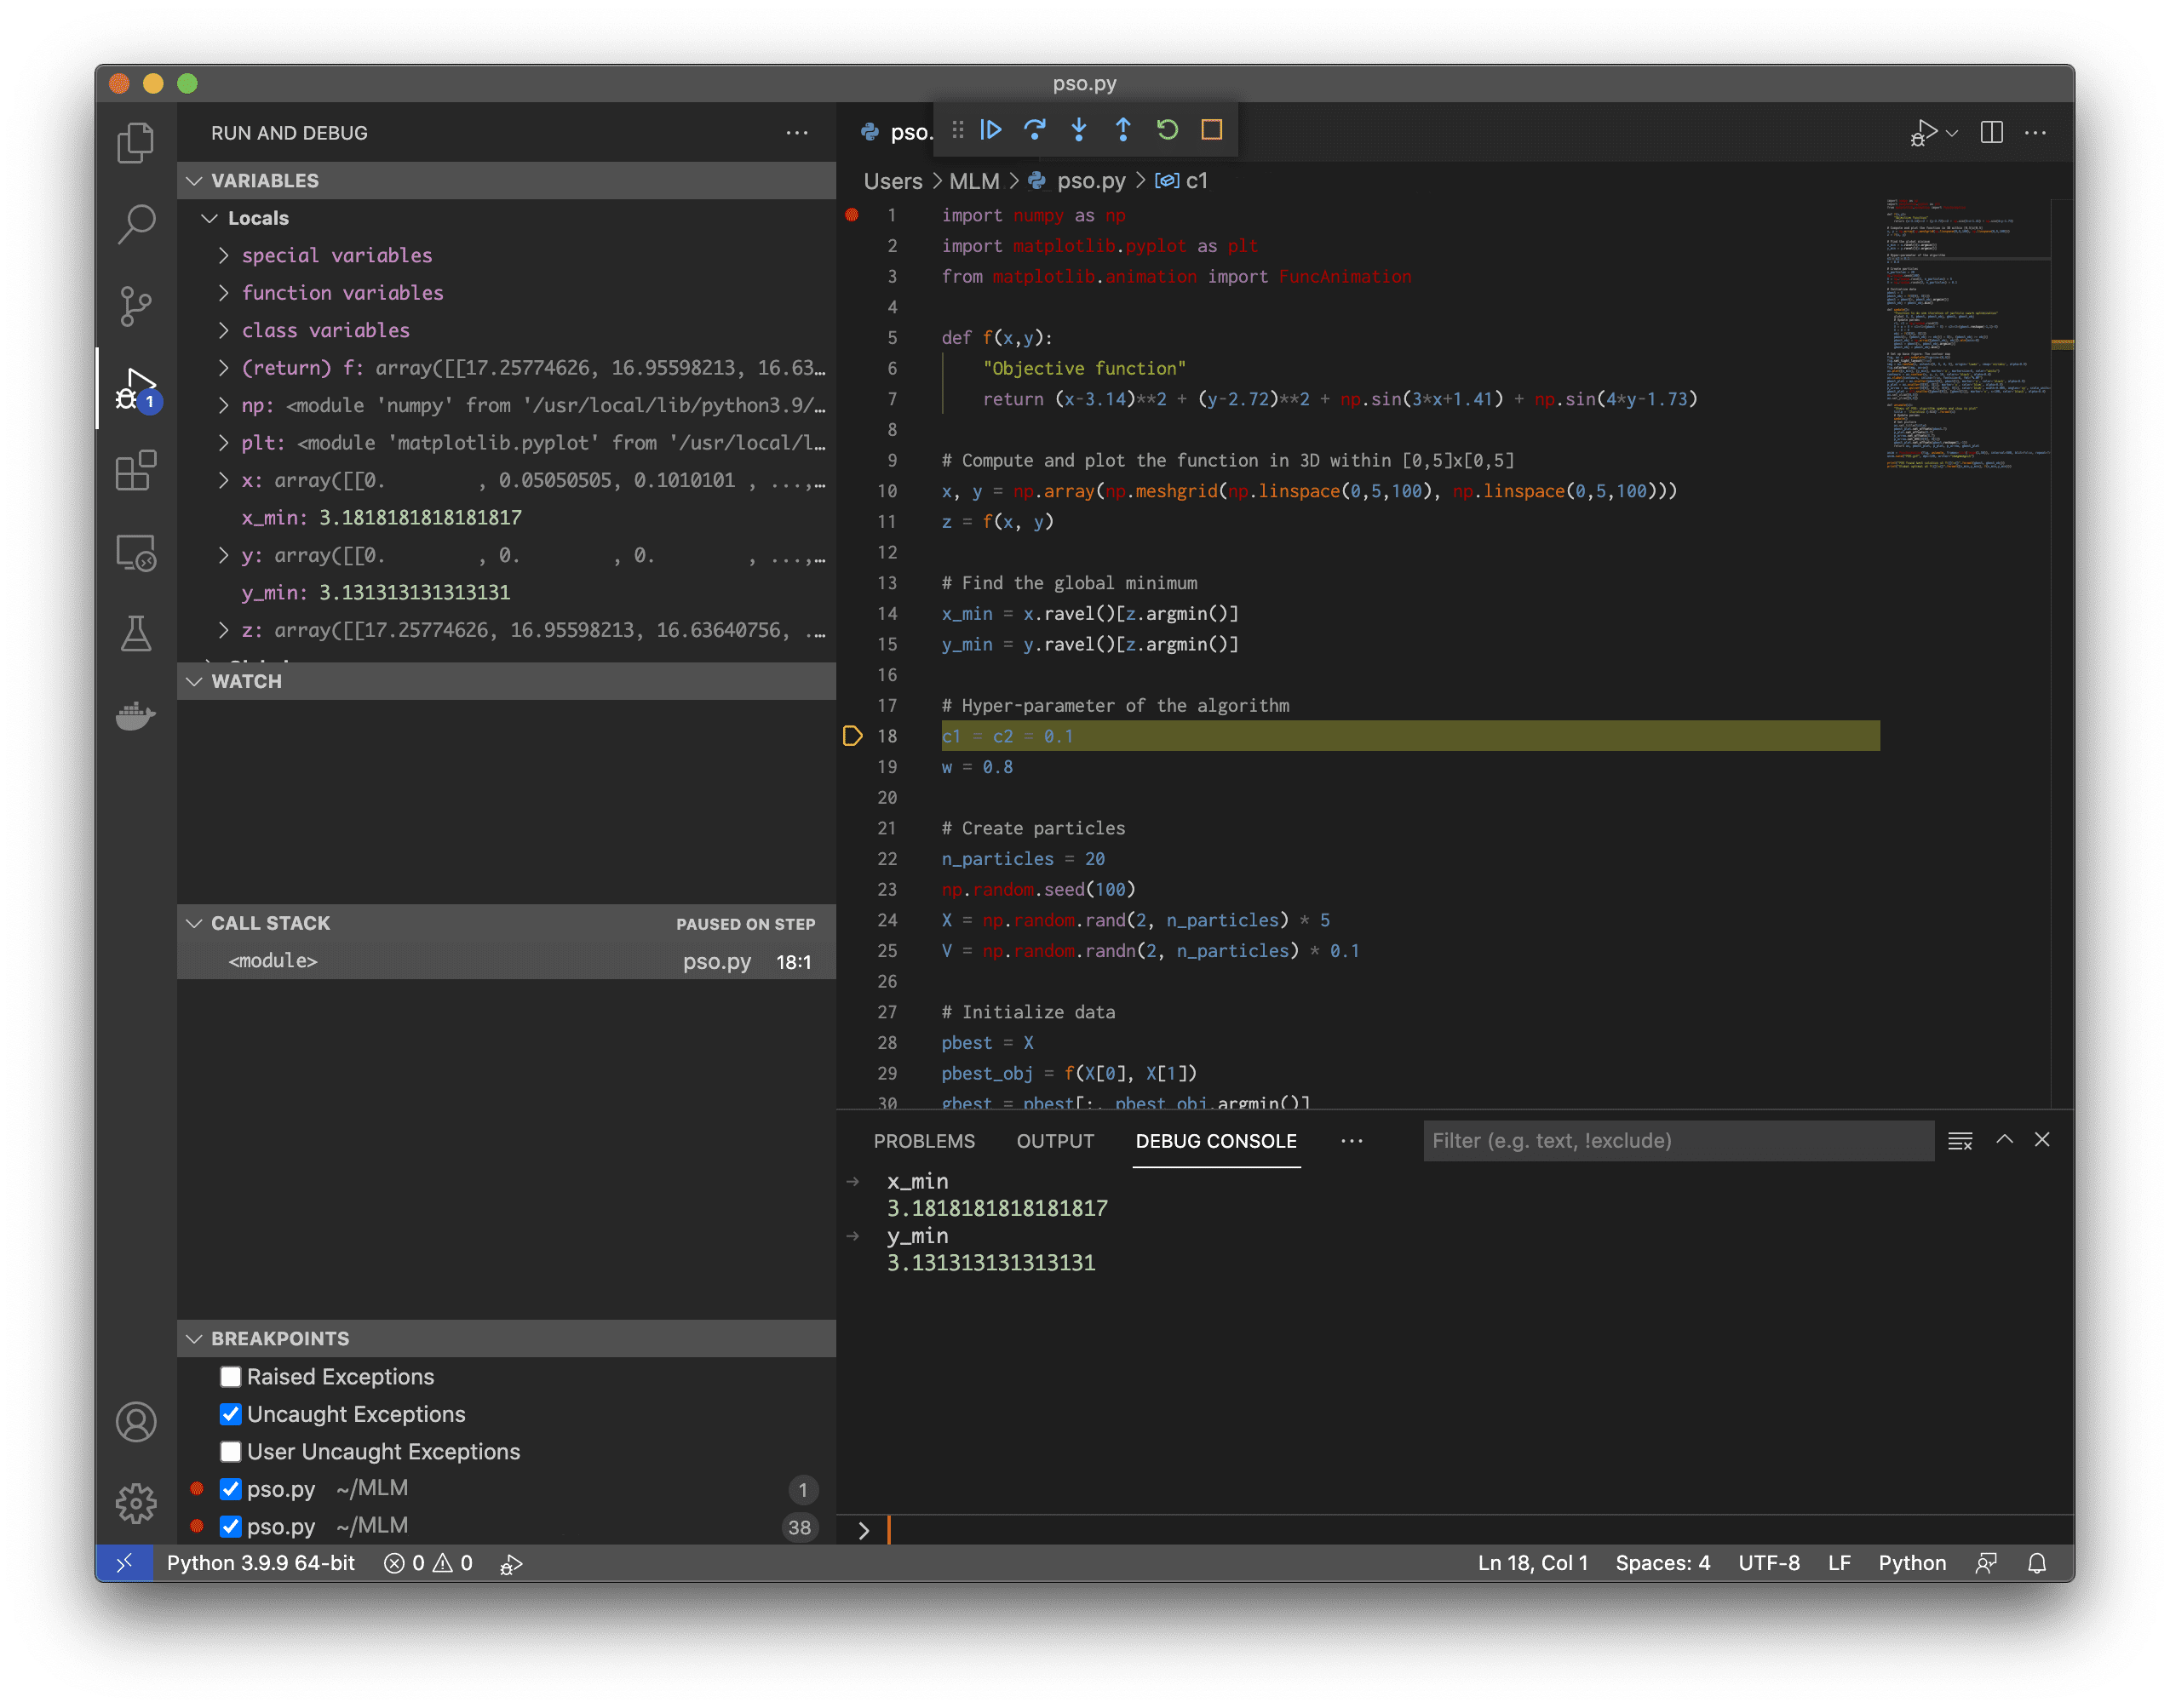
The screen below shows Visual Studio Code during a debugging session. The buttons at the center top correspond to the pdb commands continue, next, step, return, restart, and quit, respectively. A breakpoint can be created by clicking on the line number, and a red dot will be appeared to identify that. The bonus of using an IDE is that the variables are shown immediately at each debugging step. We can also watch for an express and show the call stack. These are on the left side of the screen below.
Using GDB on a running Python program
The pdb from Python is suitable only for programs running from scratch. If we have a program already running but is stuck, we cannot use pdb to hook into it to check what’s going on. The Python extension from GDB, however, can do this.
To demonstrate, let’s consider a GUI application. It will wait until the user’s action before the program can end. Hence it is a perfect example of how we can use gdb to hook into a running process. The code below is a “hello world” program using PyQt5 that just creates an empty window and waits for the user to close it:
1
2
3
4
5
6
7
8
9
10
11
12
13
14
15
16
17
18
19
import sys
from PyQt5.QtWidgets import QApplication,QWidget,QMainWindow
classFrame(QMainWindow):
def __init__(self):
super().__init__()
self.initUI()
def initUI(self):
self.setWindowTitle("Simple title")
self.resize(800,600)
def main():
app=QApplication(sys.argv)
frame=Frame()
frame.show()
sys.exit(app.exec_())
if__name__=='__main__':
main()
Let’s save this program as simpleqt.py and run it using the following in Linux under an X window environment:
1
python simpleqt.py &
The final & will make it run in the background. Now we can check for its process ID using the ps command:
1
ps a | grep python
1
2
3
...
3997 pts/1 Sl 0:00 python simpleqt.py
...
The ps command will tell you the process ID in the first column. If you have gdb installed with a Python extension, we can run:
1
gdb python 3997
and it will bring you into the GDB’s prompt:
1
2
3
4
5
6
7
8
9
10
11
12
13
14
15
16
17
18
19
20
21
22
23
24
25
26
27
28
29
30
31
32
33
34
35
36
37
38
39
40
41
42
43
44
45
46
GNU gdb (Debian 10.1-1.7) 10.1.90.20210103-git
Copyright (C) 2021 Free Software Foundation, Inc.
License GPLv3+: GNU GPL version 3 or later <http://gnu.org/licenses/gpl.html>
This is free software: you are free to change and redistribute it.
There is NO WARRANTY, to the extent permitted by law.
Type "show copying" and "show warranty" for details.
This GDB was configured as "x86_64-linux-gnu".
Type "show configuration" for configuration details.
For bug reporting instructions, please see:
<https://www.gnu.org/software/gdb/bugs/>.
Find the GDB manual and other documentation resources online at:
<http://www.gnu.org/software/gdb/documentation/>.
For help, type "help".
Type "apropos word" to search for commands related to "word"...
Reading symbols from python...
Reading symbols from /usr/lib/debug/.build-id/f9/02f8a561c3abdb9c8d8c859d4243bd8c3f928f.debug...
Attaching to program: /usr/local/bin/python, process 3997
[New LWP 3998]
[New LWP 3999]
[New LWP 4001]
[New LWP 4002]
[New LWP 4003]
[New LWP 4004]
[Thread debugging using libthread_db enabled]
Using host libthread_db library "/lib/x86_64-linux-gnu/libthread_db.so.1".
0x00007fb11b1c93ff in __GI___poll (fds=0x7fb110007220, nfds=3, timeout=-1) at ../sysdeps/unix/sysv/linux/poll.c:29
29 ../sysdeps/unix/sysv/linux/poll.c: No such file or directory.
(gdb) py-bt
Traceback (most recent call first):
<built-in method exec_ of QApplication object at remote 0x7fb115f64c10>
File "/mnt/data/simpleqt.py", line 16, in main
sys.exit(app.exec_())
File "/mnt/data/simpleqt.py", line 19, in <module>
main()
(gdb) py-list
11
12 def main():
13 app = QApplication(sys.argv)
14 frame = Frame()
15 frame.show()
>16 sys.exit(app.exec_())
17
18 if __name__ == '__main__':
19 main()
(gdb)
GDB is supposed to be a debugger for compiled programs (usually from C or C++). The Python extension allows you to check the code (written in Python) being run by the Python interpreter (written in C). It is less feature-rich than Python’s PDB in terms of handling Python code but valuable when you need to hook it into a running process.
The commands supported under GDB are py-list, py-bt, py-up, py-down, and py-print. They are comparable to the same commands in pdb without the py- prefix.
GDB is useful if your Python code uses a library compiled from C (such as numpy), and you want to investigate how it runs. It is also helpful to learn why your program is frozen by checking the call stack in run time. However, it may be rare that you need to use GDB to debug your machine learning project.
The command interface of pdb is influenced by that of GDB. Hence we can learn the technique of debugging a program in general from the latter. A good primer on how to use a debugger would be:
It provides self-study tutorials with hundreds of working code to equip you with skills including: debugging, profiling, duck typing, decorators, deployment,
and much more...
Showing You the Python Toolbox at a High Level for Your Projects


Nice explanation of GDB. I’ve used PDB but never GDB. Thanks!
Thank you for the feedback and kind words, Sean!
sdfsdf
Check out ipdb which offers an interface similar to ipython.
Thank you for the suggestion Dale!
Excellent article. The information on gdb usage is a treasure.
Thank you for the feedback and kind words, Nav!
Thank you for this excellent explanation. I didn’t know about DGB.
Thank you for the feedback Ivo!