
Anomaly detection is to find data points that deviate from the norm. In other words, those are the points that do not follow expected patterns. Outliers and exceptions are terms used to describe unusual data. Anomaly detection is important in a variety of fields because it gives valuable and actionable insights. An abnormality in an MR imaging scan, for instance, might indicate tumorous region in the brain, while an anomalous readout from a manufacturing plant sensor could indicate a broken component.
After going through this tutorial, you will be able to:
- Define and understand the anomaly detection.
- Implement the anomaly detection algorithms to analyze and interpret the results.
- See hidden patterns in any data that may lead to an anomalous behavior.
Let’s get started.

Anomaly Detection with Isolation Forest and Kernel Density Estimation
Photo by Katherine Chase. Some rights reserved.
What is Anomaly Detection?
An outlier is simply a data point that deviates considerably from the rest of the data points in a particular dataset. Similarly, anomaly detection is the process that helps us to identify the data outliers, or points that deviate considerably from the bulk of other data points.
When it comes to large datasets, there may include very complex patterns that cannot be detected by simply looking at the data. Therefore, in order to implement a critical machine learning application, the study of anomaly detection is of great significance.
Types of Anomalies
In data science domain, we have three different ways to classify anomalies. Understanding them correctly may have a big impact on how you handle anomalies.
- Point or Global Anomalies: Corresponding to the data points that differ significantly from the rest of the data points, global anomalies are known to be the most common form of anomalies. Usually, global anomalies are found very far away from the mean or median of any data distribution.
- Contextual or Conditional Anomalies: These anomalies have values that differ dramatically from those of the other data points in the same context. Anomalies in one dataset may not be anomalies in another.
- Collective Anomalies: The outlier objects that are tightly clustered because they have the same outlier character are referred to as collective outliers. For example, your server is not under a cyber-attack on a daily basis, therefore, it would be consider as an outlier.
While there are a number of techniques used for anomaly detection, let’s implement a few to understand how they can be used for various use cases.
Isolation Forest
Just like the random forests, isolation forests are built using decision trees. They are implemented in an unsupervised fashion as there are no pre-defined labels. Isolation forests were designed with the idea that anomalies are “few and distinct” data points in a dataset.
Recall that decision trees are built using information criteria such as Gini index or entropy. The obviously different groups are separated at the root of the tree and deeper into the branches, the subtler distinctions are identified. Based on randomly picked characteristics, an isolation forest processes the randomly subsampled data in a tree structure. Samples that reach further into the tree and require more cuts to separate them have a very little probability that they are anomalies. Likewise, samples that are found on the shorter branches of the tree are more likely to be anomalies, since the tree found it simpler to distinguish them from the other data.
In this session, we will implement isolation forest in Python to understand how it detects anomalies in a dataset. We all are aware of the incredible scikit-learn API that provides various APIs for easy implementations. Hence, we will be using it to apply Isolation Forests to demonstrate its effectiveness for anomaly detection.
First off, let’s load up the necessary libraries and packages.
|
1 2 3 4 |
from sklearn.datasets import make_blobs from numpy import quantile, random, where from sklearn.ensemble import IsolationForest import matplotlib.pyplot as plt |
Data Preparation
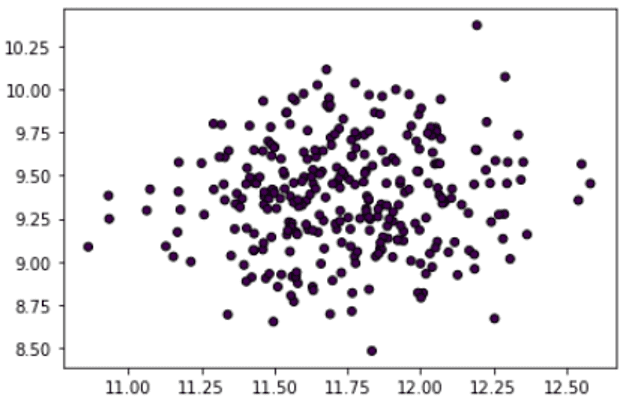
We’ll be using make_blob() function to create a dataset with random data points.
|
1 2 |
random.seed(3) X, _ = make_blobs(n_samples=300, centers=1, cluster_std=.3, center_box=(20, 5)) |
Let’s visualize the dataset plot to see the data points separated randomly in a sample space.
|
1 |
plt.scatter(X[:, 0], X[:, 1], marker="o", c=_, s=25, edgecolor="k") |
Defining and Fitting the Isolation Forest Model for Prediction
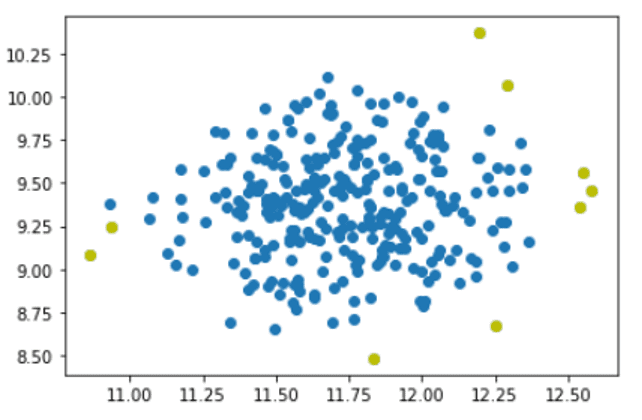
As mentioned, we’ll use IsolationForest class from the scikit-learn API to define our model. In the class arguments, we’ll set the number of estimators and the contamination value. Then we’ll use the fit_predict() function to get the predictions for the dataset by fitting it to the model.
|
1 2 |
IF = IsolationForest(n_estimators=100, contamination=.03) predictions = IF.fit_predict(X) |
Now, let’s extract the negative values as outliers and plot the results with anomalies highlighted in a color.
|
1 2 3 4 5 6 |
outlier_index = where(predictions==-1) values = X[outlier_index] plt.scatter(X[:,0], X[:,1]) plt.scatter(values[:,0], values[:,1], color='y') plt.show() |
Putting all these together, the following is the complete code:
|
1 2 3 4 5 6 7 8 9 10 11 12 13 14 15 16 17 |
from sklearn.datasets import make_blobs from numpy import quantile, random, where from sklearn.ensemble import IsolationForest import matplotlib.pyplot as plt random.seed(3) X, _ = make_blobs(n_samples=300, centers=1, cluster_std=.3, center_box=(20, 5)) plt.scatter(X[:, 0], X[:, 1], marker="o", c=_, s=25, edgecolor="k") IF = IsolationForest(n_estimators=100, contamination=.03) predictions = IF.fit_predict(X) outlier_index = where(predictions==-1) values = X[outlier_index] plt.scatter(X[:,0], X[:,1]) plt.scatter(values[:,0], values[:,1], color='y') plt.show() |
Kernel Density Estimation
If we consider the norm of a dataset should fit certain kind of probability distribution, the anomaly are those that we should see them rarely, or in a very low probability. Kernel density estimation is a technique that estimates the probability density function of the data points randomly in a sample space. With the density function, we can detect anomalies in a dataset.
For implementation, we’ll prepare data by creating a uniform distribution and then apply KernelDensity class from scikit-learn library to detect outliers.
To start, we’ll load necessary libraries and packages.
|
1 2 3 4 5 |
from sklearn.neighbors import KernelDensity from numpy import where, random, array, quantile from sklearn.preprocessing import scale import matplotlib.pyplot as plt from sklearn.datasets import load_boston |
Prepare and Plot the Data
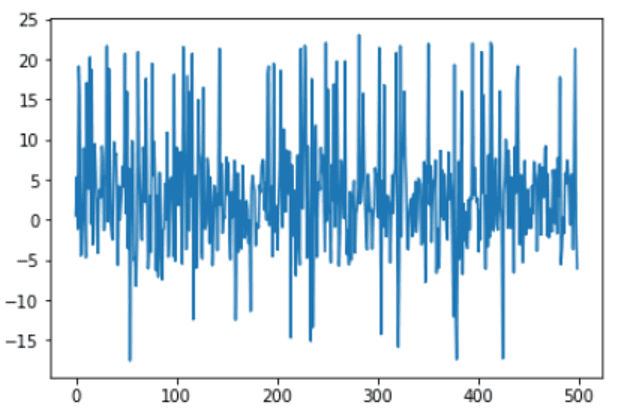
Let’s write a simple function to prepare the dataset. A randomly generated data will be used as a target dataset.
|
1 2 3 4 5 6 7 8 9 10 11 12 13 14 15 |
random.seed(135) def prepData(N): X = [] for i in range(n): A = i/1000 + random.uniform(-4, 3) R = random.uniform(-5, 10) if(R >= 8.6): R = R + 10 elif(R < (-4.6)): R = R +(-9) X.append([A + R]) return array(X) n = 500 X = prepData(n) |
Let’s visualize the plot to check the dataset.
|
1 2 3 |
x_ax = range(n) plt.plot(x_ax, X) plt.show() |
Prepare and Fit the Kernel Density Function for Prediction
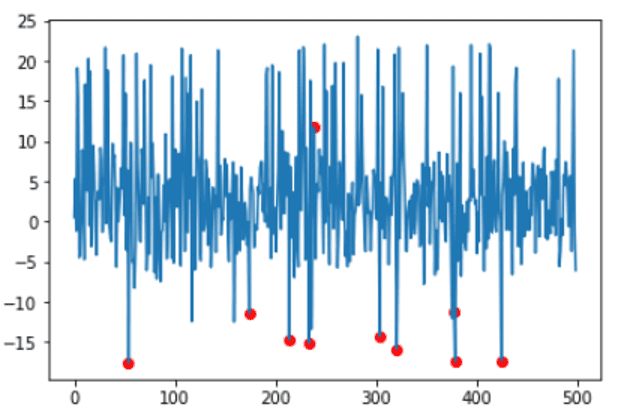
We’ll use scikit-learn API to prepare and fit the model. Then use score_sample() function to get the scores of samples in the dataset. Next, we’ll use quantile() function to obtain the threshold value.
|
1 2 3 4 5 6 |
kern_dens = KernelDensity() kern_dens.fit(X) scores = kern_dens.score_samples(X) threshold = quantile(scores, .02) print(threshold) |
|
1 |
-5.676136054971186 |
Samples with equal or lower scores than the obtained threshold will be detected, and then visualized with anomalies highlighted in a color:
|
1 2 3 4 5 6 |
idx = where(scores <= threshold) values = X[idx] plt.plot(x_ax, X) plt.scatter(idx,values, color='r') plt.show() |
Putting all these together, the following is the complete code:
|
1 2 3 4 5 6 7 8 9 10 11 12 13 14 15 16 17 18 19 20 21 22 23 24 25 26 27 28 29 30 31 32 33 34 35 36 37 38 |
from sklearn.neighbors import KernelDensity from numpy import where, random, array, quantile from sklearn.preprocessing import scale import matplotlib.pyplot as plt from sklearn.datasets import load_boston random.seed(135) def prepData(N): X = [] for i in range(n): A = i/1000 + random.uniform(-4, 3) R = random.uniform(-5, 10) if(R >= 8.6): R = R + 10 elif(R < (-4.6)): R = R +(-9) X.append([A + R]) return array(X) n = 500 X = prepData(n) x_ax = range(n) plt.plot(x_ax, X) plt.show() kern_dens = KernelDensity() kern_dens.fit(X) scores = kern_dens.score_samples(X) threshold = quantile(scores, .02) print(threshold) idx = where(scores <= threshold) values = X[idx] plt.plot(x_ax, X) plt.scatter(idx,values, color='r') plt.show() |
Further Reading
This section provides more resources on the topic if you are looking to go deeper.
APIs
Summary
In this tutorial, you discovered how to detect anomalies in your dataset.
Specifically, you learned:
- How to define anomalies and their different types
- What is Isolation Forest and how to use it for anomaly detection
- What is Kernel Density Estimation and how to use it for anomaly detection
Discover How Machine Learning Algorithms Work!

See How Algorithms Work in Minutes
...with just arithmetic and simple examples
Discover how in my new Ebook:
Master Machine Learning Algorithms
It covers explanations and examples of 10 top algorithms, like:
Linear Regression, k-Nearest Neighbors, Support Vector Machines and much more...
Finally, Pull Back the Curtain on
Machine Learning Algorithms
Skip the Academics. Just Results.


I have some questions,can you give me your e-mail address?
Hello 5cc…Yes.
Use the contact form.
It will go straight to my inbox.
I process emails in a batch, typically once or twice per day. This means I might not respond for 12 to 24 hours.
I often get 100s of emails per day, so please keep it brief. No big essays, code dumps, or long lists of questions. One question per email please.
Why is there a red dot at (230,12)?
Shouldn’t the KernelEstimation only mark points that are somewhat “unlikely” given the underlying distribution and thus, in case of a normal distribution, far from the mean?
So I would expect to see the red dots only in the y-axis-areas of the +15 / -15 range?
Hi Arne…Have you implemented this code to test the output?
Hi James, Thanks for share with us this informative article.
You are very welcome!
Interesting post, thanks for sharing.
Hi,
Thanks for the article it is really interesting ! I have a question :
How do you choose the parameters : n_estimators and contamination?
Are there any numerical method or is it based on business knowledge ?
Thank you in advance
Hi,
It would be great if you could do an article on anomaly detection applied to predictive maintenance.
Sincerely
I was refering to the picture in this article, not in my code.
You can see the red dot at (230,12) … However for outliers in the upper quadrant of the y-Axis I would expect only red dots for y-values greater than 15 or more.
Or is there a flaw in my understanding?
I do understand that the typical envelope around a timeseries you get from the Kernel Estimation Density is not globaly, but may have different values depending on the position of the X-axis. But the point at 230,12 does not look like an outlier at all.
So my question again: Can you give an analytical explanation regarding that point, as why this could even be an outlier?
Hi @James,
I know you have lot to do and this is a free content blog. Nevertheless I am trying one more time to push my answer.
Could you elaborate why the point at 230,12, as seen in your picture in this post, is classified as an outlier? This makes no sense to me.
Hi. I hope you are good.
Thank you for sharing this article.
I have a question. Could you please answer to me?
I have a dataset with 11000 data and about 600 features. and my data type are integer or float.
which one of way of outlier detection can be good for them?
I am studying about ways, but I can’t find good way up to now.
I studied isolated forest is good for a dataset with many data. but I think it isn’t good for a dataset with many features (I try it in my dataset and receive error)
as your article, I think I choose 2 by 2 feature, and use scatter plot for 2 by 2 features, and use isolated forest for them.
it’s good way?
Hi nirvana…the following may be of interest to you:
https://machinelearningmastery.com/model-based-outlier-detection-and-removal-in-python/
https://machinelearningmastery.com/anomaly-detection-with-isolation-forest-and-kernel-density-estimation/
Hi, I have a huge non time-series data set with 64 features. How do I identify which feature is causing the outlier?
Hi George…You may find the following resource of interest:
https://towardsdatascience.com/effective-approaches-for-time-series-anomaly-detection-9485b40077f1
Please can you change the code you are using .there are code that are annoying and not everyone can read people code ,thanks
I tried both models on a dataframe I made. I received errors at the same step in both cases. Where the values of the outlier cases are defined.
values=X[outlier_cases]
I receive a TypeError and an InvalidIndexError. Is my dataframe with 2 columns.
I need help understanding why I am getting this error and how to fix it. Everything else works.