
The Keras Python deep learning library provides tools to visualize and better understand your neural network models.
In this tutorial, you will discover exactly how to summarize and visualize your deep learning models in Keras.
After completing this tutorial, you will know:
- How to create a textual summary of your deep learning model.
- How to create a graph plot of your deep learning model.
- Best practice tips when developing deep learning models in Keras.
Kick-start your project with my new book Deep Learning With Python, including step-by-step tutorials and the Python source code files for all examples.
Let’s get started.

How to Visualize a Deep Learning Neural Network Model in Keras
Photo by Ed Dunens, some rights reserved.
Tutorial Overview
This tutorial is divided into 4 parts; they are:
- Example Model
- Summarize Model
- Visualize Model
- Best Practice Tips
Example Model
We can start off by defining a simple multilayer Perceptron model in Keras that we can use as the subject for summarization and visualization.
The model we will define has one input variable, a hidden layer with two neurons, and an output layer with one binary output.
For example:
|
1 |
[1 input] -> [2 neurons] -> [1 output] |
If you are new to Keras or deep learning, see this step-by-step Keras tutorial.
The code listing for this network is provided below.
|
1 2 3 4 5 |
from keras.models import Sequential from keras.layers import Dense model = Sequential() model.add(Dense(2, input_dim=1, activation='relu')) model.add(Dense(1, activation='sigmoid')) |
Summarize Model
Keras provides a way to summarize a model.
The summary is textual and includes information about:
- The layers and their order in the model.
- The output shape of each layer.
- The number of parameters (weights) in each layer.
- The total number of parameters (weights) in the model.
The summary can be created by calling the summary() function on the model that returns a string that in turn can be printed.
Below is the updated example that prints a summary of the created model.
|
1 2 3 4 5 6 |
from keras.models import Sequential from keras.layers import Dense model = Sequential() model.add(Dense(2, input_dim=1, activation='relu')) model.add(Dense(1, activation='sigmoid')) print(model.summary()) |
Running this example prints the following table.
|
1 2 3 4 5 6 7 8 9 10 11 |
_________________________________________________________________ Layer (type) Output Shape Param # ================================================================= dense_1 (Dense) (None, 2) 4 _________________________________________________________________ dense_2 (Dense) (None, 1) 3 ================================================================= Total params: 7 Trainable params: 7 Non-trainable params: 0 _________________________________________________________________ |
We can clearly see the output shape and number of weights in each layer.
Visualize Model
The summary is useful for simple models, but can be confusing for models that have multiple inputs or outputs.
Keras also provides a function to create a plot of the network neural network graph that can make more complex models easier to understand.
The plot_model() function in Keras will create a plot of your network. This function takes a few useful arguments:
- model: (required) The model that you wish to plot.
- to_file: (required) The name of the file to which to save the plot.
- show_shapes: (optional, defaults to False) Whether or not to show the output shapes of each layer.
- show_layer_names: (optional, defaults to True) Whether or not to show the name for each layer.
Below is the updated example that plots the created model.
Note, the example assumes that you have the graphviz graph library and the Python interface installed.
|
1 2 3 4 5 6 7 |
from keras.models import Sequential from keras.layers import Dense from keras.utils.vis_utils import plot_model model = Sequential() model.add(Dense(2, input_dim=1, activation='relu')) model.add(Dense(1, activation='sigmoid')) plot_model(model, to_file='model_plot.png', show_shapes=True, show_layer_names=True) |
Running the example creates the file model_plot.png with a plot of the created model.
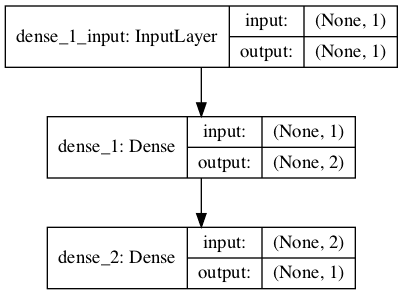
Plot of Neural Network Model Graph
Best Practice Tips
I generally recommend to always create a summary and a plot of your neural network model in Keras.
I recommend this for a few reasons:
- Confirm layer order. It is easy to add layers in the wrong order with the sequential API or to connect them together incorrectly with the functional API. The graph plot can help you confirm that the model is connected the way you intended.
- Confirm the output shape of each layer. It is common to have problems when defining the shape of input data for complex networks like convolutional and recurrent neural networks. The summary and plot can help you confirm the input shape to the network is as you intended.
- Confirm parameters. Some network configurations can use far fewer parameters, such as the use of a TimeDistributed wrapped Dense layer in an Encoder-Decoder recurrent neural network. Reviewing the summary can help spot cases of using far more parameters than expected.
Further Reading
This section provides more resources on the topic if you are looking to go deeper.
- Model visualization Keras API
- Graphviz – Graph Visualization Software
- Simple Python interface for Graphviz
Summary
In this tutorial, you discovered how to summarize and visualize your deep learning models in Keras.
Specifically, you learned:
- How to create a textual summary of your deep learning model.
- How to create a graph plot of your deep learning model.
- Best practice tips when developing deep learning models in Keras.
Do you have any questions?
Ask your questions in the comments below and I will do my best to answer.


")


Running plot_model leaves an error.
It cant import pydot.
I did install it and try.
No improvement at all.
What is the error?
I get this.
attribute error: ‘module’ object has no attribute ‘find_graphviz’
You may need to install two packages: pydot and pygraphviz.
if you are using conda environment then may be this will work.
!conda install –yes graphviz
!conda install –yes pydotplus
Thanks for sharing Shantanu.
I have the same problem.
It shows “ImportError: Failed to import pydot. You must install pydot and graphviz for
pydotprintto work.” even I had installed graphviz and pydot or pydotplus.You must install pydot and pygraphviz.
You can also try add graphviz folder to system path. It works for me.
If you’re having an error, it’s 99% likely that it’s because you didn’t put the /graphviz/bin/ filepath to your PATH.
pip install graphvizis not sufficient. You need to add its files to PATHThanks for sharing.
How to add to path in linux
Hi Jason , you could also include a tutorial for tensorboard in which each time a model is run we can log it using callback function and display all runs on tensorboard
Thanks for the suggestion.
thank you Jason Brownlee for your help……god bless you
You’re welcome.
All the prints do not contain the activation function, I think important in defining a layer!…
Good point.
check out this project for a better visual result:
https://github.com/yu4u/convnet-drawer
Have you used it?
What does a dense layer respect other kind of layers?
Another question, un all the neurons of the same layer It Will be used the same activation función?
All of the neurons in a layer do use the same activation function.
HI, I got this error : “raise ImportError(‘Failed to import pydot. You must install pydot’
ImportError: Failed to import pydot. You must install pydot and graphviz for
pydotprintto work.”I have installed both pydot and graphviz via “sudo pip install **”, but still not solving the problem. Can I have a comment?
Thank you
I recommend installing pygraphviz instead of graphviz.
I’m currently trying to get comfortable with Keras. I think I need to gather examples of importing things like image data. Also, I only really understand basic neural networks so far, I’ll have to study further on how to make convolutional networks with Keras. Finally, I’m not sure I understand how a network can work with batches of images at the same time.
I plan to use Keras with this repo: github.com/diginessforever/machinelearning -> it already has a nifty webscraper and some of my noobish neural network code.
Cool, thanks for sharing. Good luck!
Can we visualize the model in tensorboard
I believe so. I do not have a tutorial, sorry.
Jason, really didn’t get it working. I have installed pydot, pygraphviz and gpraphviz using both conda and python – m pip command but still same message. what is the trick. If you can specify command in sequence may help. Thanks in advace.
There was no special trick, I just pip-installed those two libraries.
Perhaps try posting/searching for your error on stackoverflow.com?
Hi Jason, cool tutorial! Could you please expand it to a Model with multiple inputs? Nothing complicated, maybe a Dense layer on input a, a Dense layer on input b, merge them together, map to some classes, done.Thanks in advance.
Here are some example:
https://machinelearningmastery.com/keras-functional-api-deep-learning/
For training purpose in Keras, Do we need to explicitly configure to use GPU ? Or it will automatically use the GPU?
You must configure the backend (e.g. tensorflow, etc.) to use the GPU. If done, Keras will then use the GPU.
ImportError: Failed to import pydot. You must install pydot and graphviz for
pydotprintto work.I have already installed pydot and graphviz using conda install pydot and conda install graphivz,
but still showing me this error?
Sorry to hear that. Perhaps post the error to stackoverflow?
Hello Jason.
Digging in stackoverflow i found out that the following error is actually a bug in Keras and many people have it, it does not get fixed even if you install both libraries:
ImportError: Failed to import pydot. You must install pydot and graphviz for pydotprint to work.
Apparently there is no way to solve this to this day. Is there any other trick to visualize the model? Thanks.
No trick. I installed the libraries and wrote/ran the code.
Hello Jason,
I use your code to picture the same model. And I got a problem that the picture had no input
layers. Instead, it pictures numbers such as 140223915681232. Do you have the same problem
before?
I have not seen that, perhaps it is a bug? You could try posting to issues section of the Keras github project?
Me too had the same problem
You must update your version of Keras.
Hi, Jason I have used conv3d layers in network as my dataset is 3d. now i want to plot the features of intermidiate layers. what is the process to do that and how can i visualize feature maps in intermidiate layers in 3d dataset. w hich library should i use?
Sorry, I don’t have examples of visualizing the feature maps within a CNN.
What do the “None” values mean in the printout?
Great question!
It means “unspecified” and that it can vary with the size of the input.
Thank you for this and all the other deep learning how tos. You are the best!
You’re welcome, happy it helped.
My model looks like this :
model = Sequential()
model.add(LSTM(214,return_sequences= True, activation=’relu’, input_shape=(train_X.shape[1], train_X.shape[2])))
model.add(LSTM(204, activation= ‘relu’))
model.add(Dense(n_prediction))
If I run the plot_model function I get a picture like you show above but my very first input is a box with a hudge number of 732677288.
What does this mean?
Is there any possibility to print a dot plot of the network so I can better understand the LSTM layer.
I see this too, it might be a fault in the latest version of Keras.
Same problem here. Is this a confirmed bug? I couldn’t find any information on th web.
Try updating to Keras 2.2.2.
There is a similar function in R Keras?
Thank you
I don’t know, sorry.
Hi Jason,
Thanks for a great post.
One question: my plot_model command did generate a file but it did not display it in Jupyter notebook.
I know there is command (%matplotlib inline) to have matplotlib images displayed in Jupyter. Is there similar command that is needed to display output of plot_model?
Thanks
Ajit
I recommend running code from the command line, it always works!
Hi Jason,
Yet another cool post!
The following will not pring the activation layer.
model.add(Dense(2, input_dim=1, activation=’relu’))
print (model.summary())
However, the activation layer gets printed if you use add it piecewise like the following:
model.add(Dense(2, input_dim=1))
model.add(Activation(‘relu’))
print (model.summary())
Would you know why?
Regards
Yes, in one case it is part of a layer and in the second it is implemented as a layer.
The models are different, it is a design decision, and in this case they are functionally equivalent. This will not always be the case.
Maybe about time to write a tutorial on Tensorboard, Jason? Keep up the god work!
Thanks for the suggestion.
nice post Jason !. Thks.
I appreciate this particualr tip regarding summary and model_plot functions l :
“It is common to have problems when defining the shape of input data for complex networks like convolutional and recurrent neural networks. The summary and plot can help you confirm the input shape to the network is as you intended”.
because it is very usual get wrong and confused when matching input-output dimension and using reshaping for training data shape, input shape argument, convolutional specific shape treatments, etc …of the different layers and models
Yes, it might be the most common question about neural net configuration (issues with size mismatches)!
you rock!!!!
have been reading blogs here and there for the last 20 years, but your blog is without a doubt best.
Thanks.
Most excellent tutorial!
Is there any way to do this ‘in reverse’? For example, with a classifying CNN with 10 output classes, you can ‘stimulate’ one of the outputs and see how the filters produce it?
Not sure I understand, can you elaborate?
Sorry, I’ll try and be a bit clearer. The visualisations here show the layer activations when you present a CNN with, say, a bird, giving a final classification of ‘robin’. We see what parts of the image various layers are interested in on the way from ‘this bird image’ to ‘robin classification’.
My question was related to the inverse operation. If we’ve got that same CNN, is there any way we can use it (or a modified form of it) to see what filters are generally more or less important for the the ‘robin’ classification versus other ones.
This sounds like a significantly harder problem. Off hand, I don’t see a clean way.
Perhaps some clever engineer has devised a way, I’m not across it sorry.
ValueError: Error when checking input: expected conv2d_3_input to have shape (966, 1296, 3) but got array with shape (966, 1296, 1)
sir i am facing this error while model.fit is executing
and i have and other doubt is that we can train our model using only one image data with label
The error suggests a mismatch between the shape of your data and your model.
You can reshape your data or change the expectations of your model.
Hi Jason,
Yet another cool post!
Can you make a study on how to visualize the changes of LSTM cell state?
Thanks!
Thanks.
Interesting suggestion.
Why are you interested in changes in LSTM state?
Hi Jason,
One more great tutorial!
Is it possible to save/capture the optimizer & loss function of the model used?
Thanks!
What do you mean exactly?
As the model architecture (layers) can be saved as an image. But this does not contain the information regarding the optimizer and loss function (used in the compile function). Is there a way to retrieve this information from the model?
I see, good question.
I’m not sure off the cuff, perhaps try posting to the keras user group:
https://machinelearningmastery.com/get-help-with-keras/
nice read.
I was looking for a way to visualize models so that I can explain to a student properly.
I remember doing this in torch7 which is by far the easiest way to teach this stuff.
Unfortunately developement on lua stalled
Thanks.
Maybe you can switch to pytorch:
https://machinelearningmastery.com/pytorch-tutorial-develop-deep-learning-models/
Great tutorial!
After building the DNN or CNN model, and choosing the Dropout rate, # of Epochs, and Batch size, Number of Hidden Neurons in Each Hidden Layer, How to connect the findings with scientific justification?
In other wording: How can I interpret and discuss the results?
Results can only provide empirical evidence, and even then typically relative to other models you have explicitly tested on the same test harness, i.e. relative improvement.
Often this is the best we can do in applied machine learning.
I have installed both required libraries . I suppose that the code will pop out a window showing the visualized model , right ? If yes , i don’t get that window . Should i add some “import” lines?
By the way , i open manually the png file.
I believe the image is saved to file, not popped up.
OSError:
pydotfailed to call GraphViz.Please install GraphViz (https://www.graphviz.org/) and ensure that its executables are in the $PATH.i have already installed GraphViz and pydot
Also install pygraphviz and pydot.
I don’t found “none” it’s a “?” on her place
Yes, it means not bounded.
AttributeError Traceback (most recent call last)
in
41
42 Model.summary()
—> 43 plot_model(model, to_file=’model_plot.png’,show_shapes=True, show_layer_names=True)
~/anaconda3/lib/python3.7/site-packages/keras/utils/vis_utils.py in plot_model(model, to_file, show_shapes, show_layer_names, rankdir, expand_nested, dpi)
238 “””
239 dot = model_to_dot(model, show_shapes, show_layer_names, rankdir,
–> 240 expand_nested, dpi)
241 _, extension = os.path.splitext(to_file)
242 if not extension:
~/anaconda3/lib/python3.7/site-packages/keras/utils/vis_utils.py in model_to_dot(model, show_shapes, show_layer_names, rankdir, expand_nested, dpi, subgraph)
97 if not model.built:
98 model.build()
—> 99 layers = model._layers
100
101 # Create graph nodes.
AttributeError: ‘XGBRegressor’ object has no attribute ‘_layers’
Looks like you are trying to apply the code to an xgboost model, which would be invalid.
I faced the same problems as mentioned by others above in using pydot and graphviz.
I could get the above issue to work out using google colab, couldnt exactly get the solution but this works for me.
hope this can be of help for someone facing the same issue.
Perhaps just comment out the call to plot_model.
Is the last number in the parenthesis under the ” Output Shape” column, the number of nodes/ neurons in the layer?
Yes. (None,2) means you have 2 neurons in the output of that layer. None is just a placeholder for number of samples because the neural network operates on a batch of input.
Thanks, good explanation, but what does it mean (None) in the figure?
plotting doesn’t work because the Python library is a constantly changing nightmare. Next time you write an article, write it about something that is ROBUST or waste a lot of time constantly updating your article with lots of the latest version instructions on the installation hell that you require your readers to go through.
This reminds me of the first data science class I took at Harvard: 50% of the class time was spent debugging installation nightmares.
Hi Jeff…Thank you your feedback! Please let us know what issues you are experiencing including exact verbiage of error messages so that may better guide you.
while visualizing the model I get an error
ModuleNotFoundError: No module named ‘keras.utils.vis_utils’
any help please?
Hi Magdy…There are some great recommendations here:
https://stackoverflow.com/questions/43511819/importerror-no-module-named-keras-utils-visualize-util
Hi James, thanks for replying
I’m already implementing the suggestion indicated there but still facing the same issue
here is my part of this code”
#Visualization of the NN model
from keras.utils.vis_utils import plot_model
plot_model(model, show_shapes=True, show_layer_names=True, show_dtype=True,show_layer_activations=True)