
It is good practice to gather a population of results when comparing two different machine learning algorithms or when comparing the same algorithm with different configurations.
Repeating each experimental run 30 or more times gives you a population of results from which you can calculate the mean expected performance, given the stochastic nature of most machine learning algorithms.
If the mean expected performance from two algorithms or configurations are different, how do you know that the difference is significant, and how significant?
Statistical significance tests are an important tool to help to interpret the results from machine learning experiments. Additionally, the findings from these tools can help you better and more confidently present your experimental results and choose the right algorithms and configurations for your predictive modeling problem.
In this tutorial, you will discover how you can investigate and interpret machine learning experimental results using statistical significance tests in Python.
After completing this tutorial, you will know:
- How to apply normality tests to confirm that your data is (or is not) normally distributed.
- How to apply parametric statistical significance tests for normally distributed results.
- How to apply nonparametric statistical significance tests for more complex distributions of results.
Kick-start your project with my new book Statistics for Machine Learning, including step-by-step tutorials and the Python source code files for all examples.
Let’s get started.
- Update May/2018: Updated language related to “reject” vs “failure to reject” of H0.

How to Use Statistical Significance Tests to Interpret Machine Learning Results
Photo by oatsy40, some rights reserved.
Tutorial Overview
This tutorial is broken down into 6 parts. They are:
- Generate Sample Data
- Summary Statistics
- Normality Test
- Compare Means for Gaussian Results
- Compare Means for Gaussian Results with Different Variance
- Compare Means for Non-Gaussian Results
This tutorial assumes Python 2 or 3 and a SciPy environment with NumPy, Pandas, and Matplotlib.
Need help with Statistics for Machine Learning?
Take my free 7-day email crash course now (with sample code).
Click to sign-up and also get a free PDF Ebook version of the course.
Generate Sample Data
The situation is that you have experimental results from two algorithms or two different configurations of the same algorithm.
Each algorithm has been trialed multiple times on the test dataset and a skill score has been collected. We are left with two populations of skill scores.
We can simulate this by generating two populations of Gaussian random numbers distributed around slightly different means.
The code below generates the results from the first algorithm. A total of 1000 results are stored in a file named results1.csv. The results are drawn from a Gaussian distribution with the mean of 50 and the standard deviation of 10.
|
1 2 3 4 5 6 7 8 9 10 11 |
from numpy.random import seed from numpy.random import normal from numpy import savetxt # define underlying distribution of results mean = 50 stev = 10 # generate samples from ideal distribution seed(1) results = normal(mean, stev, 1000) # save to ASCII file savetxt('results1.csv', results) |
Below is a snippet of the first 5 rows of data from results1.csv.
|
1 2 3 4 5 6 |
6.624345363663240960e+01 4.388243586349924641e+01 4.471828247736544171e+01 3.927031377843829318e+01 5.865407629324678851e+01 ... |
We can now generate the results for the second algorithm. We will use the same method and draw the results from a slightly different Gaussian distribution (mean of 60 with the same standard deviation). Results are written to results2.csv.
|
1 2 3 4 5 6 7 8 9 10 11 |
from numpy.random import seed from numpy.random import normal from numpy import savetxt # define underlying distribution of results mean = 60 stev = 10 # generate samples from ideal distribution seed(1) results = normal(mean, stev, 1000) # save to ASCII file savetxt('results2.csv', results) |
Below is a sample of the first 5 rows from results2.csv.
|
1 2 3 4 5 6 |
7.624345363663240960e+01 5.388243586349924641e+01 5.471828247736544171e+01 4.927031377843829318e+01 6.865407629324678851e+01 ... |
Going forward, we will pretend that we don’t know the underlying distribution of either set of results.
I chose populations of 1000 results per experiment arbitrarily. It is more realistic to use populations of 30 or 100 results to achieve a suitably good estimate (e.g. low standard error).
Don’t worry if your results are not Gaussian; we will look at how the methods break down for non-Gaussian data and what alternate methods to use instead.
Summary Statistics
The first step after collecting results is to review some summary statistics and learn more about the distribution of the data.
This includes reviewing summary statistics and plots of the data.
Below is a complete code listing to review some summary statistics for the two sets of results.
|
1 2 3 4 5 6 7 8 9 10 11 12 13 14 15 |
from pandas import DataFrame from pandas import read_csv from matplotlib import pyplot # load results file results = DataFrame() results['A'] = read_csv('results1.csv', header=None).values[:, 0] results['B'] = read_csv('results2.csv', header=None).values[:, 0] # descriptive stats print(results.describe()) # box and whisker plot results.boxplot() pyplot.show() # histogram results.hist() pyplot.show() |
The example loads both sets of results and starts off by printing summary statistics. Data in results1.csv is called “A” and data in results2.csv is called “B” for brevity.
We will assume that the data represents an error score on a test dataset and that minimizing the score is the goal.
We can see that on average A (50.388125) was better than B (60.388125). We can also see the same story in the median (50th percentile). Looking at the standard deviations, we can also see that it appears both distributions have a similar (identical) spread.
|
1 2 3 4 5 6 7 8 9 |
A B count 1000.000000 1000.000000 mean 50.388125 60.388125 std 9.814950 9.814950 min 19.462356 29.462356 25% 43.998396 53.998396 50% 50.412926 60.412926 75% 57.039989 67.039989 max 89.586027 99.586027 |
Next, a box and whisker plot is created comparing both sets of results. The box captures the middle 50% of the data, outliers are shown as dots and the green line shows the median. We can see the data indeed has a similar spread from both distributions and appears to be symmetrical around the median.
The results for A look better than B.
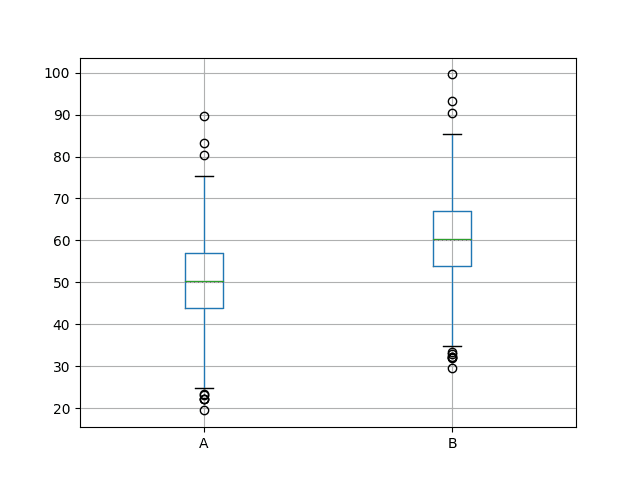
Box and Whisker Plots of Both Sets of Results
Finally, histograms of both sets of results are plotted.
The plots strongly suggest that both sets of results are drawn from a Gaussian distribution.
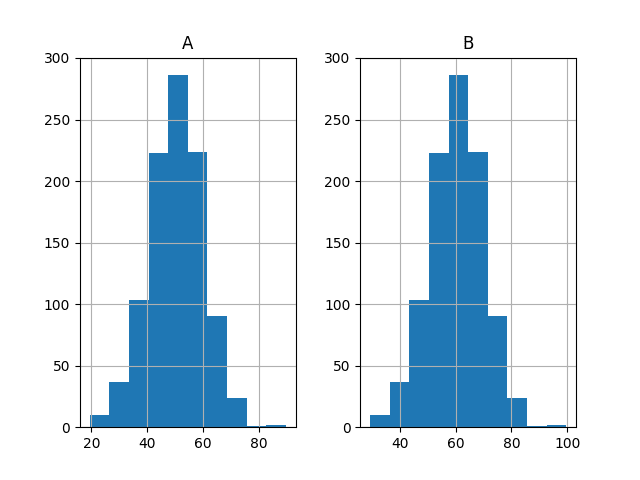
Histogram Plots of Both Sets of Results
Normality Test
Data drawn from a Gaussian distribution can be easier to work with as there are many tools and techniques specifically designed for this case.
We can use a statistical test to confirm that the results drawn from both distributions are Gaussian (also called the normal distribution).
In SciPy, this is the normaltest() function.
From the documentation, the test is described as:
Tests whether a sample differs from a normal distribution.
The null hypothesis of the test (H0), or the default expectation, is that the statistic describes a normal distribution.
We fail to reject this hypothesis if the p-value is greater than 0.05. We reject this hypothesis if the p-value <= 0.05. In this case, we would believe the distribution is not normal with 95% confidence.
The code below loads results1.csv and determines whether it is likely that the data is Gaussian.
|
1 2 3 4 5 6 7 8 9 10 |
from pandas import read_csv from scipy.stats import normaltest from matplotlib import pyplot result1 = read_csv('results1.csv', header=None) value, p = normaltest(result1.values[:,0]) print(value, p) if p >= 0.05: print('It is likely that result1 is normal') else: print('It is unlikely that result1 is normal') |
Running the example first prints the calculated statistic and the p-value that the statistic was calculated from a Gaussian distribution.
We can see that it is very likely that results1.csv is Gaussian.
|
1 2 |
2.99013078116 0.224233941463 It is likely that result1 is normal |
We can repeat this same test with data from results2.csv.
The complete code listing is provided below.
|
1 2 3 4 5 6 7 8 9 10 |
from pandas import read_csv from scipy.stats import normaltest from matplotlib import pyplot result2 = read_csv('results2.csv', header=None) value, p = normaltest(result2.values[:,0]) print(value, p) if p >= 0.05: print('It is likely that result2 is normal') else: print('It is unlikely that result2 is normal') |
Running the example provides the same statistic p-value and outcome.
Both sets of results are Gaussian.
|
1 2 |
2.99013078116 0.224233941463 It is likely that result2 is normal |
Compare Means for Gaussian Results
Both sets of results are Gaussian and have the same variance; this means we can use the Student t-test to see if the difference between the means of the two distributions is statistically significant or not.
In SciPy, we can use the ttest_ind() function.
The test is described as:
Calculates the T-test for the means of two independent samples of scores.
The null hypothesis of the test (H0) or the default expectation is that both samples were drawn from the same population. If we fail to reject this hypothesis, it means that there is no significant difference between the means.
If we get a p-value of <= 0.05, it means that we can reject the null hypothesis and that the means are significantly different with a 95% confidence. That means for 95 similar samples out of 100, the means would be significantly different, and not so in 5 out of 100 cases.
An important assumption of this statistical test, besides the data being Gaussian, is that both distributions have the same variance. We know this to be the case from reviewing the descriptive statistics in a previous step.
The complete code listing is provided below.
|
1 2 3 4 5 6 7 8 9 10 11 12 13 14 15 16 |
from pandas import read_csv from scipy.stats import ttest_ind from matplotlib import pyplot # load results1 result1 = read_csv('results1.csv', header=None) values1 = result1.values[:,0] # load results2 result2 = read_csv('results2.csv', header=None) values2 = result2.values[:,0] # calculate the significance value, pvalue = ttest_ind(values1, values2, equal_var=True) print(value, pvalue) if pvalue > 0.05: print('Samples are likely drawn from the same distributions (fail to reject H0)') else: print('Samples are likely drawn from different distributions (reject H0)') |
Running the example prints the statistic and the p-value. We can see that the p-value is much lower than 0.05.
In fact, it is so small that we have a near certainty that the difference between the means is statistically significant.
|
1 2 |
-22.7822655028 2.5159901708e-102 Samples are likely drawn from different distributions (reject H0) |
Compare Means for Gaussian Results with Different Variance
What if the means were the same for the two sets of results, but the variance was different?
We would not be able to use the Student t-test as is. In fact, we would have to use a modified version of the test called Welch’s t-test.
In SciPy, this is the same ttest_ind() function, but we must set the “equal_var” argument to “False” to indicate the variances are not equal.
We can demonstrate this with an example where we generate two sets of results with means that are very similar (50 vs 51) and very different standard deviations (1 vs 10). We will generate 100 samples.
|
1 2 3 4 5 6 7 8 9 10 11 12 13 14 15 |
from numpy.random import seed from numpy.random import normal from scipy.stats import ttest_ind # generate results seed(1) n = 100 values1 = normal(50, 1, n) values2 = normal(51, 10, n) # calculate the significance value, pvalue = ttest_ind(values1, values2, equal_var=False) print(value, pvalue) if pvalue > 0.05: print('Samples are likely drawn from the same distributions (fail to reject H0)') else: print('Samples are likely drawn from different distributions (reject H0)') |
Running the example prints the test statistic and the p-value.
We can see that there is good evidence (nearly 99%) that the samples were drawn from different distributions, that the means are significantly different.
|
1 2 |
-2.62233137406 0.0100871483783 Samples are likely drawn from different distributions (reject H0) |
The closer the distributions are, the larger the sample that is required to tell them apart.
We can demonstrate this by calculating the statistical test on different sized sub-samples of each set of results and plotting the p-values against the sample size.
We would expect the p-value to get smaller with the increase sample size. We can also draw a line at the 95% level (0.05) and show at what point the sample size is large enough to indicate these two populations are significantly different.
|
1 2 3 4 5 6 7 8 9 10 11 12 13 14 15 16 17 18 19 |
from numpy.random import seed from numpy.random import normal from scipy.stats import ttest_ind from matplotlib import pyplot # generate results seed(1) n = 100 values1 = normal(50, 1, n) values2 = normal(51, 10, n) # calculate p-values for different subsets of results pvalues = list() for i in range(1, n+1): value, p = ttest_ind(values1[0:i], values2[0:i], equal_var=False) pvalues.append(p) # plot p-values vs number of results in sample pyplot.plot(pvalues) # draw line at 95%, below which we reject H0 pyplot.plot([0.05 for x in range(len(pvalues))], color='red') pyplot.show() |
Running the example creates a line plot of p-value vs sample size.
We can see that for these two sets of results, the sample size must be about 90 before we have a 95% confidence that the means are significantly different (where the blue line intersects the red line).
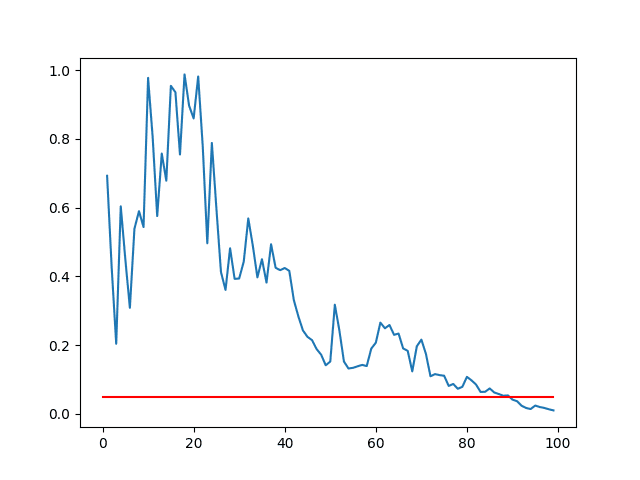
Line Plot of p-value vs Sample Sizes
Compare Means for Non-Gaussian Results
We cannot use the Student t-test or the Welch’s t-test if our data is not Gaussian.
An alternative statistical significance test we can use for non-Gaussian data is called the Kolmogorov-Smirnov test.
In SciPy, this is called the ks_2samp() function.
In the documentation, this test is described as:
This is a two-sided test for the null hypothesis that 2 independent samples are drawn from the same continuous distribution.
This test can be used on Gaussian data, but will have less statistical power and may require large samples.
We can demonstrate the calculation of statistical significance on two sets of results with non-Gaussian distributions. We can generate two sets of results with overlapping uniform distributions (50 to 60 and 55 to 65). These sets of results will have different mean values of about 55 and 60 respectively.
The code below generates the two sets of 100 results and uses the Kolmogorov-Smirnov test to demonstrate that the difference between the population means is statistically significant.
|
1 2 3 4 5 6 7 8 9 10 11 12 13 14 15 |
from numpy.random import seed from numpy.random import randint from scipy.stats import ks_2samp # generate results seed(1) n = 100 values1 = randint(50, 60, n) values2 = randint(55, 65, n) # calculate the significance value, pvalue = ks_2samp(values1, values2) print(value, pvalue) if pvalue > 0.05: print('Samples are likely drawn from the same distributions (fail to reject H0)') else: print('Samples are likely drawn from different distributions (reject H0)') |
Running the example prints the statistic and the p-value.
The p-value is very small, suggesting a near certainty that the difference between the two populations is significant.
|
1 2 |
0.47 2.16825856737e-10 Samples are likely drawn from different distributions (reject H0) |
Further Reading
This section lists some articles and resources to dive deeper into the area of statistical significance testing for applied machine learning.
- Normality test on Wikipedia
- Student’s t-test on Wikipedia
- Welch’s t-test on Wikipedia
- Kolmogorov–Smirnov test on Wikipedia
Summary
In this tutorial, you discovered how you can use statistical significance tests to interpret machine learning results.
You can use these tests to help you confidently choose one machine learning algorithm over another or one set of configuration parameters over another for the same algorithm.
You learned:
- How to use normality tests to check if your experimental results are Gaussian or not.
- How to use statistical tests to check if the difference between mean results is significant for Gaussian data with the same and different variance.
- How to use statistical tests to check if the difference between mean results is significant for non-Gaussian data.
Do you have any questions about this post or statistical significance tests?
Ask your questions in the comments below and I will do my best to answer.
Get a Handle on Statistics for Machine Learning!

Develop a working understanding of statistics
...by writing lines of code in python
Discover how in my new Ebook:
Statistical Methods for Machine Learning
It provides self-study tutorials on topics like:
Hypothesis Tests, Correlation, Nonparametric Stats, Resampling, and much more...
Discover how to Transform Data into Knowledge
Skip the Academics. Just Results.


")


This is fantastic. Very clear and detailed explanation, and including the full code is much appreciated.
One question — do you know the corresponding functions in R? Specifically, what’s the best way in R to test of a sample is normally distributed?
Thanks again for a great article
Thanks David.
Yes, R can do this. I do not know the functions off-hand sorry.
You state when considering the boxplots that “The results for A look better than B” can you explain what is better about A than B. To me that two plots are identical just offset by the difference in the mean.
Exactly, the means are different and we are assuming an error score, so a lower mean value means a better result.
Thanks Dr. Jason for the informative post. I have learned a lot from many of your posts!
I have a few comments and questions below.
1) I noticed that in both the sections “Compare Means for Gaussian Results” and “Compare Means for Gaussian Results with Different Variance” you have in the code: ‘pvalue = ttest_ind(values1, values2, equal_var=False’). Shouldn’t it be: ‘equal_var=True’ for the first section?
2) Also, in the section “Compare Means for Non-Gaussian Results”, you are using the Two-sample Kolmogorov-Smirnov test which according to Page 3 of the following document (http://www.mit.edu/~6.s085/notes/lecture5.pdf): “is sensitive to any differences at all in two distributions: two distributions with the same mean but significantly different shapes will produce a large value of Dn” [a significant result]. Therefore, getting a significant result only tells us they have different distributions but would not tell us which group is superior to the other as we’re not really comparing means as the section title indicates.
Instead of the Two-sample Kolmogorov-Smirnov test, wouldn’t it be better to do the Mann-Whitney U Test (aka Wilcoxon rank-sum test)? Similar to the Two-sample Kolmogorov-Smirnov test it is used to compare whether two groups have the same distribution. However, Page 3 of (http://www.mit.edu/~6.s085/notes/lecture5.pdf) states: “In contrast to the Kolmogorov-Smirnov test earlier, this test [referring to Wilcoxon’s signed-rank test] (like its unpaired cousin the Mann-Whitney U) is only sensitive to changes in the median, and not to changes in the shape”. Additionally, In R, you can add the ‘conf.int=TRUE’ argument to the Mann-Whitney U Test (‘wilcox.test’ in R) which would allow you to determine which group is superior in our case from a “median of pairwise differences” perspective (https://stats.stackexchange.com/questions/215764/significant-two-sided-wilcoxon-rank-sum-test-which-group-has-higher-median). There doesn’t seem to be a similar argument with the Two-sample Kolmogorov-Smirnov test (‘ks.test()’ in R).
3) When we are “comparing two different machine learning algorithms or when comparing the same algorithm with different configurations”. If we use the same group of 30 or 100 resamples for both algorithms or configurations, shouldn’t we use a paired t-test (for gaussian results) and a Wilcoxon signed-rank test (for non-gaussian results) instead? Effectively, we would be making 2 measurements (1 from each algorithm on the same subjects (resamples)). According to (http://emerald.tufts.edu/~gdallal/paired.htm): “When both measurements are made on the same subject, the between-subjects variability is eliminated from the comparison. The difference between treatments is compared to the way the difference changes from subject to subject. If this difference is roughly the same for each subject, small treatment effects can be detected even if different subjects respond quite differently.” This also gives us the ability to have a more powerful test using a smaller number of samples (algorithm runs on resamples) which saves computational time.
Hi Andrew,
Yes, that was a typo re the equal_var argument. Fixed.
Yes great suggestion. I am a big fan of reporting medians and using the Man-whitney U test.
Perhaps.
Very informative, thank you!
I’m glad you found it useful Viktor.
Hi Jason! Really useful article. Many thanks.
I want to ask: how exactly can you use this to select between models? I guess you use k-fold cross-validation, and the same folds are used in every model to make the comparison, but usually you don’t create too many folds (5 or 10, maybe). Are these tests still useful even if the sample is small?
Thanks again!
Great question Roberto.
Regardless of your resampling method (train/test or CV), evaluate your model many times (30+). Repeat with another algorithm or configuration, then compare the two populations of results.
Hi Dr. Brownlee!
Again a great and very informative tutorial!
I trained a LeNet on MNIST using Keras. Now on inference I get an accuracy of 98.7 over 10k images. I introduce some changes to network during inference and accuracy drops to 96.5. How should I run a significance test to prove that the changes introduced cause a significant effect on the network?
I was thinking of making 100 sets of test data with 100 images each and run baseline and modified network over it. Then I should use the techniques you described above to prove my hypothesis.
Is this the correct way to approach this?
Thanks
Good question.
One way would be to keep the model and train/test data constant and re-train n times, say 30 to get 30 accuracy scores, then repeat for another model. You can then compare the two populations of results to see if the mean is different and whether this difference is significant or not.
Hello sir….great post!!!
I have a query regarding using of statistical test to compare same model with different settings
Suppose I have trained a model with 10 features and got 58% accuracy on test set.
Now I test the same model with same parameters but with only 9 features this time nd got 53% accuracy.
1.How should I check using statistical test to show that difference in accuracy is statistical significant?
2. How can i apply one tailed paired t test in python for the same situation?
The suggestions in the tutorial above are a good start.
What problem are you having exactly?
As u said in above post…we need to repeat experiment 30 or more times to get population of accuracy scores. Dies that mean, in my case I need to repeat prediction on test set with 10 features 30 times nd similarly repeat 30 times with 9 features. So I get two different population of scores on which I can apply t test.
Is it correct?
Also I need to know which function in python to use to perform one tailed paired test ?
I have gone through paired test nd got to know ttest_rel( ) for paired t test.
Maybe, it really depends.
I have an example of using the t test here:
https://machinelearningmastery.com/parametric-statistical-significance-tests-in-python/
I have a post on significance tests for comparing algorithms here:
https://machinelearningmastery.com/statistical-significance-tests-for-comparing-machine-learning-algorithms/
That’s a great article, thanks – I’ve learned a lot.
I’ve got a couple of questions though.
What’s the best way to apply that to a classification problem? Compare the resulted classed (1, 0, 1, 0)? Or the results before the decision function is applied (0.23, 0.89, 0.66)?
And then, what if it is a non-binary classification problem?
Thanks again
We would look at populations of accuracy scores for classification – exactly as we do in the above post.
Does that help?
Oh, yeah, definitely! Sorry, the first time I read I mistakenly thought you were comparing the output of the classifiers instead of accuracy scores.
Thanks for the clarification!
No problem.
Hi Jason,
This tutorial is really helpful!
Could you provide any recommendation of books or papers about the methodology and significance testing techinques you’ve used?
Thanks a lot!
Yes, I am working on a book on the topic now. Should be available soon.
Generally, a modified paired student t-test is the go for evaluating accuracy from cross validation folds (see the Weka implementation). Alternately, 5 repeats of 2-fold CV with the paired student t test has low type II errors.
See this paper as a great place to start:
Thomas Dietterich, “Approximate Statistical Tests for Comparing Supervised Classi cation Learning Algorithms”, 1998.
http://citeseerx.ist.psu.edu/viewdoc/download?doi=10.1.1.37.3325&rep=rep1&type=pdf
Thank you very much!
Its funny how many works in my research area (Transportation Research) do not present statistical significance tests for machine learning experiments.
I was starting to think they would not be needed when your article convinced be to do so.
I just needed to find some academic reference in order to be more certain of this decision but was unable to find one. (Maybe was not using the right keyworkds)
Thanks for the article and the reference! I wish great success for your book and would be glad to read it when its available.
Thanks, I’m glad it helped Elton.
I hope to have more on the topic of statistical hypothesis testing soon.
Hi Jason the test is for the result is it necessary for the dataset to be normally distributed for training a neural network .??
how to check distribution of dataset ??
No, Gaussian is not required for non-linear methods like neural nets.
You can check the distribution by plotting a histogram of the variable.
Hello, I am also trying to find if there is any statistical significance between two classification tree algorithms result(bagging and random forest results on the same dataset). I will execute them multiple times to obtain two lists of accuracy results for each algorithm, and I want to do the t-test based on these accuracy results. Can I just do the test even though I have no gaussian distribution? If not, how should I move on with accuracy data?
See this tutorial:
https://machinelearningmastery.com/statistical-significance-tests-for-comparing-machine-learning-algorithms/
Hello,
I have a labelled dataset and would like to apply different classification algorithms. My goal is to choose the best classification algorithm. The dataset has many features. When I apply the t-test, which feature should I choose?
Thanks
This post describes how to compare model performance using hypothesis tests:
https://machinelearningmastery.com/statistical-significance-tests-for-comparing-machine-learning-algorithms/
Hey, if p value > 0.05 it means that you failed to reject the null it doesn’t mean that you will accept the null. The result will be inconclusive. So, you cann’t say that “It is likely to be normal distributtion.”
We never accept, we either reject or fail to reject.
Results are still probabilistic.
Hello Jason. This post helps me a lot in a project I am working on where I have to compare the performance of different models. However, if you want to compare the performance of a stochastic model with the one of a deterministic model, what do you need to do then? Do you have to use a non parametric test for two non-Gaussian distributions?
Perhaps use a bootstrap to estimate the performance of the deterministic model, then compare sample means?
Hello Jason
Thank you for the informative tutorial!
I have a question regarding the “Line Plot of p-value vs Sample Sizes” figure. It clearly has a maximum, but I would expect it is a monotonically decaying exponential function. What could be the explanation for the form of this function?
Hi Elie…I am not following your question. Can you elaborate?
Hey Jason,
Do you have any code on how to replicate an ML model? Or is it literally executing the code x number of times to compile a result set?