A trend is a continued increase or decrease in the series over time. There can be benefit in identifying, modeling, and even removing trend information from your time series dataset.
In this tutorial, you will discover how to model and remove trend information from time series data in Python.
After completing this tutorial, you will know:
The importance and types of trends that may exist in time series and how to identify them.
How to use a simple differencing method to remove a trend.
How to model a linear trend and remove it from a sales time series dataset.
Kick-start your project with my new book Time Series Forecasting With Python, including step-by-step tutorials and the Python source code files for all examples.
Let’s get started.
Updated Apr/2019: Updated the link to dataset.
How to Use and Remove Trend Information from Time Series Data in Python Photo by john78727, some rights reserved.
Trends in Time Series
A trend is a long-term increase or decrease in the level of the time series.
In general, a systematic change in a time series that does not appear to be periodic is known as a trend.
Identifying and understanding trend information can aid in improving model performance; below are a few reasons:
Faster Modeling: Perhaps the knowledge of a trend or lack of a trend can suggest methods and make model selection and evaluation more efficient.
Simpler Problem: Perhaps we can correct or remove the trend to simplify modeling and improve model performance.
More Data: Perhaps we can use trend information, directly or as a summary, to provide additional information to the model and improve model performance.
Types of Trends
There are all kinds of trends.
Two general classes that we may think about are:
Deterministic Trends: These are trends that consistently increase or decrease.
Stochastic Trends: These are trends that increase and decrease inconsistently.
In general, deterministic trends are easier to identify and remove, but the methods discussed in this tutorial can still be useful for stochastic trends.
We can think about trends in terms of their scope of observations.
Global Trends: These are trends that apply to the whole time series.
Local Trends: These are trends that apply to parts or subsequences of a time series.
Generally, global trends are easier to identify and address.
Identifying a Trend
You can plot time series data to see if a trend is obvious or not.
The difficulty is that in practice, identifying a trend in a time series can be a subjective process. As such, extracting or removing it from the time series can be just as subjective.
Create line plots of your data and inspect the plots for obvious trends.
Add linear and nonlinear trend lines to your plots and see if a trend is obvious.
Removing a Trend
A time series with a trend is called non-stationary.
An identified trend can be modeled. Once modeled, it can be removed from the time series dataset. This is called detrending the time series.
If a dataset does not have a trend or we successfully remove the trend, the dataset is said to be trend stationary.
Using Time Series Trends in Machine Learning
From a machine learning perspective, a trend in your data represents two opportunities:
Remove Information: To remove systematic information that distorts the relationship between input and output variables.
Add Information: To add systematic information to improve the relationship between input and output variables.
Specifically, a trend can be removed from your time series data (and data in the future) as a data preparation and cleaning exercise. This is common when using statistical methods for time series forecasting, but does not always improve results when using machine learning models.
Alternately, a trend can be added, either directly or as a summary, as a new input variable to the supervised learning problem to predict the output variable.
One or both approaches may be relevant for your time series forecasting problem and may be worth investigating.
Next, let’s take a look at a dataset that has a trend.
Stop learning Time Series Forecasting the slow way!
Take my free 7-day email course and discover how to get started (with sample code).
Click to sign-up and also get a free PDF Ebook version of the course.
Shampoo Sales Dataset
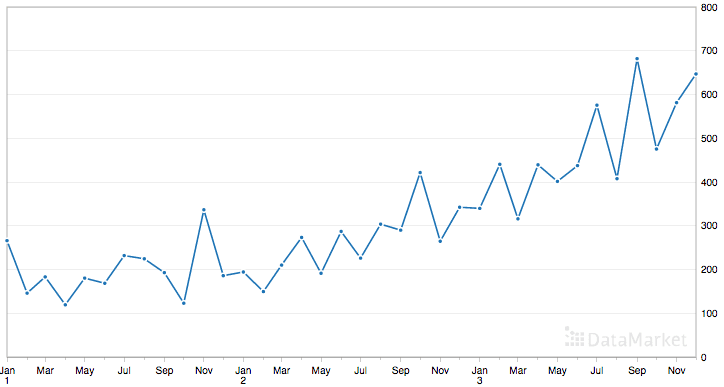
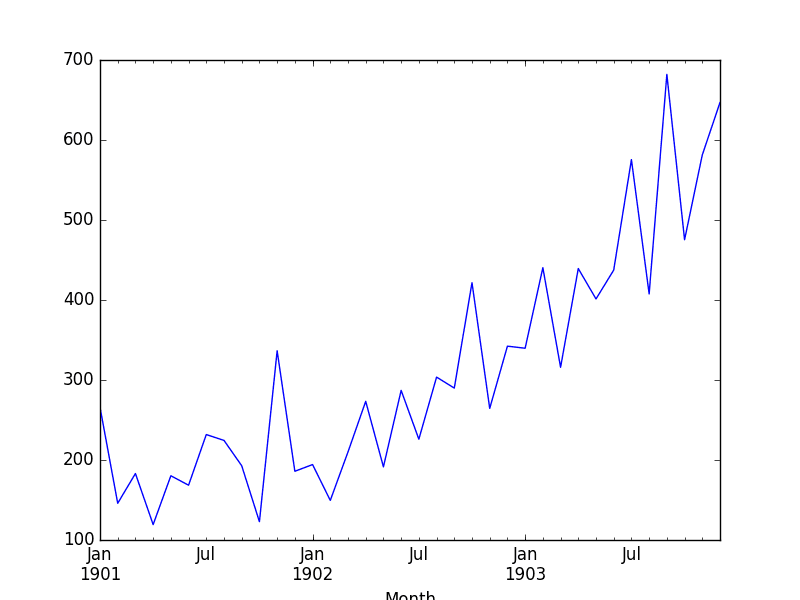
This dataset describes the monthly number of sales of shampoo over a 3 year period.
The units are a sales count and there are 36 observations. The original dataset is credited to Makridakis, Wheelwright, and Hyndman (1998).
Running the example loads the dataset and creates a plot.
Shampoo Sales Dataset Plot
Detrend by Differencing
Perhaps the simplest method to detrend a time series is by differencing.
Specifically, a new series is constructed where the value at the current time step is calculated as the difference between the original observation and the observation at the previous time step.
1
value(t) = observation(t) - observation(t-1)
This has the effect of removing a trend from a time series dataset.
We can create a new difference dataset in Python by implementing this directly. A new list of observations can be created.
Below is an example that creates the difference detrended version of the Shampoo Sales dataset.
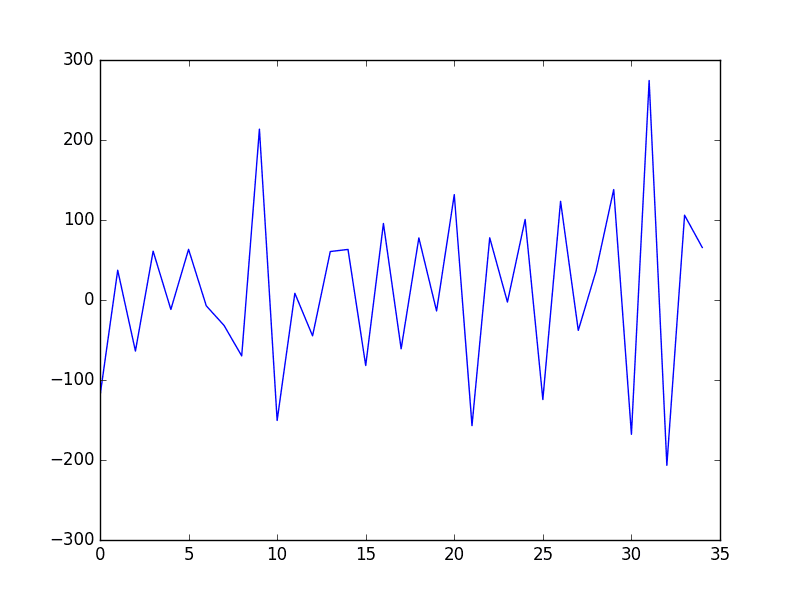
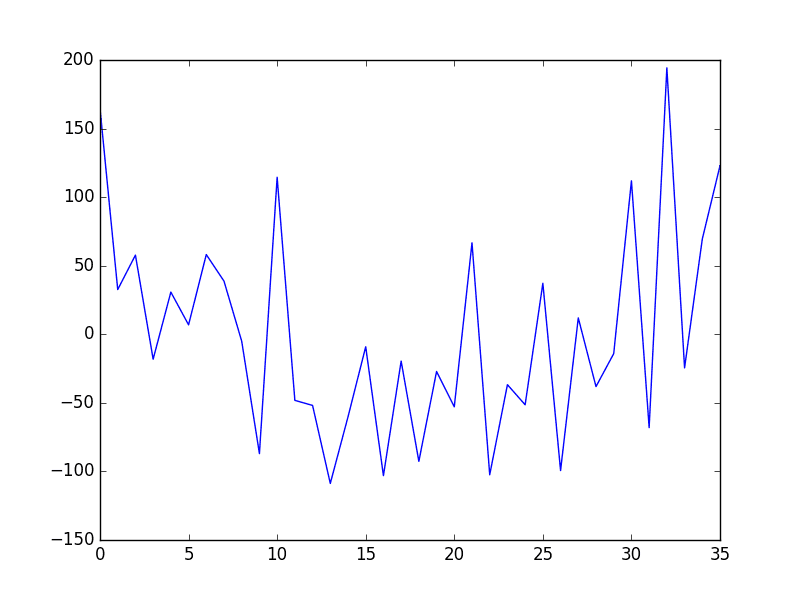
Running the example creates the new detrended dataset and then plots the time series.
Because no difference value can be created for the first observation (there is nothing for it to be subtracted from), the new dataset contains one less record. We can see that indeed the trend does appear to have been removed.
Shampoo Sales Dataset Difference Detrended
This approach works well for data with a linear trend. If the trend is quadratic (the change in the trend also increases or decreases), then a difference of the already-differenced dataset can be taken, a second level of differencing. This process can be further repeated if needed.
Because differencing only requires the observation at the previous time step, it can easily be applied to unseen out-of-sample data to either preprocess or provide an additional input for supervised learning.
Next, we will look at fitting a model to describe the trend.
Detrend by Model Fitting
A trend is often easily visualized as a line through the observations.
Linear trends can be summarized by a linear model, and nonlinear trends may be best summarized using a polynomial or other curve-fitting method.
Because of the subjective and domain-specific nature of identifying trends, this approach can help to identify whether a trend is present. Even fitting a linear model to a trend that is clearly super-linear or exponential can be helpful.
In addition to being used as a trend identification tool, these fit models can also be used to detrend a time series.
For example, a linear model can be fit on the time index to predict the observation. This dataset would look as follows:
1
2
3
4
5
6
X, y
1, obs1
2, obs2
3, obs3
4, obs4
5, obs5
The predictions from this model will form a straight line that can be taken as the trend line for the dataset. These predictions can also be subtracted from the original time series to provide a detrended version of the dataset.
1
value(t) = observation(t) - prediction(t)
The residuals from the fit of the model are a detrended form of the dataset. Polynomial curve fitting and other nonlinear models can also be used.
We can implement this in Python by training a scikit-learn LinearRegression model on the data.
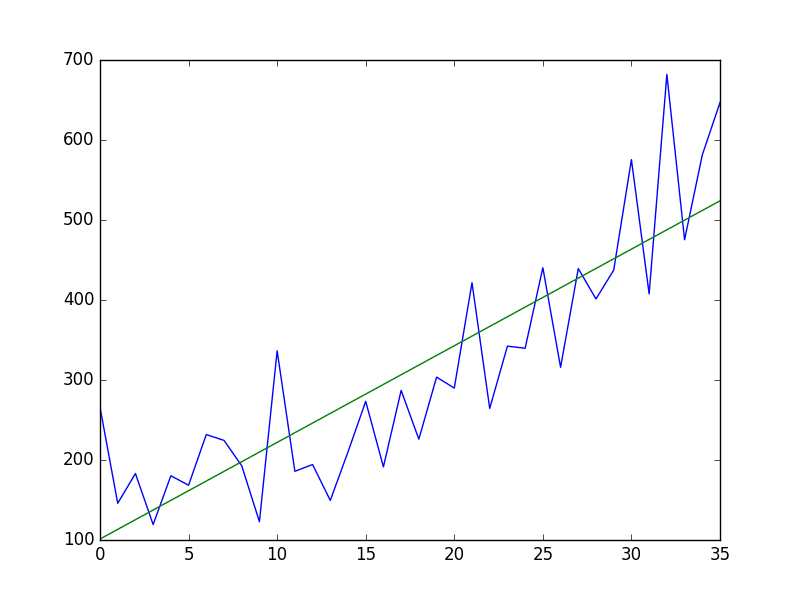
Running the example first fits the linear model to the integer-indexed observations and plots the trend line (green) over the original dataset (blue).
Shampoo Sales Dataset Plot With Trend
Next, the trend is subtracted from the original dataset and the resulting detrended dataset is plotted.
Shampoo Sales Dataset Model Detrended
Again, we can see that this approach has effectively detrended the dataset. There may be a parabola in the residuals, suggesting that perhaps a polynomial fit may have done a better job.
Because the trend model takes only the integer index of the observation as input, it can be used on new data to either detrend or provide a new input variable for the model.
Further Reading
Below are some additional resources on trend estimation and detrending in time series.
Really useful Jason. One question. Would the de-trended values be used as additional features or instead of the original features. Also, is it common to de-trend the target variable as well? If yes, do the de-trended values become the new target variable? If yes, then what is the process for obtaining full predictions from ML models (for sklearn at least, I’m guessing a custom transformer needs to store the removed trend and add it back in using inverse_transform).
The discussion in this post is for de-trending a univariate time series. If you wish to detrend a univariate time series, you would treat it as a suite of univariate time series and de-trend one at a time.
Very useful, thank you! I’m wondering if it is possible to give back the original trend to the detrended time series…do you know how I can do it? Thanks
I guess you can just start with the initial value of the original timeseries, and then recreate the original timeseries by adding each delta obtained with the differentiation.
Great tutorial! really thanks for such useful information. My question is, Is it possible to have linear and non-linear trend added to the same data set? If yes, Shall I remove the linear part first, then the non-linear part (which is a straight line fitted to the data and then subtract it) and then remove the non-linear part (fit a low-order polynomial to the signal and then subtract it)? Or just removing the non-linear part would be sufficient ??
Suppose the time series shows downward trend most of the times then subtracting from previous time stamp may result in a negative value. Perhaps simple moving averages can be used in this case..?
Perhaps. But what is wrong with negative values – you’re working in a transformed space. You can always reverse the transform on the prediction to get back to the original scale.
Dear Jason,
I followed your approach to detrend the time series data before fitting a neural network model on the training set.
I need to forecast hourly values for next day.
When I have to use my trained model to predict on unseen data, how do I deal with the trend ?
Do I have to predict the trend along with the the usual observations, as my model is trained on detrended data? Should this predicted trend be added to the predicted output of the trained model ?
Sir, I have a time series data obtained from integration of another data. The nature of data is exponentially decaying in amplitude with time. Would you please suggest me the process to obtain (identify) linear or non-linear trend (Equation of poly nomial) present in the derived time series data (i.e. obtained from integration of another data)?
Sir plzz give me any example i have a data of time series in 4 quarters.how i solve this “assuming the multiplicative model and using the movig average method,obtain the detrended time seies”??????
Really useful tutorial. Just wanted to inform you that Detrending Notes, GEOS 585A, Applied Time Series Analysis [PDF] in Further Reading section is not working. If possible, could you fix it please?
Jason,
Thank you for your incredible post.
So, in one of your LSTM posts, you used multivariate weather input features (x1,x2,x3,x4) to predict another weather parameter (Y). Should I also use detrending techniques for the input features which also have trends ( for example, suppose x1 and x4 have trend) ? If yes, I don’t feel confident about my results, as I’ve changed my input data to a new one. If no, maybe my model cannot predict well. What am I missing?
Hello Jason.
Thank you very much for great tutorial. I tried to apply diff to data via pandas diff, but with diff data model was not able to converge, I tried different topologies, neurons in layers etc. but with almost same result. But when I don’t modify data, fit is really good. Have you ever meet such issue, or could you know some good reading related to this topic?
Is there any well-known method for identifying the time series trend. As an example given a time series, the method should be able to give a value that says the series increasing, decreasing or stabilized (the value should represent the trend perfectly. some kind of a scale maybe 0-100, 0 for decreasing 100 for increasing at a higher rate, 50 for stable etc).
From your example, I can see that the fitted line can be used to come up with some value about the trend ( maybe using the gradient ). Is there any sophisticated way to do this?
Question – once the trend has been removed (as you have in your last image), one could use that detrended data to make some predictions with ARIMA. How would one interpret the predicted value? Let us assume it goes up by 2 ‘units’ in the next period = could expect an increase of 2 x the scale that was used in the original data set?
Hi Jason,
Thank you for this tutorial!
So, I am working on a problem where I need to incorporate time-independent features to make predictions for target variable that is time dependent.
I detrend the target (time-dependent) and I build a supervised ML model with features as the time-independent features. To the prediction of this model, I add back the trend.
Would this be the right way to go about it?
Does any of your other tutorial talk about it? Searched for it but couldn’t find it.
I wanted to ask if we are to detrend and deseasonalize, van’t we just use the seasonal_decompose() function, and extract the trend and seasonality components from it and leave the residual ?? Is the residual considered detrended and deseasonalized ?
Example
result = seasonal_decompose(self.series, model=’additive’, freq=frequency)
residual = result.resid # this is what I am reffering to.
It depends on your project, in general I recommend detrending and seasonal adjustment prior to modeling or as part of modeling in the case of methods like SARIMA.
Thanks for this post, Jason!
I was wondering, if I am performing an LSTM with multiple variables, and I observe a trend only for 2 out of the 5 variables,
1. do I detrend all 5 variables by differencing?
2. If one of them is categorical and I have coded it as(1,-1) does this have to be differnced as well?
Hi Jason,
If the goal is to forecast the future N timesteps of a timeseries showing a stochastic trend, then we should fit a model to approximate the trend, remove this approximated trend from the original data and use models such as ARIMA to predict there residuals. However, the final forecast will be Arima forecast + trend forecast.
The timeseries data I work with is not well approximated by a linear regression, it consists of random patterns with the trend going up and down at different amplitudes (like a random walk). I didn’t find yet a model which can approximated it well enough. What model do you recommend using for this kind of stochastic trend approximation?
Thanks!
Dear Jason
How can we use non linear regression for timeseries data detrending?
What is local regression for data detrending?
How can we use quadratic polynomial trend for detrending?
Please clarify me this.
Which software can be used for these all?
It seems like a stupid question but I did detrend my dataset according to your instructions and it worked out fine. However, I have trouble interpreting the detrended version mainly because the y-values are now negative and around zero. In my dataset i plot CO2-conc over time.
How can I have negative values for co2-conc?? I get that the data is transformed but I don’t know what it really means for my measured values.
I think I mistakenly used the notion transformed. I have not done any power transformation or similar with my data before I applied the linear model. I took the raw data, fitted the lm and then looked at the residuals plot and the data are partially negative and around 0. For example for the year 2010, I had 22.000 t co2 in my raw data and the value for the same year in my detrended data (residuals of lm) amounts to – 500. My question is if the detrended data as it is now, can be used e.g for a calculation of the expected value in decade 2010-2040.
Thank you very much for your time and quick reply!
Hi Jason,
I have a question on detrending for LSTM models. I removed the trend and seasonality from the input data using seasonal_decompose function. However, when I input this detrended data to LSTM endoder decoder model, training does not happen. The training loss and val_loss do not reduce from the first epoch. On the other hand, when I supply the normal data ( i.,e, without detrending), the model gets trained properly.
I am wondering if some other tweeks are needed to train on a detrended data using LSTM. Any thoughts / suggestions are appreciated.
Hi, My question is, How do we use the de-trended data/plot for building a model and forecasting? It seems we are changing the data-set here so our forecast by the model will be some undefined value. How do we get back to the data-set value (Sales/Joins/Lands/Clicks/etc) from the forecasted value?
Hello, this is a very informative article, may I ask how do you add a trend though? let’s say you’re simulating periodic data and want to test spectral analysis methods on trended data, how do you add a linear trend to make your simulated data look like the data in this article. Thanks in advance.
Senthilkumar RadhakrishnanAugust 22, 2022 at 11:03 pm#
Hi Jason,
Can we remove trend alone from the time series data, without affecting the seasonal pattern.
I have tried using differencing as well as removing trend section from seasonal decomposing techniques but they still remove the seasonal bump in the plot.
What can be done to remove the trend .
Really helpful post. I am working on multivariate problem where I am predicting Sales of a item. I want to include trend as a input in this supervised problem. How I can do that? How I can capture trend for Sales and add it as input for my model?
Really helpful post. I am working on multivariate problem where I am predicting Sales of a item. I want to include trend as a input in this supervised problem. How I can do that? How I can capture trend for Sales and add it as input for my model?


Really useful Jason. One question. Would the de-trended values be used as additional features or instead of the original features. Also, is it common to de-trend the target variable as well? If yes, do the de-trended values become the new target variable? If yes, then what is the process for obtaining full predictions from ML models (for sklearn at least, I’m guessing a custom transformer needs to store the removed trend and add it back in using inverse_transform).
Thank you!
Hi Carmen,
The discussion in this post is for de-trending a univariate time series. If you wish to detrend a univariate time series, you would treat it as a suite of univariate time series and de-trend one at a time.
The whole series may be de-trended and is used as input for a learning algorithm like ARIMA. See this post:
https://machinelearningmastery.com/arima-for-time-series-forecasting-with-python/
Alternatively, the detrended series may be used as an additional input for a machine learning algorithm.
Very useful, thank you! I’m wondering if it is possible to give back the original trend to the detrended time series…do you know how I can do it? Thanks
Yes, if the trend was removed with subtraction, it can be added with addition.
I guess you can just start with the initial value of the original timeseries, and then recreate the original timeseries by adding each delta obtained with the differentiation.
Would detrending technique improve ARIMA forecasting?
It can. Try it and see. ARIMA has it built in with the q var.
You mean the var ‘d’ ?
Hi Aman…Please clarify your question so that we may better assist you.
Great tutorial! really thanks for such useful information. My question is, Is it possible to have linear and non-linear trend added to the same data set? If yes, Shall I remove the linear part first, then the non-linear part (which is a straight line fitted to the data and then subtract it) and then remove the non-linear part (fit a low-order polynomial to the signal and then subtract it)? Or just removing the non-linear part would be sufficient ??
Interesting question. Generally, I would recommend trying both and see which model results in better forecasts.
Suppose the time series shows downward trend most of the times then subtracting from previous time stamp may result in a negative value. Perhaps simple moving averages can be used in this case..?
Perhaps. But what is wrong with negative values – you’re working in a transformed space. You can always reverse the transform on the prediction to get back to the original scale.
Thanks for your reply. This technique would fail for Poisson Auto regression model. Do you have any suggestions to detrending in event count models?
Not off-hand, sorry Weber.
Dear Jason,
I followed your approach to detrend the time series data before fitting a neural network model on the training set.
I need to forecast hourly values for next day.
When I have to use my trained model to predict on unseen data, how do I deal with the trend ?
Do I have to predict the trend along with the the usual observations, as my model is trained on detrended data? Should this predicted trend be added to the predicted output of the trained model ?
Thanks
Mamta
You can remove a trend by differencing. You can then invert the differencing after you have made a prediction.
See here:
https://machinelearningmastery.com/remove-trends-seasonality-difference-transform-python/
and here:
https://machinelearningmastery.com/difference-time-series-dataset-python/
Dear Jeson
Sir, I have a time series data obtained from integration of another data. The nature of data is exponentially decaying in amplitude with time. Would you please suggest me the process to obtain (identify) linear or non-linear trend (Equation of poly nomial) present in the derived time series data (i.e. obtained from integration of another data)?
Thanks
I don’t have an example. Perhaps you can use a power transform on the obs to stabilize the changing variance, then try removing the cycle?
Or perhaps you can use an scipy function call to model the exponential trend and remove it manually?
Perhaps explore a few approaches and see what looks good.
Dear Jason
Sir plzz give me any example i have a data of time series in 4 quarters.how i solve this “assuming the multiplicative model and using the movig average method,obtain the detrended time seies”??????
Sorry, I cannot write code for you. Perhaps hire a contractor?
Hi Jason,
Really useful tutorial. Just wanted to inform you that Detrending Notes, GEOS 585A, Applied Time Series Analysis [PDF] in Further Reading section is not working. If possible, could you fix it please?
Regards,
Rahul Sathyajit
Thanks, I’ve added a link to the page to learn more.
Jason,
Thank you for your incredible post.
So, in one of your LSTM posts, you used multivariate weather input features (x1,x2,x3,x4) to predict another weather parameter (Y). Should I also use detrending techniques for the input features which also have trends ( for example, suppose x1 and x4 have trend) ? If yes, I don’t feel confident about my results, as I’ve changed my input data to a new one. If no, maybe my model cannot predict well. What am I missing?
Ideally yes. LSTMs are sensitive to trends and seasonality.
Hello Jason
What is the best way to select the optimal subset(rows) to be trained by LSTM?
regards
Salah
Careful and systematic experimentation.
Hello Jason.
Thank you very much for great tutorial. I tried to apply diff to data via pandas diff, but with diff data model was not able to converge, I tried different topologies, neurons in layers etc. but with almost same result. But when I don’t modify data, fit is really good. Have you ever meet such issue, or could you know some good reading related to this topic?
Regards Jakub.
Yes, MLPs and CNNs seem to perform well even better when the data is non-stationary, at least in a few tests I performed.
Hi Janson,
Is there any well-known method for identifying the time series trend. As an example given a time series, the method should be able to give a value that says the series increasing, decreasing or stabilized (the value should represent the trend perfectly. some kind of a scale maybe 0-100, 0 for decreasing 100 for increasing at a higher rate, 50 for stable etc).
From your example, I can see that the fitted line can be used to come up with some value about the trend ( maybe using the gradient ). Is there any sophisticated way to do this?
Thank you.
Great tutorial. Big fan of this site…
Yes, the gradient, rise/run.
thanks for the tutorial!
Question – once the trend has been removed (as you have in your last image), one could use that detrended data to make some predictions with ARIMA. How would one interpret the predicted value? Let us assume it goes up by 2 ‘units’ in the next period = could expect an increase of 2 x the scale that was used in the original data set?
The trend can be added back to any predictions made and the interpretation would then be specific to the domain.
Hi Jason,
Thank you for this tutorial!
So, I am working on a problem where I need to incorporate time-independent features to make predictions for target variable that is time dependent.
I detrend the target (time-dependent) and I build a supervised ML model with features as the time-independent features. To the prediction of this model, I add back the trend.
Would this be the right way to go about it?
Does any of your other tutorial talk about it? Searched for it but couldn’t find it.
Thanks a lot for your help!
Perhaps add the new variables as exog variables for a time step.
Otherwise, perhaps use an ensemble model that combined predictions from a model on the time series and a model no the static data?
Hello Jason,
Thank you for the awesome tutorial!!
I wanted to ask if we are to detrend and deseasonalize, van’t we just use the seasonal_decompose() function, and extract the trend and seasonality components from it and leave the residual ?? Is the residual considered detrended and deseasonalized ?
Example
result = seasonal_decompose(self.series, model=’additive’, freq=frequency)
residual = result.resid # this is what I am reffering to.
Thanks in advance
Perhaps. It may not be reliable for your data. It is better to have more control and understand the structure of each.
So which is more reliable ? detrending and deseasonalizing or just extrating residual from seasonal_decompose()
It depends on your project, in general I recommend detrending and seasonal adjustment prior to modeling or as part of modeling in the case of methods like SARIMA.
Thanks for this post, Jason!
I was wondering, if I am performing an LSTM with multiple variables, and I observe a trend only for 2 out of the 5 variables,
1. do I detrend all 5 variables by differencing?
2. If one of them is categorical and I have coded it as(1,-1) does this have to be differnced as well?
Thanks a lot!
Try modeling the data directly, then with differencing on the series with trends to see if there is an impact.
For categorical vars, explore integer encode, one hot encode and perhaps embeddings.
Hi Jason,
Great post!
Can I check with you regarding the model fitting method.
When you mentioned subtracting the trend from the original data, is it the same as getting the residuals of the linear/quadratic/polynomial model?
Thanks!
Similar.
Hi Jason,
If the goal is to forecast the future N timesteps of a timeseries showing a stochastic trend, then we should fit a model to approximate the trend, remove this approximated trend from the original data and use models such as ARIMA to predict there residuals. However, the final forecast will be Arima forecast + trend forecast.
The timeseries data I work with is not well approximated by a linear regression, it consists of random patterns with the trend going up and down at different amplitudes (like a random walk). I didn’t find yet a model which can approximated it well enough. What model do you recommend using for this kind of stochastic trend approximation?
Thanks!
Typically an ARIMA can remove the trend for you via the d parameter.
I recommend testing a suite of linear and non-linear models in order to discover what works best for your specific dataset:
https://machinelearningmastery.com/how-to-develop-a-skilful-time-series-forecasting-model/
Hi, I run the code on Python and I dont know why this function kept showing error datetime.strptime. Is that possible to write in another way?
Sorry to hear that, perhaps this will help:
https://machinelearningmastery.com/faq/single-faq/why-does-the-code-in-the-tutorial-not-work-for-me
Dear Jason
How can we use non linear regression for timeseries data detrending?
What is local regression for data detrending?
How can we use quadratic polynomial trend for detrending?
Please clarify me this.
Which software can be used for these all?
You can use scipy to implement each, perhaps the above example can provide a useful starting point for your experiments.
Hi Jason,
It seems like a stupid question but I did detrend my dataset according to your instructions and it worked out fine. However, I have trouble interpreting the detrended version mainly because the y-values are now negative and around zero. In my dataset i plot CO2-conc over time.
How can I have negative values for co2-conc?? I get that the data is transformed but I don’t know what it really means for my measured values.
I’d be very happy to hear from you.
Bests
Laila
Yes, you must invert the transform on any predictions so that you can interpret the result.
I believe the example in this post will help with inverting the process:
https://machinelearningmastery.com/machine-learning-data-transforms-for-time-series-forecasting/
I think I mistakenly used the notion transformed. I have not done any power transformation or similar with my data before I applied the linear model. I took the raw data, fitted the lm and then looked at the residuals plot and the data are partially negative and around 0. For example for the year 2010, I had 22.000 t co2 in my raw data and the value for the same year in my detrended data (residuals of lm) amounts to – 500. My question is if the detrended data as it is now, can be used e.g for a calculation of the expected value in decade 2010-2040.
Thank you very much for your time and quick reply!
Perhaps try it and see.
Hi Jason,
I have a question on detrending for LSTM models. I removed the trend and seasonality from the input data using seasonal_decompose function. However, when I input this detrended data to LSTM endoder decoder model, training does not happen. The training loss and val_loss do not reduce from the first epoch. On the other hand, when I supply the normal data ( i.,e, without detrending), the model gets trained properly.
I am wondering if some other tweeks are needed to train on a detrended data using LSTM. Any thoughts / suggestions are appreciated.
Rgds,
Aji
You may need to tune the model architecture and learning hyperparameters to your prepared data.
Hi, My question is, How do we use the de-trended data/plot for building a model and forecasting? It seems we are changing the data-set here so our forecast by the model will be some undefined value. How do we get back to the data-set value (Sales/Joins/Lands/Clicks/etc) from the forecasted value?
You can remove a trend by using a differencing transform – as described in the above tutorial.
Hello, this is a very informative article, may I ask how do you add a trend though? let’s say you’re simulating periodic data and want to test spectral analysis methods on trended data, how do you add a linear trend to make your simulated data look like the data in this article. Thanks in advance.
Hi M. Mossad…The following may be of interest:
https://towardsdatascience.com/time-series-analysis-creating-synthetic-datasets-cf008208e014
Hi Jason,
Can we remove trend alone from the time series data, without affecting the seasonal pattern.
I have tried using differencing as well as removing trend section from seasonal decomposing techniques but they still remove the seasonal bump in the plot.
What can be done to remove the trend .
Thanks in advance ,
really appreciate your work.
HI Jason,
Really helpful post. I am working on multivariate problem where I am predicting Sales of a item. I want to include trend as a input in this supervised problem. How I can do that? How I can capture trend for Sales and add it as input for my model?
Thanks in advance,
HI Jason,
Really helpful post. I am working on multivariate problem where I am predicting Sales of a item. I want to include trend as a input in this supervised problem. How I can do that? How I can capture trend for Sales and add it as input for my model?
Thanks in advance,
Hi nehapawar…For this purpose you could leave the original time-series data with trend information. That is…simply do not remove it.