Time series forecasting can be challenging as there are many different methods you could use and many different hyperparameters for each method.
The Prophet library is an open-source library designed for making forecasts for univariate time series datasets. It is easy to use and designed to automatically find a good set of hyperparameters for the model in an effort to make skillful forecasts for data with trends and seasonal structure by default.
In this tutorial, you will discover how to use the Facebook Prophet library for time series forecasting.
After completing this tutorial, you will know:
Prophet is an open-source library developed by Facebook and designed for automatic forecasting of univariate time series data.
How to fit Prophet models and use them to make in-sample and out-of-sample forecasts.
How to evaluate a Prophet model on a hold-out dataset.
Let’s get started.
Time Series Forecasting With Prophet in Python Photo by Rinaldo Wurglitsch, some rights reserved.
Tutorial Overview
This tutorial is divided into three parts; they are:
Prophet Forecasting Library
Car Sales Dataset
Load and Summarize Dataset
Load and Plot Dataset
Forecast Car Sales With Prophet
Fit Prophet Model
Make an In-Sample Forecast
Make an Out-of-Sample Forecast
Manually Evaluate Forecast Model
Prophet Forecasting Library
Prophet, or “Facebook Prophet,” is an open-source library for univariate (one variable) time series forecasting developed by Facebook.
Implements a procedure for forecasting time series data based on an additive model where non-linear trends are fit with yearly, weekly, and daily seasonality, plus holiday effects
It is designed to be easy and completely automatic, e.g. point it at a time series and get a forecast. As such, it is intended for internal company use, such as forecasting sales, capacity, etc.
For a great overview of Prophet and its capabilities, see the post:
The library provides two interfaces, including R and Python. We will focus on the Python interface in this tutorial.
The first step is to install the Prophet library using Pip, as follows:
1
sudo pip install fbprophet
Next, we can confirm that the library was installed correctly.
To do this, we can import the library and print the version number in Python. The complete example is listed below.
1
2
3
4
# check prophet version
import fbprophet
# print version number
print('Prophet %s'%fbprophet.__version__)
Running the example prints the installed version of Prophet.
You should have the same version or higher.
1
Prophet 0.5
Now that we have Prophet installed, let’s select a dataset we can use to explore using the library.
Car Sales Dataset
We will use the monthly car sales dataset.
It is a standard univariate time series dataset that contains both a trend and seasonality. The dataset has 108 months of data and a naive persistence forecast can achieve a mean absolute error of about 3,235 sales, providing a lower error limit.
No need to download the dataset as we will download it automatically as part of each example.
Prophet requires data to be in Pandas DataFrames. Therefore, we will load and summarize the data using Pandas.
We can load the data directly from the URL by calling the read_csv() Pandas function, then summarize the shape (number of rows and columns) of the data and view the first few rows of data.
Running the example first reports the number of rows and columns, then lists the first five rows of data.
We can see that as we expected, there are 108 months worth of data and two columns. The first column is the date and the second is the number of sales.
Note that the first column in the output is a row index and is not a part of the dataset, just a helpful tool that Pandas uses to order rows.
1
2
3
4
5
6
7
(108, 2)
Month Sales
0 1960-01 6550
1 1960-02 8728
2 1960-03 12026
3 1960-04 14395
4 1960-05 14587
Load and Plot Dataset
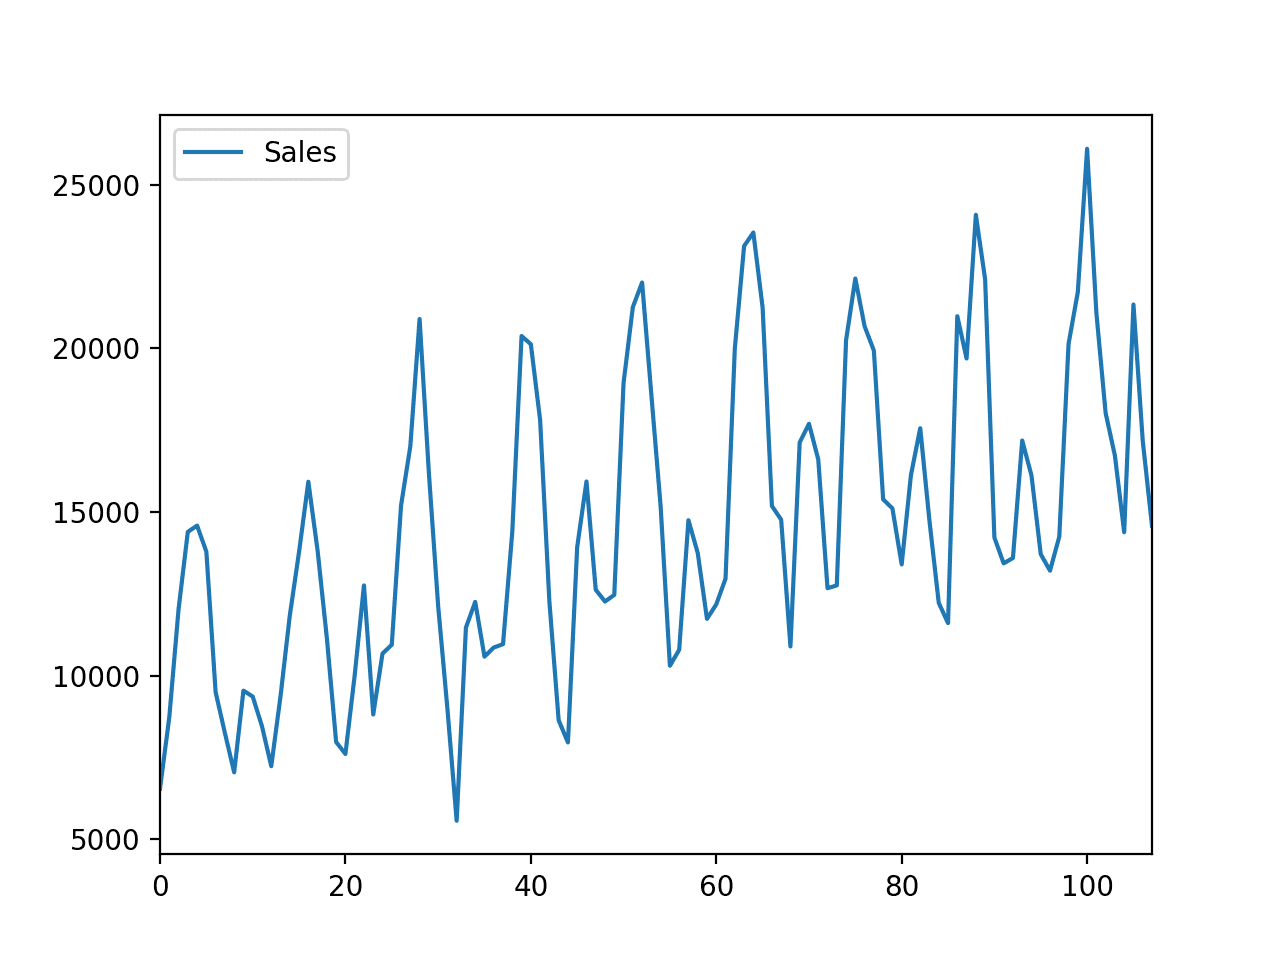
A time-series dataset does not make sense to us until we plot it.
Plotting a time series helps us actually see if there is a trend, a seasonal cycle, outliers, and more. It gives us a feel for the data.
We can plot the data easily in Pandas by calling the plot() function on the DataFrame.
Running the example creates a plot of the time series.
We can clearly see the trend in sales over time and a monthly seasonal pattern to the sales. These are patterns we expect the forecast model to take into account.
Line Plot of Car Sales Dataset
Now that we are familiar with the dataset, let’s explore how we can use the Prophet library to make forecasts.
Forecast Car Sales With Prophet
In this section, we will explore using the Prophet to forecast the car sales dataset.
Let’s start by fitting a model on the dataset
Fit Prophet Model
To use Prophet for forecasting, first, a Prophet() object is defined and configured, then it is fit on the dataset by calling the fit() function and passing the data.
The Prophet() object takes arguments to configure the type of model you want, such as the type of growth, the type of seasonality, and more. By default, the model will work hard to figure out almost everything automatically.
The fit() function takes a DataFrame of time series data. The DataFrame must have a specific format. The first column must have the name ‘ds‘ and contain the date-times. The second column must have the name ‘y‘ and contain the observations.
This means we change the column names in the dataset. It also requires that the first column be converted to date-time objects, if they are not already (e.g. this can be down as part of loading the dataset with the right arguments to read_csv).
For example, we can modify our loaded car sales dataset to have this expected structure, as follows:
1
2
3
4
...
# prepare expected column names
df.columns=['ds','y']
df['ds']=to_datetime(df['ds'])
The complete example of fitting a Prophet model on the car sales dataset is listed below.
Running the example loads the dataset, prepares the DataFrame in the expected format, and fits a Prophet model.
By default, the library provides a lot of verbose output during the fit process. I think it’s a bad idea in general as it trains developers to ignore output.
Nevertheless, the output summarizes what happened during the model fitting process, specifically the optimization processes that ran.
1
2
3
4
5
6
7
8
9
10
11
12
13
14
15
INFO:fbprophet:Disabling weekly seasonality. Run prophet with weekly_seasonality=True to override this.
INFO:fbprophet:Disabling daily seasonality. Run prophet with daily_seasonality=True to override this.
Initial log joint probability = -4.39613
Iter log prob ||dx|| ||grad|| alpha alpha0 # evals Notes
99 270.121 0.00413718 75.7289 1 1 120
Iter log prob ||dx|| ||grad|| alpha alpha0 # evals Notes
Iter log prob ||dx|| ||grad|| alpha alpha0 # evals Notes
300 270.3 8.25604e-09 74.4478 0.3522 0.3522 456
Optimization terminated normally:
Convergence detected: absolute parameter change was below tolerance
I will not reproduce this output in subsequent sections when we fit the model.
Next, let’s make a forecast.
Make an In-Sample Forecast
It can be useful to make a forecast on historical data.
That is, we can make a forecast on data used as input to train the model. Ideally, the model has seen the data before and would make a perfect prediction.
Nevertheless, this is not the case as the model tries to generalize across all cases in the data.
This is called making an in-sample (in training set sample) forecast and reviewing the results can give insight into how good the model is. That is, how well it learned the training data.
A forecast is made by calling the predict() function and passing a DataFrame that contains one column named ‘ds‘ and rows with date-times for all the intervals to be predicted.
There are many ways to create this “forecast” DataFrame. In this case, we will loop over one year of dates, e.g. the last 12 months in the dataset, and create a string for each month. We will then convert the list of dates into a DataFrame and convert the string values into date-time objects.
1
2
3
4
5
6
7
8
9
...
# define the period for which we want a prediction
future=list()
foriinrange(1,13):
date='1968-%02d'%i
future.append([date])
future=DataFrame(future)
future.columns=['ds']
future['ds']=to_datetime(future['ds'])
This DataFrame can then be provided to the predict() function to calculate a forecast.
The result of the predict() function is a DataFrame that contains many columns. Perhaps the most important columns are the forecast date time (‘ds‘), the forecasted value (‘yhat‘), and the lower and upper bounds on the predicted value (‘yhat_lower‘ and ‘yhat_upper‘) that provide uncertainty of the forecast.
For example, we can print the first few predictions as follows:
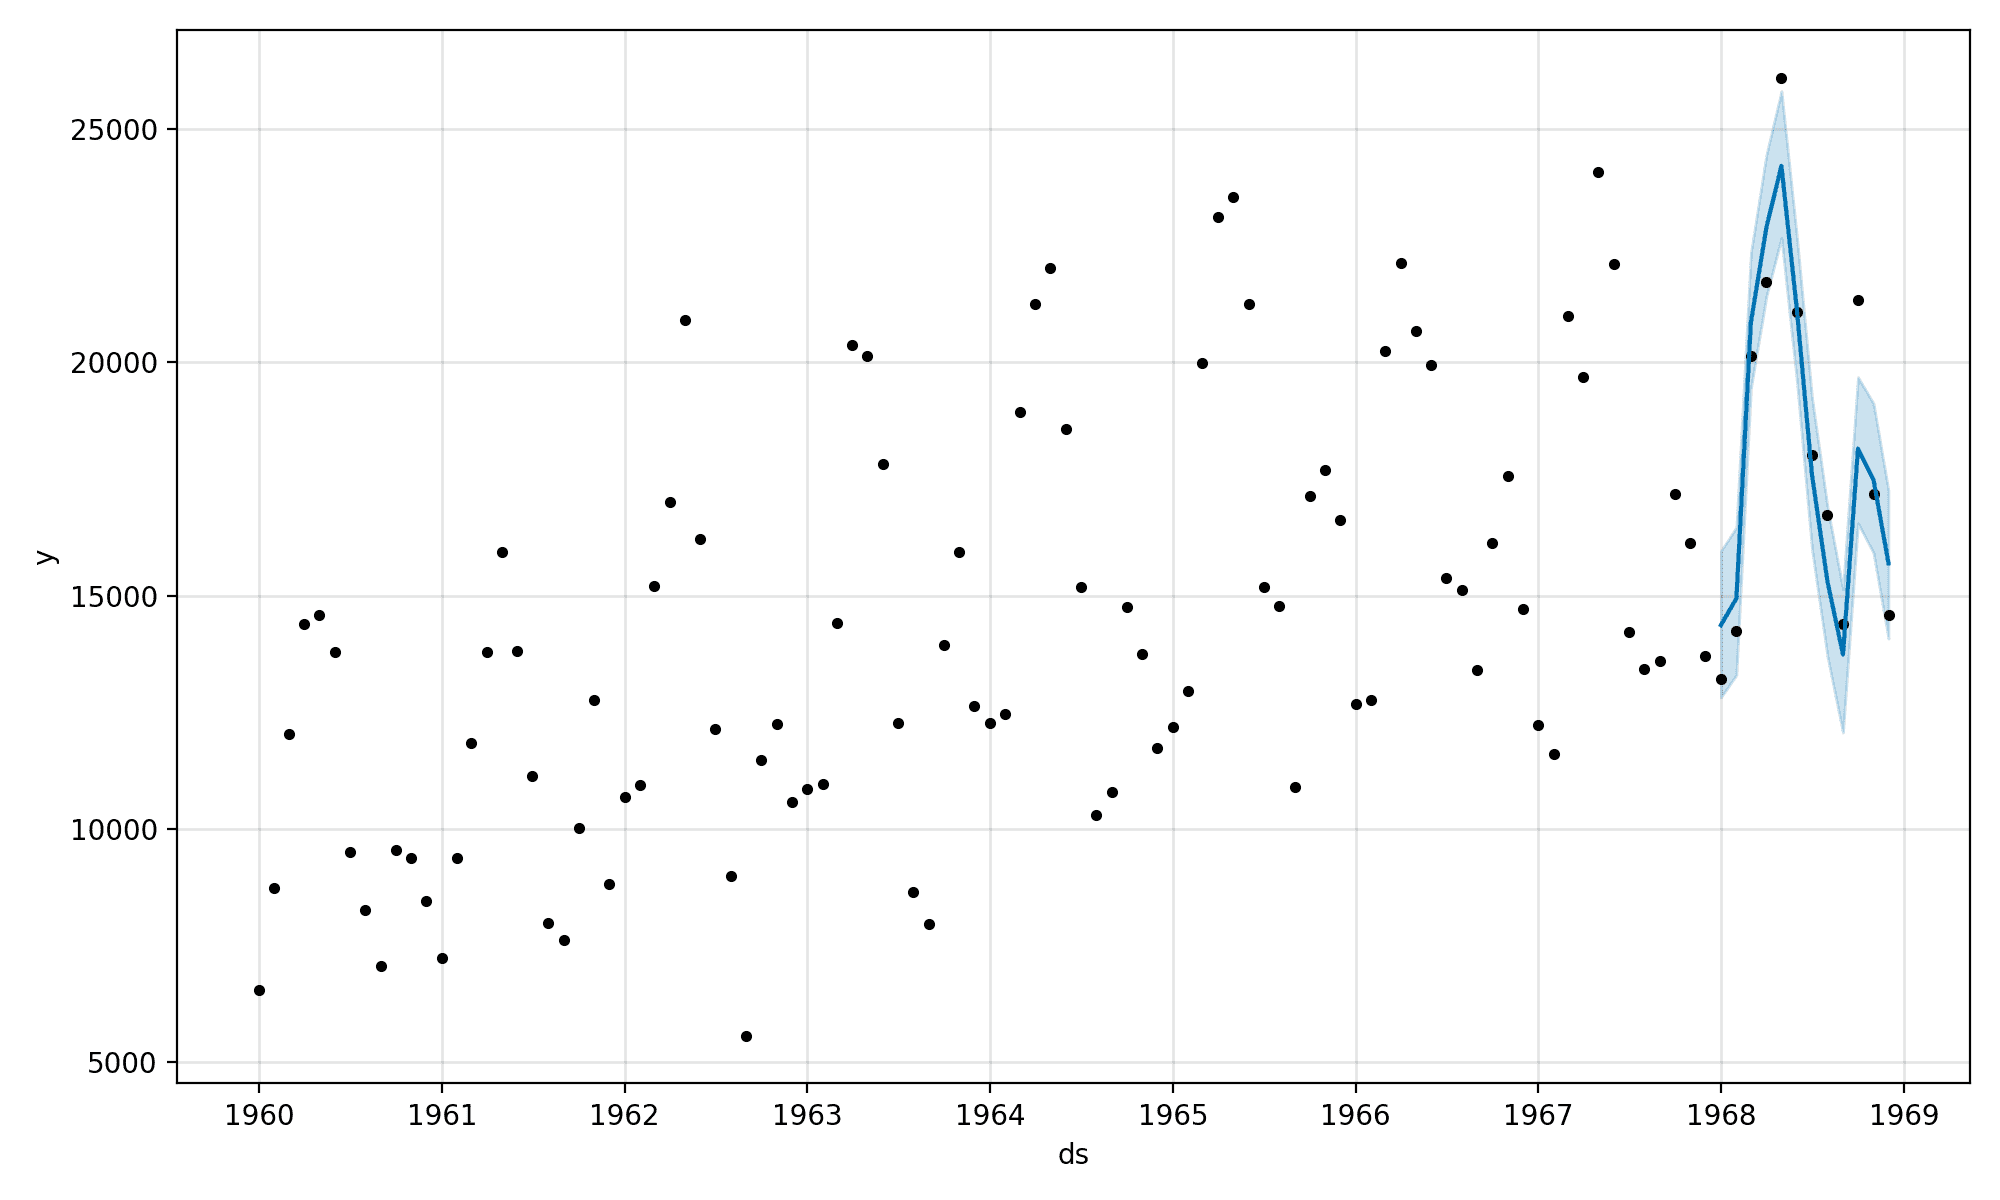
Prophet also provides a built-in tool for visualizing the prediction in the context of the training dataset.
This can be achieved by calling the plot() function on the model and passing it a result DataFrame. It will create a plot of the training dataset and overlay the prediction with the upper and lower bounds for the forecast dates.
Next, a plot is created. We can see the training data are represented as black dots and the forecast is a blue line with upper and lower bounds in a blue shaded area.
We can see that the forecasted 12 months is a good match for the real observations, especially when the bounds are taken into account.
Plot of Time Series and In-Sample Forecast With Prophet
Make an Out-of-Sample Forecast
In practice, we really want a forecast model to make a prediction beyond the training data.
This is called an out-of-sample forecast.
We can achieve this in the same way as an in-sample forecast and simply specify a different forecast period.
In this case, a period beyond the end of the training dataset, starting 1969-01.
1
2
3
4
5
6
7
8
9
...
# define the period for which we want a prediction
future=list()
foriinrange(1,13):
date='1969-%02d'%i
future.append([date])
future=DataFrame(future)
future.columns=['ds']
future['ds']=to_datetime(future['ds'])
Tying this together, the complete example is listed below.
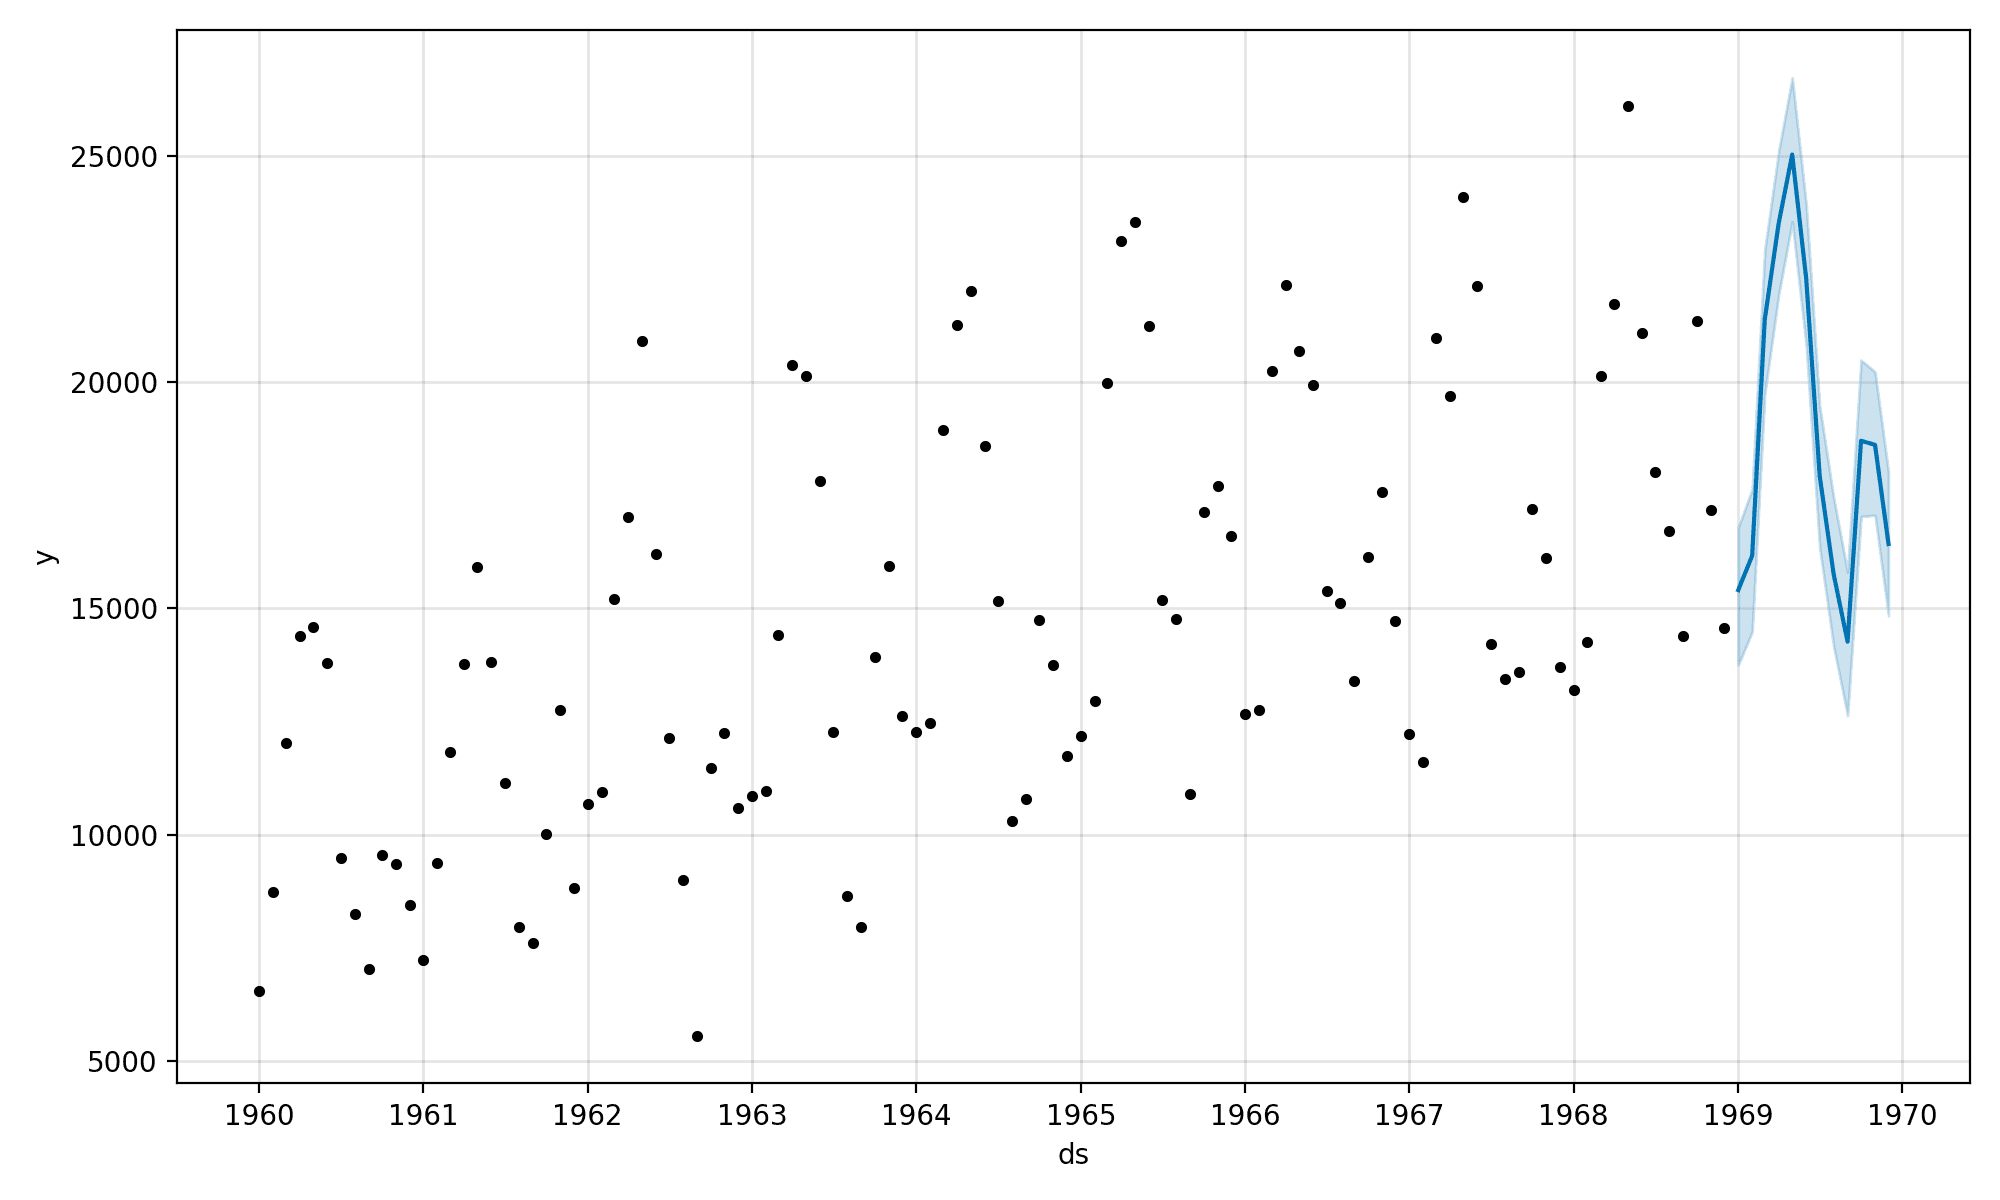
A plot is created to help us evaluate the prediction in the context of the training data.
The new one-year forecast does look sensible, at least by eye.
Plot of Time Series and Out-of-Sample Forecast With Prophet
Manually Evaluate Forecast Model
It is critical to develop an objective estimate of a forecast model’s performance.
This can be achieved by holding some data back from the model, such as the last 12 months. Then, fitting the model on the first portion of the data, using it to make predictions on the held-pack portion, and calculating an error measure, such as the mean absolute error across the forecasts. E.g. a simulated out-of-sample forecast.
The score gives an estimate of how well we might expect the model to perform on average when making an out-of-sample forecast.
We can do this with the samples data by creating a new DataFrame for training with the last 12 months removed.
1
2
3
4
...
# create test dataset, remove last 12 months
train=df.drop(df.index[-12:])
print(train.tail())
A forecast can then be made on the last 12 months of date-times.
We can then retrieve the forecast values and the expected values from the original dataset and calculate a mean absolute error metric using the scikit-learn library.
1
2
3
4
5
6
...
# calculate MAE between expected and predicted values for december
y_true=df['y'][-12:].values
y_pred=forecast['yhat'].values
mae=mean_absolute_error(y_true,y_pred)
print('MAE: %.3f'%mae)
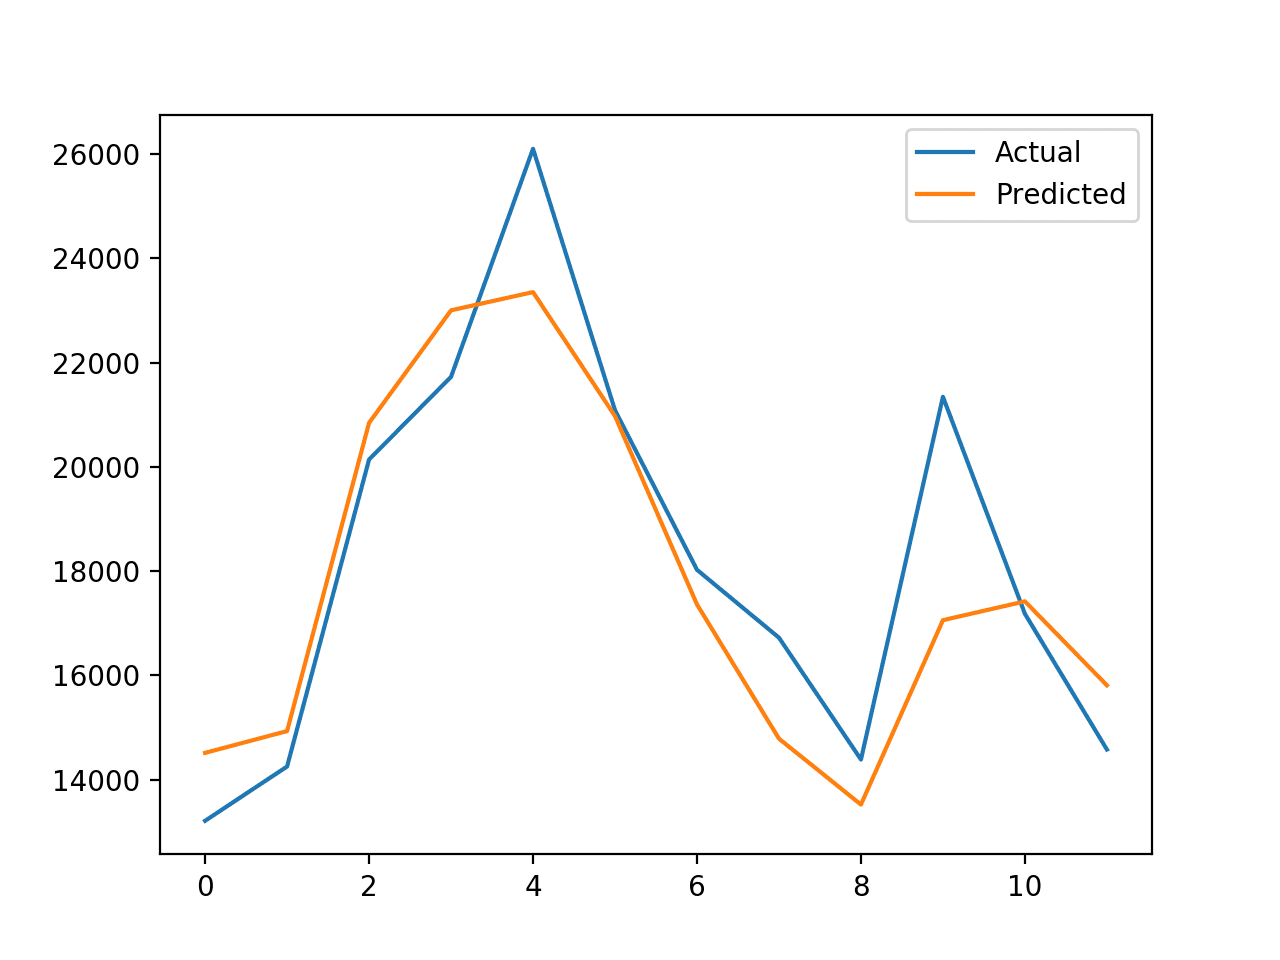
It can also be helpful to plot the expected vs. predicted values to see how well the out-of-sample prediction matches the known values.
1
2
3
4
5
6
...
# plot expected vs actual
pyplot.plot(y_true,label='Actual')
pyplot.plot(y_pred,label='Predicted')
pyplot.legend()
pyplot.show()
Tying this together, the example below demonstrates how to evaluate a Prophet model on a hold-out dataset.
1
2
3
4
5
6
7
8
9
10
11
12
13
14
15
16
17
18
19
20
21
22
23
24
25
26
27
28
29
30
31
32
33
34
35
36
37
38
39
40
# evaluate prophet time series forecasting model on hold out dataset
# define the period for which we want a prediction
future=list()
foriinrange(1,13):
date='1968-%02d'%i
future.append([date])
future=DataFrame(future)
future.columns=['ds']
future['ds']=to_datetime(future['ds'])
# use the model to make a forecast
forecast=model.predict(future)
# calculate MAE between expected and predicted values for december
y_true=df['y'][-12:].values
y_pred=forecast['yhat'].values
mae=mean_absolute_error(y_true,y_pred)
print('MAE: %.3f'%mae)
# plot expected vs actual
pyplot.plot(y_true,label='Actual')
pyplot.plot(y_pred,label='Predicted')
pyplot.legend()
pyplot.show()
Running the example first reports the last few rows of the training dataset.
It confirms the training ends in the last month of 1967 and 1968 will be used as the hold-out dataset.
1
2
3
4
5
6
ds y
91 1967-08-01 13434
92 1967-09-01 13598
93 1967-10-01 17187
94 1967-11-01 16119
95 1967-12-01 13713
Next, a mean absolute error is calculated for the forecast period.
In this case we can see that the error is approximately 1,336 sales, which is much lower (better) than a naive persistence model that achieves an error of 3,235 sales over the same period.
1
MAE: 1336.814
Finally, a plot is created comparing the actual vs. predicted values. In this case, we can see that the forecast is a good fit. The model has skill and forecast that looks sensible.
Plot of Actual vs. Predicted Values for Last 12 Months of Car Sales
The Prophet library also provides tools to automatically evaluate models and plot results, although those tools don’t appear to work well with data above one day in resolution.
Further Reading
This section provides more resources on the topic if you are looking to go deeper.
1. I have hourly weather data set (hourly_date , temp , press, wind-direction ) for 10 years
2.I want to forcast all these features hourly for one year in the future
is that possible ?
wich are the best way to do that .
thanks .
Apologies, I see the OP wanted a multivariate forecast, not univariate with external regressors. So correct, Prophet does not support multivariate forecasts.
Your program using fbprophet does not run: Here are the errors:
INFO:numexpr.utils:NumExpr defaulting to 8 threads.
INFO:fbprophet:Disabling weekly seasonality. Run prophet with weekly_seasonality=True to override this.
INFO:fbprophet:Disabling daily seasonality. Run prophet with daily_seasonality=True to override this.
—————————————————————————
KeyError Traceback (most recent call last)
KeyError: ‘metric_file’
A Vector Auto Regressive (VAR) model will be more appropriate if we want to do build a Multivariate Time Series Forecasting Model. For bivariate time series forecasting, we can do a Granger – Causality.
Test a suite of algorithms and algorithm configurations on your dataset and discover what works best, then use that. There is no method to algorithm selection that is more reliable.
FBProphet is not an implementation of ARIMA, from their paper:
At its core, the Prophet procedure is an additive regression model with four main components:
A piecewise linear or logistic growth curve trend. Prophet automatically detects changes in trends by selecting changepoints from the data.
A yearly seasonal component modeled using Fourier series.
A weekly seasonal component using dummy variables.
A user-provided list of important holidays.
..
We prefer to use a very flexible regression model (somewhat like curve-fitting) instead of a traditional time series model
To my knowledge for time series forecasting, a series needs to be stationary. The series should have a constant mean, variance, and covariance. Also I am not seeing normalization and standardization re-scaling apply to the dataset.
Hola tengo una data diaria de ingresos con con síntomas respiratorios unos días ingresan más otros menos es fluctuante para el cálculo puedo utilizar el prophet para la data de entrenamiento sería colocar el 75% del total de los días q tengo el dato q sería 120 dias o q me puedes recomendar para pronosticar los ingresos en los próximos 15dias porque el dato tengo desde marzo 2020
Hey Robert, have you tried it with conda? I don’t see any issue with conda install -c conda-forge fbprophet=0.6 installation on Windows in our CI pipelines, neither when testing the library, that uses prophet on my private laptop…
Dear Dr Jason,
I wish to share my experience of install fbprophet.
One of the pre-requisites is the installation of pystan.
For some reason which I cannot explain, installing the latest of pystan v2.19.1.1 would successfully install, BUT it would not instantiate in either the IDE Python or the command line python.
You would get a DLL error in either the IDE Python version or the command line version EVEN when you supposedly install via pipping: pip install pystan.
If you tried to pip fbprophet, you would get a lot of errors during the install.
A work-around was to use lower version of the pystan.
1
2
3
4
rem-thiscauses todirectly download andinstall pystan butalower version than2.19.1.1
pip uninstall pystan
pip–no-cache-dir install pystan==2.17
pip--no-cache-dir install fbprophet
When I instantiate fbprophet in Python’s IDLE:
1
2
3
import fbprophet
fbprophet.__version__
'0.6'
Observations:
* version 2.17 of pystan worked. The file is 36MB compared to version 2.19.1.1 which is 79MB.
* the lower version of pystan did not have any adverse effect on the running of fbprophet especially where fbprophet.__version__ = 0.6 compared to the version 0.5 used in the tutorial.
Conclusion:
If you are having trouble installing fbprophet because it installed version 2.19.1.1 of pystan, then use a lower version of pystan such as version 2.17.
1
2
3
pip uninstall pystan
pip–no-cache-dir install pystan==2.17
pip--no-cache-dir install fbprophet
As a result I did not have any trouble completing the exercises in this tutorial.
At issue is whether you are using pystan for other packages. I cannot comment on the other applications using pystan.
Just wanted to say I very much agree with this line: “By default, the library provides a lot of verbose output during the fit process. I think it’s a bad idea in general as it trains developers to ignore output.” Thanks for writing.
Lots of open-source projects do this. Even tensorflow, keras, and scikit-learn. It’s like the develops have never written user-facing software.
It’s a terrible practice for developers (they become blind to real problems) and users (they never ever ever ever want to see this stuff). Also logging it is a waste of time, no one checks logs unless all hell is breaking lose and by then its too late anyway.
I get emails every week from new developers asking what they did wrong when tensorflow spews pages of warnings. I have to tell them it’s not their fault.
I am getting some negative values of yhat(predictions). Is there any way to get rid of them in the predictions,since in my use case negatively predicted values do not make sense.
Thanks for the suggestion, but my worry was that even after giving a lower cap as 0 in the logistic growth curve model in fbprophet , I was still getting negative values in forecasts.
I debugged a little and found that the cap values in the logistic growth curve model only influence the “trend” component of the time series. Thus if we are getting negative values in our final forecasts, we need to artificially cap them to 0.
Hi Jason, if I get you right; Facebook Prophet does not necessarily require that a time series be made stationary as it handles that for us. Am I right?
I am having a problem with the ‘in sample’ plots. Although both my actual and predicted data set contains the data required to plot the in-sample, the actuals are not being plotted, but the ‘predictions’ are, making the plot look like an ‘out-sample’ plot.
pip does not need sudo
only if you want to make an installation for all users
other than for that you’re giving away superuser permissions for no reason.
I have a question, what does it mean if the yhat_lower and yhat_upper have the same value? my settings are :
model = Prophet(
mcmc_samples=0,
interval_width=0.20,
uncertainty_samples=True,
yearly_seasonality=False,
weekly_seasonality=False,
daily_seasonality=False)
I have been playing around with the intervals but the bounds of lower and upper are still the same.
Thank you for such a helpful platform. I learn a lot from your post and trying to explore more.
Recently, I had a problem and posting this comment in the hope of a quick response.
Actually, I have data for a year (single data per minute>> 525602 samples). I am trying to check the accuracy level for the different test set (e.g. hour, week, month) with Make an In-Sample Forecast model. However, I had an issue to run the code related to the string. I think I made a mistake to define the period. Actually, I wrote as follow for the 1 month of test set:
for i in range(1, 30*24*60):
date = ‘2019-12-01-00 %02d’ % i
future.append([date])
Here, 30*24*60 is the total samples for 1 month. I tried a lot by changing the position, but always failed with different errors (some time related to the string, some time format, and some time over data size)
Could you please suggest me, how can I correct it?
– installing fbprophet library I got an error with “plotly” on my Mac. I fix it installing:
“% sudo pip install –upgrade plotly”.
– I apply Sklearn MinMaxScaler to scale the ‘y’ df column serie. But I got exactly the same ‘MAE’ results. So my conclusion is that Prophet model apply internally this/or equivalent standardisation.
– I compare these prophet evaluation ( I use ‘rmse’ instead as common metric) vs other classical ‘statsmodels’ such as AutoReg, AR, ARMA, ARIMA, SARIMA, SimpleExpSmothing and ExponentialSmothing …and the best results is with classical SARIMA model . SARIMA model is even better than LSTM DL model. I found Prophet model something in between all models (e.g.mean)
2º) Comments:
– One to the key issue (some time hard to explain) of time series (in my opinion) vs other ML techniques is, preparing data and its confusing associate terminology (inputs/features with multiple time steps/lags on univariate/multivariate vs outputs (multiple time steps forecast). I see the ‘ds’ time format column on prophet model application, but also I read other tutorials from you with its equivalent data preparation function of ‘TimeseriesGenerator’ from keras and also I like very much your function ‘series_to_supervised’ that split or shift multivariate on an uni/multivariate multistep (lags on inputs) and multiple-steps forecast (i found very powerful input-output splitting function).
3º) Questions:
– may we save/load prophet model as an options, as it is the case on keras model with .h5 file?
– may we plot prophet (image) model as an option, as it is is the case on Keras with plot_model() function?
– may we choose how many time steps (or lags) to use as argument of time series prophet model? Or it is nor an user option?
Due to bad expectation on Deep Learning performance on Time series (normally under classical and simpler statistics results) …some recent techniques apply to transform from time domain to another one (e.g. via ‘cosine transformation’).
Do you have more info on it?
Are they referring to DCT (Discrete Cosine Transformation) that convert time domain representation to frequency domain representation … I am confused about these possibilities. I appreciate to hear your opinion (and/or references) on this matter.
Hey Thanks a lot for such a wonderful explanation but I am getting negative forecast for FBProphet when regressor are added in the model. Please help me with this.
Nice blog post! I’ve learnt so much from this and am trying to follow through the steps on a different data. I can’t understand why but I come across with parser error for the code below:
future[‘ds’]= to_datetime(future[‘ds’])
It said Unknown string format: 2019-0000001. Is this something wrong with my date format?
Hi Jason,
Your tutorials are always fabulous and the example above is worked. But I don’t understand what exactly the differences between LSTM and I wanna know if features can do something in prophet? For instance, if we also have data about the driving license and so on, will it be useful?
I was running 18k+ iterations of auto arima (over 500k rows grouped by 18k unique IDs: each ID made of 28 observations) using forecast and auto.arima functions in R. 15 minutes to get it done. But when I used Python (I tried with both pmdarima and fbprophet libraries) it takes hours. So many hours that I had to kill the execution each time I tried. The code is fine and it works with few samples, but run on the entire dataset it dies.
As I said, just 15 minutes using R. Woud you know why that is happening? All I want is to run auto arima in python grouping by 18k distinct groups made of 28 observations each. Would you have any suggestions?
Hi Jason!
I am using monthly data to estimate the model, and I will be making a forecast for the next month, and compare it against the real value in order to understand if the real value is within normal range. Every month I will repeat the process: do a forecast for the next month and compare it against the real value.
I was wondering if you recommend that every month I re-estimate the model incorporating into the model the last monthly value, or should just use the model that was originally estimated to the next month forecast?
Thanks a lot,
Karla
I am trying to forecast sales for multiple vendors with univariate data, I see few vendors forecast is pretty good(few of them had trend and few of them have no trend or seasonality) and most of the vendors forecast is very bad. I see most of the vendors sales don’t have any trend or seasonality but model able to predict better for 15 to 20% of vendors and rest of the 80% prediction failed.
My question here is , Is it must to have trend or seasonality in the dataset in order to qualify for Time series forecasting(bcz few vendors do not have trend or seasonality but they performing better with prophet forecast). Also let me know other qualifiers for dataset for Timeseries forecasting.


Hi,
1. I have hourly weather data set (hourly_date , temp , press, wind-direction ) for 10 years
2.I want to forcast all these features hourly for one year in the future
is that possible ?
wich are the best way to do that .
thanks .
Perhaps develop a prototype and see?
Note that Prophet only supports univariate data.
Actually Prophet supports external regressors through the add_regressors method.
https://facebook.github.io/prophet/docs/seasonality,_holiday_effects,_and_regressors.html#additional-regressors
Great tip, thanks!
Apologies, I see the OP wanted a multivariate forecast, not univariate with external regressors. So correct, Prophet does not support multivariate forecasts.
Perhaps look into the R package BSTS.
Your program using fbprophet does not run: Here are the errors:
INFO:numexpr.utils:NumExpr defaulting to 8 threads.
INFO:fbprophet:Disabling weekly seasonality. Run prophet with weekly_seasonality=True to override this.
INFO:fbprophet:Disabling daily seasonality. Run prophet with daily_seasonality=True to override this.
—————————————————————————
KeyError Traceback (most recent call last)
KeyError: ‘metric_file’
Sorry to hear that you are having trouble, perhaps these tips will help:
https://machinelearningmastery.com/faq/single-faq/why-does-the-code-in-the-tutorial-not-work-for-me
This happened to me when I was trying to use Prophet on Jupyter. The solution was installing it using the Anaconda Power Shell.
A Vector Auto Regressive (VAR) model will be more appropriate if we want to do build a Multivariate Time Series Forecasting Model. For bivariate time series forecasting, we can do a Granger – Causality.
Is it possible to use this model using sckitlearn pipeline?
Good question.
I don’t know off hand. I would guess no, but try and see.
Hey Abbas, you might look at HCrystalBall, that among other libraries wraps also prophet to sklearns interface.
https://github.com/heidelbergcement/hcrystalball
Thanks for sharing Michal!
Is this another implementation of ARIMA?
Is there anything we should know when to use Prophet vs. ARIMA?
Statsmodels provides a useful implementation of ARIMA and SARIMA, for example:
https://machinelearningmastery.com/how-to-grid-search-sarima-model-hyperparameters-for-time-series-forecasting-in-python/
Test a suite of algorithms and algorithm configurations on your dataset and discover what works best, then use that. There is no method to algorithm selection that is more reliable.
FBProphet is not an implementation of ARIMA, from their paper:
At its core, the Prophet procedure is an additive regression model with four main components:
A piecewise linear or logistic growth curve trend. Prophet automatically detects changes in trends by selecting changepoints from the data.
A yearly seasonal component modeled using Fourier series.
A weekly seasonal component using dummy variables.
A user-provided list of important holidays.
..
We prefer to use a very flexible regression model (somewhat like curve-fitting) instead of a traditional time series model
To my knowledge for time series forecasting, a series needs to be stationary. The series should have a constant mean, variance, and covariance. Also I am not seeing normalization and standardization re-scaling apply to the dataset.
Is it i am missing something ???
It can help and is even recommended to make a series stationary and normalized, not required.
Also, some implementations will perform these steps for you.
Hola tengo una data diaria de ingresos con con síntomas respiratorios unos días ingresan más otros menos es fluctuante para el cálculo puedo utilizar el prophet para la data de entrenamiento sería colocar el 75% del total de los días q tengo el dato q sería 120 dias o q me puedes recomendar para pronosticar los ingresos en los próximos 15dias porque el dato tengo desde marzo 2020
I recommend testing a suite of different data transform, algorithms and algorithm configurations on your dataset and discover what works well or best.
Apparently there are known issues installing pystan and fbprophet on a windows machine.
Sorry to hear that.
Perhaps try a linux virtual machine locally?
https://machinelearningmastery.com/linux-virtual-machine-machine-learning-development-python-3/
Perhaps try an AWS EC2 instance?
https://machinelearningmastery.com/develop-evaluate-large-deep-learning-models-keras-amazon-web-services/
Good post Jason!
I wonder if you ‘ve posted something about multivariate forecasting. Maybe Vector Autoregression (VAR) ? https://www.statsmodels.org/dev/vector_ar.html
Regards
Yes, this is a good place to start:
https://machinelearningmastery.com/time-series-forecasting-methods-in-python-cheat-sheet/
Hey Robert, have you tried it with conda? I don’t see any issue with conda install -c conda-forge fbprophet=0.6 installation on Windows in our CI pipelines, neither when testing the library, that uses prophet on my private laptop…
You better to use google colab,
I tried hard to get anaconda Spyder working, no success
It works fine with me when shifted to colab
I recommend using a text editor like sublime, not notebooks or IDEs:
https://machinelearningmastery.com/faq/single-faq/why-dont-use-or-recommend-notebooks
Dear Dr Jason,
I wish to share my experience of install fbprophet.
One of the pre-requisites is the installation of pystan.
For some reason which I cannot explain, installing the latest of pystan v2.19.1.1 would successfully install, BUT it would not instantiate in either the IDE Python or the command line python.
You would get a DLL error in either the IDE Python version or the command line version EVEN when you supposedly install via pipping: pip install pystan.
If you tried to pip fbprophet, you would get a lot of errors during the install.
A work-around was to use lower version of the pystan.
When I instantiate fbprophet in Python’s IDLE:
Observations:
* version 2.17 of pystan worked. The file is 36MB compared to version 2.19.1.1 which is 79MB.
* the lower version of pystan did not have any adverse effect on the running of fbprophet especially where fbprophet.__version__ = 0.6 compared to the version 0.5 used in the tutorial.
Conclusion:
If you are having trouble installing fbprophet because it installed version 2.19.1.1 of pystan, then use a lower version of pystan such as version 2.17.
As a result I did not have any trouble completing the exercises in this tutorial.
At issue is whether you are using pystan for other packages. I cannot comment on the other applications using pystan.
Thank you,
Anthony of Sydney
Great tip Anthony, thank you for sharing!
Another option might be installing it from conda. e.g. conda-forge with fbprophet=0.6 works for us on all operating systems.
conda install -c conda-forge fbprophet=0.6
Great tip.
Hi Jason,
Just wanted to say I very much agree with this line: “By default, the library provides a lot of verbose output during the fit process. I think it’s a bad idea in general as it trains developers to ignore output.” Thanks for writing.
Thank you Sam!!!
Lots of open-source projects do this. Even tensorflow, keras, and scikit-learn. It’s like the develops have never written user-facing software.
It’s a terrible practice for developers (they become blind to real problems) and users (they never ever ever ever want to see this stuff). Also logging it is a waste of time, no one checks logs unless all hell is breaking lose and by then its too late anyway.
I get emails every week from new developers asking what they did wrong when tensorflow spews pages of warnings. I have to tell them it’s not their fault.
Rant over 🙂
Hi Jason,
I am getting some negative values of yhat(predictions). Is there any way to get rid of them in the predictions,since in my use case negatively predicted values do not make sense.
Perhaps use the absolute() numpy function.
Hi Jason,
Thanks for the suggestion, but my worry was that even after giving a lower cap as 0 in the logistic growth curve model in fbprophet , I was still getting negative values in forecasts.
I debugged a little and found that the cap values in the logistic growth curve model only influence the “trend” component of the time series. Thus if we are getting negative values in our final forecasts, we need to artificially cap them to 0.
Nice finding.
Hi Jason, if I get you right; Facebook Prophet does not necessarily require that a time series be made stationary as it handles that for us. Am I right?
I believe it will capture the trend and seasonality as part of the model, much like ETS and SARIMA.
Hi Jason,
I am having a problem with the ‘in sample’ plots. Although both my actual and predicted data set contains the data required to plot the in-sample, the actuals are not being plotted, but the ‘predictions’ are, making the plot look like an ‘out-sample’ plot.
Do you have experience with this problem? Thanks
You can use a line plot from matplotlib to plot anything you like, perhaps start here:
https://machinelearningmastery.com/time-series-data-visualization-with-python/
pip does not need sudo
only if you want to make an installation for all users
other than for that you’re giving away superuser permissions for no reason.
thanks for the good tutorial anyway 🙂
Thanks.
I have a question, what does it mean if the yhat_lower and yhat_upper have the same value? my settings are :
model = Prophet(
mcmc_samples=0,
interval_width=0.20,
uncertainty_samples=True,
yearly_seasonality=False,
weekly_seasonality=False,
daily_seasonality=False)
I have been playing around with the intervals but the bounds of lower and upper are still the same.
It means that the model is very certain about the prediction, or is broken 🙂
Hello Jason Brownlee,
Thank you for such a helpful platform. I learn a lot from your post and trying to explore more.
Recently, I had a problem and posting this comment in the hope of a quick response.
Actually, I have data for a year (single data per minute>> 525602 samples). I am trying to check the accuracy level for the different test set (e.g. hour, week, month) with Make an In-Sample Forecast model. However, I had an issue to run the code related to the string. I think I made a mistake to define the period. Actually, I wrote as follow for the 1 month of test set:
for i in range(1, 30*24*60):
date = ‘2019-12-01-00 %02d’ % i
future.append([date])
Here, 30*24*60 is the total samples for 1 month. I tried a lot by changing the position, but always failed with different errors (some time related to the string, some time format, and some time over data size)
Could you please suggest me, how can I correct it?
Sorry to hear that. I don’t have good off the cuff advice, perhaps try posting your question to stackoverflow.com
Hi Jason,
Great tutorial!. Thanks.
I share my:
1º) Experiments:
– installing fbprophet library I got an error with “plotly” on my Mac. I fix it installing:
“% sudo pip install –upgrade plotly”.
– I apply Sklearn MinMaxScaler to scale the ‘y’ df column serie. But I got exactly the same ‘MAE’ results. So my conclusion is that Prophet model apply internally this/or equivalent standardisation.
– I compare these prophet evaluation ( I use ‘rmse’ instead as common metric) vs other classical ‘statsmodels’ such as AutoReg, AR, ARMA, ARIMA, SARIMA, SimpleExpSmothing and ExponentialSmothing …and the best results is with classical SARIMA model . SARIMA model is even better than LSTM DL model. I found Prophet model something in between all models (e.g.mean)
2º) Comments:
– One to the key issue (some time hard to explain) of time series (in my opinion) vs other ML techniques is, preparing data and its confusing associate terminology (inputs/features with multiple time steps/lags on univariate/multivariate vs outputs (multiple time steps forecast). I see the ‘ds’ time format column on prophet model application, but also I read other tutorials from you with its equivalent data preparation function of ‘TimeseriesGenerator’ from keras and also I like very much your function ‘series_to_supervised’ that split or shift multivariate on an uni/multivariate multistep (lags on inputs) and multiple-steps forecast (i found very powerful input-output splitting function).
3º) Questions:
– may we save/load prophet model as an options, as it is the case on keras model with .h5 file?
– may we plot prophet (image) model as an option, as it is is the case on Keras with plot_model() function?
– may we choose how many time steps (or lags) to use as argument of time series prophet model? Or it is nor an user option?
regards,
Well done on your experiments!
I would expect you can save/load a model, I have not tried it with this lib though – so experiments may be required.
I don’t think you can plot the internals of the model like keras.
Not sure about lags, I think it is optimized as part of the fit. You may need to check the API docs.
thank you Jason!
you provide great value and a lot of trust on ML practices!
Thank you!
Hi Jason,
One more question.
Due to bad expectation on Deep Learning performance on Time series (normally under classical and simpler statistics results) …some recent techniques apply to transform from time domain to another one (e.g. via ‘cosine transformation’).
Do you have more info on it?
Are they referring to DCT (Discrete Cosine Transformation) that convert time domain representation to frequency domain representation … I am confused about these possibilities. I appreciate to hear your opinion (and/or references) on this matter.
Not at this stage, perhaps in the future.
Hi Jason,
Are you going to update your Time Series Book with projects using Prophet in the near future?
Regards
Jeharul
No plans at this stage.
Hey Thanks a lot for such a wonderful explanation but I am getting negative forecast for FBProphet when regressor are added in the model. Please help me with this.
Perhaps you can use an alternate model configuration?
Perhaps you can use an alternate model?
Perhaps you can pre-process your data, e.g. scaling?
Nice blog post! I’ve learnt so much from this and am trying to follow through the steps on a different data. I can’t understand why but I come across with parser error for the code below:
future[‘ds’]= to_datetime(future[‘ds’])
It said Unknown string format: 2019-0000001. Is this something wrong with my date format?
Thanks so much for this, Jason!
Thanks.
Perhaps you will need to adapt the code for your data, e.g. parse the date-time column in a different way.
Thank you for these great tutorial, it works well for me.
Could someone show me how to save the forecast in a CSV file? That would really help me. Many Thanks!
You’re welcome.
Yes, see this:
https://machinelearningmastery.com/how-to-save-a-numpy-array-to-file-for-machine-learning/
Hi Jason,
Your tutorials are always fabulous and the example above is worked. But I don’t understand what exactly the differences between LSTM and I wanna know if features can do something in prophet? For instance, if we also have data about the driving license and so on, will it be useful?
I recommend evaluating a suite of different models and discover what works well or best for your specific dataset.
Hi Jason,
Just did a quick check on previous comments, not sure if this is mentioned:
I’m running an Anaconda environment.
From the Anaconda base environment cli,
pystan installs fine and it lists in the package list no problem (current version 2.19.1.1)
pip install prophet doesn’t work, get a ton of errors.
However, the following does work:
conda install -c conda-forge prophet
When I import prophet, got the following alert:
“Importing plotly failed. Interactive plots will not work”
So did pip install plotly in the base environment and now everything works fine!
Current prophet version is 1.0
It’s no longer fbprophet, just prophet
Regards
Yes, the name changed at version 1.0
Hi !
Is it normal to use Prophet in a walk forward or a rolling forecast methods ? You just fit and predict accordingly ?
Regards
Hi Jason.
I was running 18k+ iterations of auto arima (over 500k rows grouped by 18k unique IDs: each ID made of 28 observations) using forecast and auto.arima functions in R. 15 minutes to get it done. But when I used Python (I tried with both pmdarima and fbprophet libraries) it takes hours. So many hours that I had to kill the execution each time I tried. The code is fine and it works with few samples, but run on the entire dataset it dies.
As I said, just 15 minutes using R. Woud you know why that is happening? All I want is to run auto arima in python grouping by 18k distinct groups made of 28 observations each. Would you have any suggestions?
Thanks
Al
Hi Jason!
I am using monthly data to estimate the model, and I will be making a forecast for the next month, and compare it against the real value in order to understand if the real value is within normal range. Every month I will repeat the process: do a forecast for the next month and compare it against the real value.
I was wondering if you recommend that every month I re-estimate the model incorporating into the model the last monthly value, or should just use the model that was originally estimated to the next month forecast?
Thanks a lot,
Karla
Hi Karla…While I cannot speak directly to your project, your proposed method is a very reasonable one.
Hi, James. I just wanna appreciate your replies to everyone no matter how long it goes. Give you a like!
Hi Jason,
I am trying to forecast sales for multiple vendors with univariate data, I see few vendors forecast is pretty good(few of them had trend and few of them have no trend or seasonality) and most of the vendors forecast is very bad. I see most of the vendors sales don’t have any trend or seasonality but model able to predict better for 15 to 20% of vendors and rest of the 80% prediction failed.
My question here is , Is it must to have trend or seasonality in the dataset in order to qualify for Time series forecasting(bcz few vendors do not have trend or seasonality but they performing better with prophet forecast). Also let me know other qualifiers for dataset for Timeseries forecasting.
Hi Kumar…The following resources may be of interest to you:
https://www.analyticsvidhya.com/blog/2021/07/time-series-forecasting-complete-tutorial-part-1/
https://machinelearningmastery.com/how-to-develop-lstm-models-for-time-series-forecasting/
Hi! any way to store the forecasts into a data frame & then onto an excel?
Hi Tuhina…The following resource may be of interest:
https://www.dataquest.io/blog/tutorial-time-series-analysis-with-pandas/
Is there any to tune the hyperparameter of Prophet model? like Grid search or something else.
Hi Md…the following discussion may be of interest:
https://stackoverflow.com/questions/69856048/hyperparameter-tuning-fb-prophet-model-how-to-reference-m-add-seasonality-cate
!pip install prophet #instead of fpprophet for the example to work on Google Colab
from prophet import Prophet
Thank you Mahyar for your suggestion!
Sometimes, the Prophet’s in-sample forecasts are the same as the actuals (like an artifact). Does anyone know why?
Hi Chen…It seems in those cases that overtraining is occuring. The following resource may be of interest:
https://machinelearningmastery.com/early-stopping-to-avoid-overtraining-neural-network-models/