The statistical power of a hypothesis test is the probability of detecting an effect, if there is a true effect present to detect.
Power can be calculated and reported for a completed experiment to comment on the confidence one might have in the conclusions drawn from the results of the study. It can also be used as a tool to estimate the number of observations or sample size required in order to detect an effect in an experiment.
In this tutorial, you will discover the importance of the statistical power of a hypothesis test and now to calculate power analyses and power curves as part of experimental design.
After completing this tutorial, you will know:
Statistical power is the probability of a hypothesis test of finding an effect if there is an effect to be found.
A power analysis can be used to estimate the minimum sample size required for an experiment, given a desired significance level, effect size, and statistical power.
How to calculate and plot power analysis for the Student’s t test in Python in order to effectively design an experiment.
Kick-start your project with my new book Statistics for Machine Learning, including step-by-step tutorials and the Python source code files for all examples.
Let’s get started.
A Gentle Introduction to Statistical Power and Power Analysis in Python Photo by Kamil Porembiński, some rights reserved.
Tutorial Overview
This tutorial is divided into four parts; they are:
Statistical Hypothesis Testing
What Is Statistical Power?
Power Analysis
Student’s t Test Power Analysis
Need help with Statistics for Machine Learning?
Take my free 7-day email crash course now (with sample code).
Click to sign-up and also get a free PDF Ebook version of the course.
Statistical Hypothesis Testing
A statistical hypothesis test makes an assumption about the outcome, called the null hypothesis.
For example, the null hypothesis for the Pearson’s correlation test is that there is no relationship between two variables. The null hypothesis for the Student’s t test is that there is no difference between the means of two populations.
The test is often interpreted using a p-value, which is the probability of observing the result given that the null hypothesis is true, not the reverse, as is often the case with misinterpretations.
p-value (p): Probability of obtaining a result equal to or more extreme than was observed in the data.
In interpreting the p-value of a significance test, you must specify a significance level, often referred to as the Greek lower case letter alpha (a). A common value for the significance level is 5% written as 0.05.
The p-value is interested in the context of the chosen significance level. A result of a significance test is claimed to be “statistically significant” if the p-value is less than the significance level. This means that the null hypothesis (that there is no result) is rejected.
p <= alpha: reject H0, different distribution.
p > alpha: fail to reject H0, same distribution.
Where:
Significance level (alpha): Boundary for specifying a statistically significant finding when interpreting the p-value.
We can see that the p-value is just a probability and that in actuality the result may be different. The test could be wrong. Given the p-value, we could make an error in our interpretation.
There are two types of errors; they are:
Type I Error. Reject the null hypothesis when there is in fact no significant effect (false positive). The p-value is optimistically small.
Type II Error. Not reject the null hypothesis when there is a significant effect (false negative). The p-value is pessimistically large.
In this context, we can think of the significance level as the probability of rejecting the null hypothesis if it were true. That is the probability of making a Type I Error or a false positive.
What Is Statistical Power?
Statistical power, or the power of a hypothesis test is the probability that the test correctly rejects the null hypothesis.
That is, the probability of a true positive result. It is only useful when the null hypothesis is rejected.
… statistical power is the probability that a test will correctly reject a false null hypothesis. Statistical power has relevance only when the null is false.
The higher the statistical power for a given experiment, the lower the probability of making a Type II (false negative) error. That is the higher the probability of detecting an effect when there is an effect. In fact, the power is precisely the inverse of the probability of a Type II error.
1
2
Power = 1 - Type II Error
Pr(True Positive) = 1 - Pr(False Negative)
More intuitively, the statistical power can be thought of as the probability of accepting an alternative hypothesis, when the alternative hypothesis is true.
When interpreting statistical power, we seek experiential setups that have high statistical power.
Low Statistical Power: Large risk of committing Type II errors, e.g. a false negative.
High Statistical Power: Small risk of committing Type II errors.
Experimental results with too low statistical power will lead to invalid conclusions about the meaning of the results. Therefore a minimum level of statistical power must be sought.
It is common to design experiments with a statistical power of 80% or better, e.g. 0.80. This means a 20% probability of encountering a Type II area. This different to the 5% likelihood of encountering a Type I error for the standard value for the significance level.
Power Analysis
Statistical power is one piece in a puzzle that has four related parts; they are:
Effect Size. The quantified magnitude of a result present in the population. Effect size is calculated using a specific statistical measure, such as Pearson’s correlation coefficient for the relationship between variables or Cohen’s d for the difference between groups.
Sample Size. The number of observations in the sample.
Significance. The significance level used in the statistical test, e.g. alpha. Often set to 5% or 0.05.
Statistical Power. The probability of accepting the alternative hypothesis if it is true.
All four variables are related. For example, a larger sample size can make an effect easier to detect, and the statistical power can be increased in a test by increasing the significance level.
A power analysis involves estimating one of these four parameters given values for three other parameters. This is a powerful tool in both the design and in the analysis of experiments that we wish to interpret using statistical hypothesis tests.
For example, the statistical power can be estimated given an effect size, sample size and significance level. Alternately, the sample size can be estimated given different desired levels of significance.
Power analysis answers questions like “how much statistical power does my study have?” and “how big a sample size do I need?”.
Perhaps the most common use of a power analysis is in the estimation of the minimum sample size required for an experiment.
Power analyses are normally run before a study is conducted. A prospective or a priori power analysis can be used to estimate any one of the four power parameters but is most often used to estimate required sample sizes.
As a practitioner, we can start with sensible defaults for some parameters, such as a significance level of 0.05 and a power level of 0.80. We can then estimate a desirable minimum effect size, specific to the experiment being performed. A power analysis can then be used to estimate the minimum sample size required.
In addition, multiple power analyses can be performed to provide a curve of one parameter against another, such as the change in the size of an effect in an experiment given changes to the sample size. More elaborate plots can be created varying three of the parameters. This is a useful tool for experimental design.
Student’s t Test Power Analysis
We can make the idea of statistical power and power analysis concrete with a worked example.
In this section, we will look at the Student’s t test, which is a statistical hypothesis test for comparing the means from two samples of Gaussian variables. The assumption, or null hypothesis, of the test is that the sample populations have the same mean, e.g. that there is no difference between the samples or that the samples are drawn from the same underlying population.
The test will calculate a p-value that can be interpreted as to whether the samples are the same (fail to reject the null hypothesis), or there is a statistically significant difference between the samples (reject the null hypothesis). A common significance level for interpreting the p-value is 5% or 0.05.
Significance level (alpha): 5% or 0.05.
The size of the effect of comparing two groups can be quantified with an effect size measure. A common measure for comparing the difference in the mean from two groups is the Cohen’s d measure. It calculates a standard score that describes the difference in terms of the number of standard deviations that the means are different. A large effect size for Cohen’s d is 0.80 or higher, as is commonly accepted when using the measure.
Effect Size: Cohen’s d of at least 0.80.
We can use the default and assume a minimum statistical power of 80% or 0.8.
Statistical Power: 80% or 0.80.
For a given experiment with these defaults, we may be interested in estimating a suitable sample size. That is, how many observations are required from each sample in order to at least detect an effect of 0.80 with an 80% chance of detecting the effect if it is true (20% of a Type II error) and a 5% chance of detecting an effect if there is no such effect (Type I error).
We can solve this using a power analysis.
The statsmodels library provides the TTestIndPower class for calculating a power analysis for the Student’s t test with independent samples. Of note is the TTestPower class that can perform the same analysis for the paired Student’s t test.
The function solve_power() can be used to calculate one of the four parameters in a power analysis. In our case, we are interested in calculating the sample size. We can use the function by providing the three pieces of information we know (alpha, effect, and power) and setting the size of argument we wish to calculate the answer of (nobs1) to “None“. This tells the function what to calculate.
A note on sample size: the function has an argument called ratio that is the ratio of the number of samples in one sample to the other. If both samples are expected to have the same number of observations, then the ratio is 1.0. If, for example, the second sample is expected to have half as many observations, then the ratio would be 0.5.
The TTestIndPower instance must be created, then we can call the solve_power() with our arguments to estimate the sample size for the experiment.
Running the example calculates and prints the estimated number of samples for the experiment as 25. This would be a suggested minimum number of samples required to see an effect of the desired size.
1
Sample Size: 25.525
We can go one step further and calculate power curves.
Power curves are line plots that show how the change in variables, such as effect size and sample size, impact the power of the statistical test.
The plot_power() function can be used to create power curves. The dependent variable (x-axis) must be specified by name in the ‘dep_var‘ argument. Arrays of values can then be specified for the sample size (nobs), effect size (effect_size), and significance (alpha) parameters. One or multiple curves will then be plotted showing the impact on statistical power.
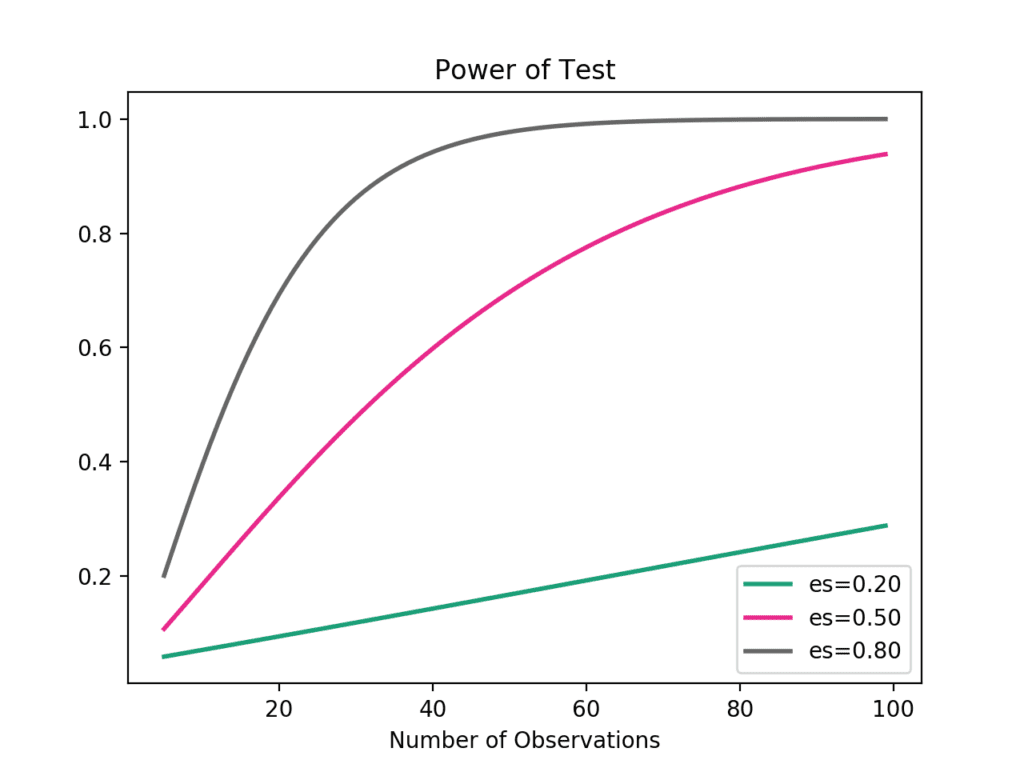
For example, we can assume a significance of 0.05 (the default for the function) and explore the change in sample size between 5 and 100 with low, medium, and high effect sizes.
1
2
3
# calculate power curves from multiple power analyses
Running the example creates the plot showing the impact on statistical power (y-axis) for three different effect sizes (es) as the sample size (x-axis) is increased.
We can see that if we are interested in a large effect that a point of diminishing returns in terms of statistical power occurs at around 40-to-50 observations.
Power Curves for Student’s t Test
Usefully, statsmodels has classes to perform a power analysis with other statistical tests, such as the F-test, Z-test, and the Chi-Squared test.
Extensions
This section lists some ideas for extending the tutorial that you may wish to explore.
Plot the power curves of different standard significance levels against the sample size.
Find an example of a study that reports the statistical power of the experiment.
Prepare examples of a performance analysis for other statistical tests provided by statsmodels.
If you explore any of these extensions, I’d love to know.
Further Reading
This section provides more resources on the topic if you are looking to go deeper.
In this tutorial, you discovered the statistical power of a hypothesis test and how to calculate power analyses and power curves as part of experimental design.
Specifically, you learned:
Statistical power is the probability of a hypothesis test of finding an effect if there is an effect to be found.
A power analysis can be used to estimate the minimum sample size required for an experiment, given a desired significance level, effect size, and statistical power.
How to calculate and plot power analysis for the Student’s t test in Python in order to effectively design an experiment.
Do you have any questions?
Ask your questions in the comments below and I will do my best to answer.
Great article, thanks for the attacking this important, often neglected topic, from a machine learning perspective. One question though; in this sentence, “the statistical power can be increased in a test by increasing the significance level”, did you mean power can be increased by decreasing the significance level (as in, decreasing alpha)? Maybe the use of the phrase significance level is misleading.
I also agree with this Jason, it should read “the statistical power can be increased in a test by increasing the significance level”.
Additionally, you say this:
“[Statistical power] is only useful when the null hypothesis is rejected.”
yet you quote “The Essential Guide to Effect Sizes” which says this:
“Statistical power has relevance only when the null is false.”
These two sentences are not equivalent – The Essential Guide has it right. I think what you should have said is “Statistical power can only be reported when the null hypothesis is not rejected.” You can think of it this way: when you reject the null hypothesis, you report the p-value which gives you an indication of falsely rejecting the null hypothesis if it were true (i.e. a false positive estimation), while when you fail to reject the null hypothesis, you report the power, which gives you an indication of falsely not rejecting the null hypothesis if it were false (i.e. a false negative estimation).
My question is – knowing the typical standard deviation of the type of experiment I am running, can I tailor my power analysis to my specifics to get a more accurate idea of the samples size I will need? As it is, this seems to be a one-size-fits-all test.
The standard deviation is part of the effect size. If you know the expected mean difference between your populations and the standard deviation you should be able to calculate the effect size for your specific experiment.
From the statsmodel documentation:
effect_size – standardized effect size, difference between the two means divided by the standard deviation. effect_size has to be positive.
I have a question about a possible use case of this method. I have number of musicians that I collected their songs based on some kind of name matching from Spotify. Name matching is not perfect and therefor effect my analysis later. To evaluate my data quality, I like to take random sample of musicians and manually assign them a spotify id and check how my name matching approach worked. so if there are 20000 musicians, what is the best random sample size? can I somehow use the method described here?
Apologize for not being clear and having a typo. I looked at the document for statsmodels.stats.power. It seems that so for if we want to calculate the power or sample size, we could not use the two-sample proportion test (like the pwr.2p2n.test or pwr.2p.test in R)? I am working on an analysis where the outcome is binary. But did not seem to identify similar function as pwr.2p2n.test in Python. Thank you.
We can use effect size to estimate the sample size.
We can use the sample size to estimate the effect size, etc.
We can do these things prior to running an experiment to help determine the size of the effect we want to see and/or the size of the sample we may need.
Well I have always looked at the number before the variable in a regression model (if negative or not) to see ”which impact has a varible on a model”
Example; y = 33 + 45 x1 + 35 x2 – 4 x3…
the number ”before the x”
Can I make you an example?
Let’s assume that I collect data about the first services of two tennis players….well then I compare their means with ANOVA to see if do they
differ from each other in a significant statistical way.
In this case I have 2 distributions (the first service of the 2 tennis players), 2 means and I am comparing the 2 distributions / means each other
My question is …. in this case , looking at the Coehn’s d, ETA squared what can they be useful for? For which reason should I look at them (ETA squared, effect size Cohen’sd) in this case of the 2 tennis players?
Regarding the comment that Phil said two years ago. A lower significance level means a decrease in power. If power = to the probability of avoiding a type 2 error, then we would want to decrease our chances of failing to reject the null hypothesis. any number bigger than alpha is a failure to reject the null hypothesis. If you increase the alpha, then you increase the power. Please make the change, Phil was wrong…
As you know, many machine-learning models are high dimensional in nature with thousands of features sometimes informing the solutions to problems. Further, algorithms are often more complex than simple statistical tests (random forest, support vector machine, etc). Are there specific guidelines or rules of thumb for power and sample size to reduce likelihood of overfitting with high-dimensional prediction or for training algorithms that are not conventional statistical tests?
“…the power is precisely the inverse of the probability of a Type II error”—shouldn’t it be “complement of the probability” instead of “inverse of the probability”?
Just some suggestions from a reader perspective, maybe discuss what is the formula to calculate sample size given the other 3 factors in power analysis. It would be much better for someone to understand it rather than blindly copy/paste the python code. A pretty good article that demonstrates this idea could be found at https://towardsdatascience.com/understanding-power-analysis-in-ab-testing-14808e8a1554
But this is still a Great article btw, I enjoyed reading thru your blogs for statistic topics.
Hi Jason, thank you for your really helpful articles,
I have two questions that are, First: when we are try to compare two algorithms on a single domain, that when we are using k-fold or other CV method, we now that samples(e.g. evaluating results of each fold) are not independent, which on of TTestIndPower or TTestPower should we use?
Second: when we are try to find the value of sample size based on three other arguments, is this the min number of evaluating results that we should have to compare two algorithms(e.g. the K times T in K-fold T-times CV method), or this is the number of samples that the test set should contain?
Hello – I have had someone suggest to me that I could use power analysis to determine the sample size needed in an external validation dataset, to evaluate performance of an XGBoost model that I have fit to a large dataset (5.5M observations, 3 classes, 1900 features). Is that a correct application/use of power analysis?
I think this is incorrect. This result does not allow you conclude that the samples are from the same population. All it tells you is that IF the samples WERE from the same population, there is a certain probability (p) of obtaining those sample statistics (mean, sd) from randomly selecting observations for samples from that one population.
To conclude the samples ARE from the same population, we would need a probability distribution describing the probabilities that selecting observations from DIFFERENT populations would produce data with certain sample statistics. We could then say, about a set of samples of observations, that the probability (p) is less than alpha (e.g. 5%) that those samples come from DIFFERENT populations, affirming the null hypothesis.
The problem is that we don’t have such a distribution, so we can never conclude the null hypothesis.
Hello, why is this the case: “In this context, we can think of the significance level as the probability of rejecting the null hypothesis if it were true.”?


nIce article thank u
Thanks.
Nice article as always…
Thanks.
Excellent
Thanks.
Great article, thanks for the attacking this important, often neglected topic, from a machine learning perspective. One question though; in this sentence, “the statistical power can be increased in a test by increasing the significance level”, did you mean power can be increased by decreasing the significance level (as in, decreasing alpha)? Maybe the use of the phrase significance level is misleading.
I think you’re right. Fixed. Thanks Phil.
The original statement was probably correct. A higher significance level may imply a smaller region of acceptance of the null hypothesis, a higher probability of acceptance of the alternate hypothesis, and thus, an increased statistical power. References: https://support.minitab.com/en-us/minitab-express/1/help-and-how-to/basic-statistics/inference/supporting-topics/basics/increase-the-power-of-a-hypothesis-test/, https://stattrek.com/hypothesis-test/power-of-test.aspx
Thanks for sharing.
I also agree with this Jason, it should read “the statistical power can be increased in a test by increasing the significance level”.
Additionally, you say this:
“[Statistical power] is only useful when the null hypothesis is rejected.”
yet you quote “The Essential Guide to Effect Sizes” which says this:
“Statistical power has relevance only when the null is false.”
These two sentences are not equivalent – The Essential Guide has it right. I think what you should have said is “Statistical power can only be reported when the null hypothesis is not rejected.” You can think of it this way: when you reject the null hypothesis, you report the p-value which gives you an indication of falsely rejecting the null hypothesis if it were true (i.e. a false positive estimation), while when you fail to reject the null hypothesis, you report the power, which gives you an indication of falsely not rejecting the null hypothesis if it were false (i.e. a false negative estimation).
Let me know if this makes sense?
Thanks for sharing, sounds like I need to take a harder look at all of this.
Updated.
H0, the null hypothesis is false, means it is rejected.
I agree with VSR here.
I also agree, Jason. I believe you should change it back.
I agree as well.
Thank you for asking that question Phil
Great article, thank you!
My question is – knowing the typical standard deviation of the type of experiment I am running, can I tailor my power analysis to my specifics to get a more accurate idea of the samples size I will need? As it is, this seems to be a one-size-fits-all test.
Perhaps. I’m not sure I follow, sorry.
The standard deviation is part of the effect size. If you know the expected mean difference between your populations and the standard deviation you should be able to calculate the effect size for your specific experiment.
From the statsmodel documentation:
effect_size – standardized effect size, difference between the two means divided by the standard deviation. effect_size has to be positive.
Excellent Blog. I love reading this and gives me great information. Thanks for giving such a great information to us….!!!!
You’re welcome!
This is awesome, thank you for being so methodical and providing a context-rich explanation to power analyses with Python, it helps a bunch!
Thanks, I’m glad it helped.
thanks for your nice explanation.
I have a question about a possible use case of this method. I have number of musicians that I collected their songs based on some kind of name matching from Spotify. Name matching is not perfect and therefor effect my analysis later. To evaluate my data quality, I like to take random sample of musicians and manually assign them a spotify id and check how my name matching approach worked. so if there are 20000 musicians, what is the best random sample size? can I somehow use the method described here?
Perhaps look at the standard error for some measure with different sample sizes as a starting point?
Excellent article. Very well explained. Lays the ground for understanding this confusing topic. Thank you.
Thansk, I’m glad it helped!
If the outcome is bonary (1 and 0) and we try to compare between 2 groups. We should not be using the function from the package directly? Thank you!
Sorry, what do you mean exactly?
Apologize for not being clear and having a typo. I looked at the document for statsmodels.stats.power. It seems that so for if we want to calculate the power or sample size, we could not use the two-sample proportion test (like the pwr.2p2n.test or pwr.2p.test in R)? I am working on an analysis where the outcome is binary. But did not seem to identify similar function as pwr.2p2n.test in Python. Thank you.
I see, I’m not sure off hand sorry.
Hello, once we know the ”effect size” than what can we do with it?
We can use effect size to estimate the sample size.
We can use the sample size to estimate the effect size, etc.
We can do these things prior to running an experiment to help determine the size of the effect we want to see and/or the size of the sample we may need.
Does that help?
Hello thank you for your answer.
Well I have always looked at the number before the variable in a regression model (if negative or not) to see ”which impact has a varible on a model”
Example; y = 33 + 45 x1 + 35 x2 – 4 x3…
the number ”before the x”
Can I make you an example?
Let’s assume that I collect data about the first services of two tennis players….well then I compare their means with ANOVA to see if do they
differ from each other in a significant statistical way.
In this case I have 2 distributions (the first service of the 2 tennis players), 2 means and I am comparing the 2 distributions / means each other
My question is …. in this case , looking at the Coehn’s d, ETA squared what can they be useful for? For which reason should I look at them (ETA squared, effect size Cohen’sd) in this case of the 2 tennis players?
Not sure I follow sorry.
You are a hero <3
Thanks.
Regarding the comment that Phil said two years ago. A lower significance level means a decrease in power. If power = to the probability of avoiding a type 2 error, then we would want to decrease our chances of failing to reject the null hypothesis. any number bigger than alpha is a failure to reject the null hypothesis. If you increase the alpha, then you increase the power. Please make the change, Phil was wrong…
Thanks for sharing Joshua.
Thanks Jason.
As you know, many machine-learning models are high dimensional in nature with thousands of features sometimes informing the solutions to problems. Further, algorithms are often more complex than simple statistical tests (random forest, support vector machine, etc). Are there specific guidelines or rules of thumb for power and sample size to reduce likelihood of overfitting with high-dimensional prediction or for training algorithms that are not conventional statistical tests?
Yes, there is a field of “regularization” methods that seek to address this problem — small datasets and overfitting models.
“…the power is precisely the inverse of the probability of a Type II error”—shouldn’t it be “complement of the probability” instead of “inverse of the probability”?
Thanks.
Beautifully written. Thanks a lot
Thanks!
Just some suggestions from a reader perspective, maybe discuss what is the formula to calculate sample size given the other 3 factors in power analysis. It would be much better for someone to understand it rather than blindly copy/paste the python code. A pretty good article that demonstrates this idea could be found at https://towardsdatascience.com/understanding-power-analysis-in-ab-testing-14808e8a1554
But this is still a Great article btw, I enjoyed reading thru your blogs for statistic topics.
Thanks for the suggestion.
This is really useful. I always thought that just saying u1 != u2 is not enough. We need to say how different they are.
You might also want to look at effect size:
https://machinelearningmastery.com/effect-size-measures-in-python/
I think there is a typo
Power = True Negatives(rejecting null hypothesis when it is false)
Type 2 error = FN
Power = 1-FN(type 2 errors)
Great article, super informative, thank you 🙂
One question though – I noticed that in online calculators providing power analysis (e.g. https://www.stat.ubc.ca/~rollin/stats/ssize/n2.html) there is mu_1, mu_2 and standard deviation needed. And in statsmodels module that you’ve used (https://www.statsmodels.org/stable/generated/statsmodels.stats.power.TTestIndPower.solve_power.html#statsmodels.stats.power.TTestIndPower.solve_power) for power only 3 things are needed – alpha, effect_size and nobs1. Is it really enough information? I mean I know that effect_size is connected to mu1, mu2 and sd (effect_size = (mu2-mu1)/sd), so I am wondering if only effect_size is enough information, or don’t we need means as well and standard deviation? I’ve tried to solve it on piece of paper, but maybe my algebra in power analysis is not good enough 🙂
Thanks for the answer in advance 🙂 love the work you do!
You’re welcome.
Not sure about third party calculators, sorry.
Great blog! One question though. cohen’s d = effect size when we are using t-test? Also it can exceed 1?
If you look at the definition, you see cohen’s d = difference in mean divided by pooled s.d.; hence it can exceed 1 theoretically.
Hi Jason,
Do you have any references for how ‘ratio’ between the two groups changes the calculation?
I didn’t see a reference in the statsmodels documentation to reference the formula they’re implementing.
Thanks,
Josh
May be the formula on this wikipedia page can help explain: https://en.wikipedia.org/wiki/Paired_difference_test
Note that the two populations have size n_1 and n_2 in formula; the library asks for n_1 and the ratio of n_1/n_2.
Thank you for the article. Well done !
Great feedback Roberto!
Hi Jason, thank you for your really helpful articles,
I have two questions that are, First: when we are try to compare two algorithms on a single domain, that when we are using k-fold or other CV method, we now that samples(e.g. evaluating results of each fold) are not independent, which on of TTestIndPower or TTestPower should we use?
Second: when we are try to find the value of sample size based on three other arguments, is this the min number of evaluating results that we should have to compare two algorithms(e.g. the K times T in K-fold T-times CV method), or this is the number of samples that the test set should contain?
excellent work, as always!
Thank you for the feedback and support billy! We greatly appreciate it!
Hello – I have had someone suggest to me that I could use power analysis to determine the sample size needed in an external validation dataset, to evaluate performance of an XGBoost model that I have fit to a large dataset (5.5M observations, 3 classes, 1900 features). Is that a correct application/use of power analysis?
Hi Jas…Your understanding is correct! The following resource may add clarity:
https://www.analyticsvidhya.com/blog/2020/12/statistics-for-beginners-power-of-power-analysis/
Hello. First of all, hank you very much for the very well written article(s).
I have a question. How can I calculate the effect size, a-priori ?
In case of unpaired t-test, I guess I would use the mean of the control vs the mean of the treatment (before the experiment), right ?
But, in a paired t-test, how can I do that ? Since now I have only 1 group, and the test is not ran yet.
thanks !
Hi Dimi…The following resource may be of interest to you:
https://machinelearningmastery.com/effect-size-measures-in-python/
“The p-value is interested in the context of the chosen significance level.”
did you mean to write “inserted” instead of “interested”?
“p > alpha: fail to reject H0, same distribution”
I think this is incorrect. This result does not allow you conclude that the samples are from the same population. All it tells you is that IF the samples WERE from the same population, there is a certain probability (p) of obtaining those sample statistics (mean, sd) from randomly selecting observations for samples from that one population.
To conclude the samples ARE from the same population, we would need a probability distribution describing the probabilities that selecting observations from DIFFERENT populations would produce data with certain sample statistics. We could then say, about a set of samples of observations, that the probability (p) is less than alpha (e.g. 5%) that those samples come from DIFFERENT populations, affirming the null hypothesis.
The problem is that we don’t have such a distribution, so we can never conclude the null hypothesis.
Thank you for your feedback Norm!
Hello, why is this the case: “In this context, we can think of the significance level as the probability of rejecting the null hypothesis if it were true.”?
Hi Gill…The following resource will hopefully provide some additional insight:
https://machinelearningmastery.com/statistical-hypothesis-tests/