The key to getting good at applied machine learning is practicing on lots of different datasets.
This is because each problem is different, requiring subtly different data preparation and modeling methods.
In this post, you will discover 10 top standard machine learning datasets that you can use for practice.
Let’s dive in.
Update Mar/2018: Added alternate link to download the Pima Indians and Boston Housing datasets as the originals appear to have been taken down.
Update Feb/2019: Minor update to the expected default RMSE for the insurance dataset.
Update Oct/2021: Minor update to the description of wheat seed dataset.
Overview
A structured Approach
Each dataset is summarized in a consistent way. This makes them easy to compare and navigate for you to practice a specific data preparation technique or modeling method.
The aspects that you need to know about each dataset are:
Name: How to refer to the dataset.
Problem Type: Whether the problem is regression or classification.
Inputs and Outputs: The numbers and known names of input and output features.
Performance: Baseline performance for comparison using the Zero Rule algorithm, as well as best known performance (if known).
Sample: A snapshot of the first 5 rows of raw data.
Links: Where you can download the dataset and learn more.
Standard Datasets
Below is a list of the 10 datasets we’ll cover.
Each dataset is small enough to fit into memory and review in a spreadsheet. All datasets are comprised of tabular data and no (explicitly) missing values.
Swedish Auto Insurance Dataset.
Wine Quality Dataset.
Pima Indians Diabetes Dataset.
Sonar Dataset.
Banknote Dataset.
Iris Flowers Dataset.
Abalone Dataset.
Ionosphere Dataset.
Wheat Seeds Dataset.
Boston House Price Dataset.
1. Swedish Auto Insurance Dataset
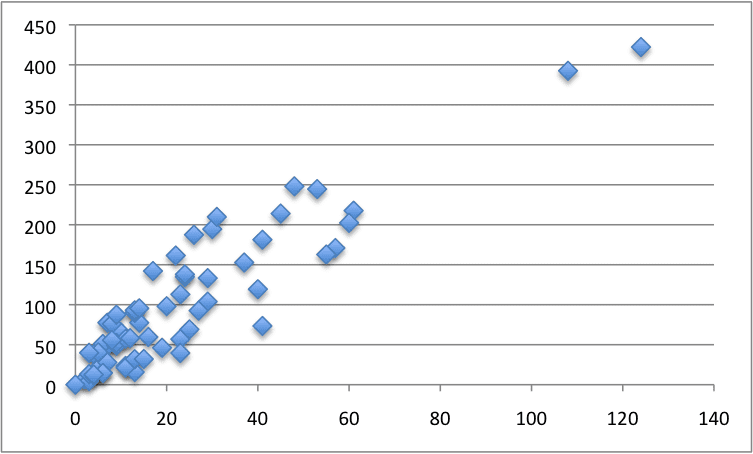
The Swedish Auto Insurance Dataset involves predicting the total payment for all claims in thousands of Swedish Kronor, given the total number of claims.
It is a regression problem. It is comprised of 63 observations with 1 input variable and one output variable. The variable names are as follows:
Number of claims.
Total payment for all claims in thousands of Swedish Kronor.
The baseline performance of predicting the mean value is an RMSE of approximately 81 thousand Kronor.
The Wine Quality Dataset involves predicting the quality of white wines on a scale given chemical measures of each wine.
It is a multi-class classification problem, but could also be framed as a regression problem. The number of observations for each class is not balanced. There are 4,898 observations with 11 input variables and one output variable. The variable names are as follows:
Fixed acidity.
Volatile acidity.
Citric acid.
Residual sugar.
Chlorides.
Free sulfur dioxide.
Total sulfur dioxide.
Density.
pH.
Sulphates.
Alcohol.
Quality (score between 0 and 10).
The baseline performance of predicting the mean value is an RMSE of approximately 0.148 quality points.
The Pima Indians Diabetes Dataset involves predicting the onset of diabetes within 5 years in Pima Indians given medical details.
It is a binary (2-class) classification problem. The number of observations for each class is not balanced. There are 768 observations with 8 input variables and 1 output variable. Missing values are believed to be encoded with zero values. The variable names are as follows:
Number of times pregnant.
Plasma glucose concentration a 2 hours in an oral glucose tolerance test.
Diastolic blood pressure (mm Hg).
Triceps skinfold thickness (mm).
2-Hour serum insulin (mu U/ml).
Body mass index (weight in kg/(height in m)^2).
Diabetes pedigree function.
Age (years).
Class variable (0 or 1).
The baseline performance of predicting the most prevalent class is a classification accuracy of approximately 65%. Top results achieve a classification accuracy of approximately 77%.
The Sonar Dataset involves the prediction of whether or not an object is a mine or a rock given the strength of sonar returns at different angles.
It is a binary (2-class) classification problem. The number of observations for each class is not balanced. There are 208 observations with 60 input variables and 1 output variable. The variable names are as follows:
Sonar returns at different angles
…
Class (M for mine and R for rock)
The baseline performance of predicting the most prevalent class is a classification accuracy of approximately 53%. Top results achieve a classification accuracy of approximately 88%.
The Banknote Dataset involves predicting whether a given banknote is authentic given a number of measures taken from a photograph.
It is a binary (2-class) classification problem. The number of observations for each class is not balanced. There are 1,372 observations with 4 input variables and 1 output variable. The variable names are as follows:
Variance of Wavelet Transformed image (continuous).
Skewness of Wavelet Transformed image (continuous).
Kurtosis of Wavelet Transformed image (continuous).
Entropy of image (continuous).
Class (0 for authentic, 1 for inauthentic).
The baseline performance of predicting the most prevalent class is a classification accuracy of approximately 50%.
The Iris Flowers Dataset involves predicting the flower species given measurements of iris flowers.
It is a multi-class classification problem. The number of observations for each class is balanced. There are 150 observations with 4 input variables and 1 output variable. The variable names are as follows:
Sepal length in cm.
Sepal width in cm.
Petal length in cm.
Petal width in cm.
Class (Iris Setosa, Iris Versicolour, Iris Virginica).
The baseline performance of predicting the most prevalent class is a classification accuracy of approximately 26%.
The Abalone Dataset involves predicting the age of abalone given objective measures of individuals.
It is a multi-class classification problem, but can also be framed as a regression. The number of observations for each class is not balanced. There are 4,177 observations with 8 input variables and 1 output variable. The variable names are as follows:
Sex (M, F, I).
Length.
Diameter.
Height.
Whole weight.
Shucked weight.
Viscera weight.
Shell weight.
Rings.
The baseline performance of predicting the most prevalent class is a classification accuracy of approximately 16%. The baseline performance of predicting the mean value is an RMSE of approximately 3.2 rings.
The Ionosphere Dataset requires the prediction of structure in the atmosphere given radar returns targeting free electrons in the ionosphere.
It is a binary (2-class) classification problem. The number of observations for each class is not balanced. There are 351 observations with 34 input variables and 1 output variable. The variable names are as follows:
17 pairs of radar return data.
…
Class (g for good and b for bad).
The baseline performance of predicting the most prevalent class is a classification accuracy of approximately 64%. Top results achieve a classification accuracy of approximately 94%.
The Wheat Seeds Dataset involves the prediction of species given measurements of seeds from different varieties of wheat.
It is a multiclass (3-class) classification problem. The number of observations for each class is balanced. There are 210 observations with 7 input variables and 1 output variable. The variable names are as follows:
Area.
Perimeter.
Compactness
Length of kernel.
Width of kernel.
Asymmetry coefficient.
Length of kernel groove.
Class (1, 2, 3).
The baseline performance of predicting the most prevalent class is a classification accuracy of approximately 28%.
Hello, in reference to the Swedish auto data, is it not possible to use Scikit-Learn to perform linear regression? I get deprecation errors that request that I reshape the data. When I reshape, I get the error that the samples are different sizes. What am I missing please. Thank you.
WHAT IS THE DIFFERENCE BETWEEN NUMERIC AND CLINICAL CANCER. OR BOTH ARE SAME . I NEED LEUKEMIA ,LUNG,COLON DATASETS FOR MY WORK. I TOO NEED IMAGE DATSET FOR MY RESEARCH .WHERE TO GET THE DATASETS
I applied sklearn random forest and svm classifier to the wheat seed dataset in my very first Python notebook! 😀 The error oscilliates between 10% and 20% from an execution to an other. Can share it if anyone interrested.
I need a data set that
Contains at least 5 dimensions/features, including at least one categorical and one numerical dimension.
• Contains a clear class label attribute (binary or multi-label).
• Be of a simple tabular structure (i.e., no time series, multimedia, etc.).
• Be of reasonable size, and contains at least 2K tuples.
I would like to know if anyone knows about a classification-dataset, where the importances for the features regarding the output classes is known. For example: Feature 1 is a good indicator for class 1, or Feature 3,4,5 are good indicators for class 2, …
Thank you very much for your answer. I was asking because I want to validate my approach to access the feature importance via global sensitivity analysis (Sobol Indices). In order to do I am searching for a dataset (or a dummy-dataset) with the described properties.
It’s a variance based global sensitity analysis (ANOVA). It is quite similar to permutation-importance ranking but can reveal cross-correlations of features by calculation of the so called “total effect index”. If you are further interessed in the topic I can recommend the following paper:
Coming back to my first question: Do you know about a dataset with those properties or do you have any idea how I can build up a dummy dataset with known feature importance for each output?
I’m quite a beginner and something I’m not sure. I’ve fit the data with a straigth line (first dataset), but how do we measure accuracy?
Should we leave out some data points, and use to test or what?
Would you please tell where 1.48 comes from in with wine dataset? I’ve calculated mean squared error but it yields 0.034, using np.sqrt(np.mean(Y)/len(Y))
Hi Amit…yes the dataset can be utilized for classification, however in order to get that point the RMSE can be used to determine how accurate the predictions are based upon comparing averages of each quantity represented in the features.
Thanks a lot! I’ll use some of these for practice
Btw, it is written in a Wheat Seeds Dataset that it is a binary classification problem, however, 3 classes are given. Is this a mistake or something? Thank you


")
Thanks Jason. I will use these Datasets for practice.
Let me know how you go Benson.
Thanks. Please mention some datasets that have more than one output variable.
Format for Swedish Auto Insurance data has changed. It’s not in CSV format anymore and there are extra rows at the beginning of the data
You can copy paste the data from this page into a file and load in excel, then covert to csv:
https://www.math.muni.cz/~kolacek/docs/frvs/M7222/data/AutoInsurSweden.txt
Your posts have been a big help. Could you recommend a dataset which i can use to practice clustering and PCA on ?
Thanks.
Perhaps something where all features have the same units, like the iris flowers dataset?
Hello, in reference to the Swedish auto data, is it not possible to use Scikit-Learn to perform linear regression? I get deprecation errors that request that I reshape the data. When I reshape, I get the error that the samples are different sizes. What am I missing please. Thank you.
Sorry, I don’t know Joe. Perhaps try posting your code and errors to stackoverflow?
sir for wheat dataset i got result like this
0.97619047619
[[ 9 0 1]
[ 0 20 0]
[ 0 0 12]]
precision recall f1-score support
1.0 1.00 0.90 0.95 10
2.0 1.00 1.00 1.00 20
3.0 0.92 1.00 0.96 12
avg / total 0.98 0.98 0.98 42
is it correct sir?
What do you mean by correct?
Sir ,the confusion matrix and the accuracy what i got, is it acceptable?is that right?
It really depends on the problem. Sorry, I don’t know the problem well enough, perhaps compare it to the confusion matrix of other algorithms.
Thank you sir
I will do it
Thank you very much.
You’re welcome.
Thanks for the datasets they r going to help me as i learn ML
You’re welcome.
WHAT IS THE DIFFERENCE BETWEEN NUMERIC AND CLINICAL CANCER. OR BOTH ARE SAME . I NEED LEUKEMIA ,LUNG,COLON DATASETS FOR MY WORK. I TOO NEED IMAGE DATSET FOR MY RESEARCH .WHERE TO GET THE DATASETS
Perhaps try a google search?
Thanks a lot for sharing Jason!
I applied sklearn random forest and svm classifier to the wheat seed dataset in my very first Python notebook! 😀 The error oscilliates between 10% and 20% from an execution to an other. Can share it if anyone interrested.
Bye
Nice work!
I’m interested in the SVM classifier for the wheat seed dataset. You said you’re happy to share.
for sonar dataset got 90.47% accuracy
Well done!
Thanks Jason
I tried decision tree classifier with 70% training and 30% testing on Banknote dataset.
Achieved accuracy of 99%.
[Accuracy: 0.9902912621359223]
Well done!
used k- nearest neighbors classifier with 75% training & 25% testing on the iris data set. Achieved 0.973684 accuracy.
Well done!
used k- nearest neighbors classifier with 75% training & 25% testing on the iris data set. Achieved 0.9970845481049563 accuracy.
99.71%
Excellent.
Do you have any of these solved that I can reference back to?
Yes, I have solutions to most of them on the blog, you can try a blog search.
Hi, I used Support Vector Classifier and KNN classifier on the Wheat Seeds Dataset (80% train data, 20% test data )
Accuracy Score of SVC : 0.9047619047619048
Accuracy Score of KNN : 0.8809523809523809
Well done!
Hiya! Found some incredible toplogical trends in Iris that I am looking to replicate in another multi-class problem.
Are people typically classifying the gender of the species, or the ring number as a discrete output?
In the Abalone dataset*
The age is the target on that dataset, but you can frame any predictive modeling problem you like with the dataset for practice.
Hi sir I am looking for a data sets for wheat production bu using SVM regression algorithm .So please give me a proper data sets for machine running .
Search for datasets here:
https://machinelearningmastery.com/faq/single-faq/where-can-i-get-a-dataset-on-___
Hi guys, i am new to ML .
Thanks for this set of data !
Anyone beat the wine quality problem ?
My results are so bad.
Thanks
I did, see this:
https://machinelearningmastery.com/results-for-standard-classification-and-regression-machine-learning-datasets/
I need a data set that
Contains at least 5 dimensions/features, including at least one categorical and one numerical dimension.
• Contains a clear class label attribute (binary or multi-label).
• Be of a simple tabular structure (i.e., no time series, multimedia, etc.).
• Be of reasonable size, and contains at least 2K tuples.
This might help:
https://machinelearningmastery.com/faq/single-faq/where-can-i-get-a-dataset-on-___
Also this:
https://machinelearningmastery.com/generate-test-datasets-python-scikit-learn/
Where can I find the default result for the problems so I can compare with my result?
This has many of them:
https://machinelearningmastery.com/results-for-standard-classification-and-regression-machine-learning-datasets/
Thanks for the post – it is very helpfull!
I would like to know if anyone knows about a classification-dataset, where the importances for the features regarding the output classes is known. For example: Feature 1 is a good indicator for class 1, or Feature 3,4,5 are good indicators for class 2, …
Hope anyone can help 😉
You’re welcome.
Generally, we let the model discover the importance and how best to use input features.
Thank you very much for your answer. I was asking because I want to validate my approach to access the feature importance via global sensitivity analysis (Sobol Indices). In order to do I am searching for a dataset (or a dummy-dataset) with the described properties.
What are “Sobol Indices”?
It’s a variance based global sensitity analysis (ANOVA). It is quite similar to permutation-importance ranking but can reveal cross-correlations of features by calculation of the so called “total effect index”. If you are further interessed in the topic I can recommend the following paper:
https://www.researchgate.net/publication/306326267_Global_Sensitivity_Estimates_for_Neural_Network_Classifiers
Some Python code for straightforward calculation of sobol indices is provided here:
https://salib.readthedocs.io/en/latest/api.html#sobol-sensitivity-analysis
Coming back to my first question: Do you know about a dataset with those properties or do you have any idea how I can build up a dummy dataset with known feature importance for each output?
Thanks.
Yes, you can contrive a dataset with relevant/irrelevant inputs via the make_classification() function. I use it all the time.
Beyond that, you will have to contrive your own problem I would expect. Feature importance is not objective!
day4 lesson
code:-
import pandas as pd
url = “https://goo.gl/bDdBiA”
names = [‘preg’, ‘plas’, ‘pres’, ‘skin’, ‘test’, ‘mass’, ‘pedi’, ‘age’, ‘class’]
data = pd.read_csv(url, names=names)
description = data.describe()
print(description)
output:-
preg plas pres skin test mass pedi age class
count 768.000000 768.000000 768.000000 768.000000 768.000000 768.000000
768.000000 768.000000 768.000000
mean 3.845052 120.894531 69.105469 20.536458 79.799479 31.992578
0.471876 33.240885 0.348958
std 3.369578 31.972618 19.355807 15.952218 115.244002 7.884160 0.331329
11.760232 0.476951
min 0.000000 0.000000 0.000000 0.000000 0.000000 0.000000 0.078000
21.000000 0.000000
25% 1.000000 99.000000 62.000000 0.000000 0.000000 27.300000 0.243750
24.000000 0.000000
50% 3.000000 117.000000 72.000000 23.000000 30.500000 32.000000
0.372500 29.000000 0.000000
75% 6.000000 140.250000 80.000000 32.000000 127.250000 36.600000
0.626250 41.000000 1.000000
max 17.000000 199.000000 122.000000 99.000000 846.000000 67.100000
2.420000 81.000000 1.000000
The output not properly fit in comment section
Well done!
Hi there,
thanks a lot for the post!
I’m quite a beginner and something I’m not sure. I’ve fit the data with a straigth line (first dataset), but how do we measure accuracy?
Should we leave out some data points, and use to test or what?
Good question, this may help:
https://machinelearningmastery.com/regression-metrics-for-machine-learning/
Thanks, following the post, but with my own code:
mean = np.mean(Y)
l = Y.shape[1]
res = Y-mean
rmse = np.sqrt(np.dot(res,res.T)/l)
I calculated the rmse, and it yields
python

>>> rmse

array([[86.63170447]])
Also the values of wine quality have a max of 8 not 10, at least that’s what I get.
Tx for the help
the rmse is for the swedish kr
Would you please tell where 1.48 comes from in with wine dataset? I’ve calculated mean squared error but it yields 0.034, using
np.sqrt(np.mean(Y)/len(Y))or is this the sqrt(sum^m (y-y_i)*(y-y_i)/m) ?
It is probably the RMSE of a model that predicts the mean value from the training dataset.
The calculation for RMSE is here:
https://machinelearningmastery.com/regression-metrics-for-machine-learning/
Hi Jason,
The Wine quality dataset poses a multi-class classification problem. How could we have RMSE as a metric? Is that a mistake or am I missing something?
Hi Amit…yes the dataset can be utilized for classification, however in order to get that point the RMSE can be used to determine how accurate the predictions are based upon comparing averages of each quantity represented in the features.
With a linear model coded from scratch got
naive estimation rmse: [[86.63170447]]

model rmse: [[35.44597361]]
I’ve also done a simple visual of the model’s evolution here:
https://imgur.com/1X7h7gC
Nice work!
Thank you so much, Jason. Was really looking for these datasets for practice today.
You’re welcome.
Thanks a lot! I’ll use some of these for practice
Btw, it is written in a Wheat Seeds Dataset that it is a binary classification problem, however, 3 classes are given. Is this a mistake or something? Thank you
Yes, that was a mistake. Thanks for pointing out.
Just found that the evaluation dataset of wine isn’t as same as the one in here:
https://machinelearningmastery.com/results-for-standard-classification-and-regression-machine-learning-datasets/#:~:text=https%3A//raw.githubusercontent.com/jbrownlee/Datasets/master/wine.csv
Thank you for the feedback Yao!