Random forest is an ensemble machine learning algorithm.
It is perhaps the most popular and widely used machine learning algorithm given its good or excellent performance across a wide range of classification and regression predictive modeling problems.
It is also easy to use given that it has few key hyperparameters and sensible heuristics for configuring these hyperparameters.
In this tutorial, you will discover how to develop a random forest ensemble for classification and regression.
After completing this tutorial, you will know:
- Random forest ensemble is an ensemble of decision trees and a natural extension of bagging.
- How to use the random forest ensemble for classification and regression with scikit-learn.
- How to explore the effect of random forest model hyperparameters on model performance.
Kick-start your project with my new book Ensemble Learning Algorithms With Python, including step-by-step tutorials and the Python source code files for all examples.
Let’s get started.
- Update Aug/2020: Added a common questions section.

How to Develop a Random Forest Ensemble in Python
Photo by Sheila Sund, some rights reserved.
Tutorial Overview
This tutorial is divided into four parts; they are:
- Random Forest Algorithm
- Random Forest Scikit-Learn API
- Random Forest for Classification
- Random Forest for Regression
- Random Forest Hyperparameters
- Explore Number of Samples
- Explore Number of Features
- Explore Number of Trees
- Explore Tree Depth
- Common Questions
Random Forest Algorithm
Random forest is an ensemble of decision tree algorithms.
It is an extension of bootstrap aggregation (bagging) of decision trees and can be used for classification and regression problems.
In bagging, a number of decision trees are created where each tree is created from a different bootstrap sample of the training dataset. A bootstrap sample is a sample of the training dataset where a sample may appear more than once in the sample, referred to as sampling with replacement.
Bagging is an effective ensemble algorithm as each decision tree is fit on a slightly different training dataset, and in turn, has a slightly different performance. Unlike normal decision tree models, such as classification and regression trees (CART), trees used in the ensemble are unpruned, making them slightly overfit to the training dataset. This is desirable as it helps to make each tree more different and have less correlated predictions or prediction errors.
Predictions from the trees are averaged across all decision trees resulting in better performance than any single tree in the model.
Each model in the ensemble is then used to generate a prediction for a new sample and these m predictions are averaged to give the forest’s prediction
— Page 199, Applied Predictive Modeling, 2013.
A prediction on a regression problem is the average of the prediction across the trees in the ensemble. A prediction on a classification problem is the majority vote for the class label across the trees in the ensemble.
- Regression: Prediction is the average prediction across the decision trees.
- Classification: Prediction is the majority vote class label predicted across the decision trees.
As with bagging, each tree in the forest casts a vote for the classification of a new sample, and the proportion of votes in each class across the ensemble is the predicted probability vector.
— Page 387, Applied Predictive Modeling, 2013.
Random forest involves constructing a large number of decision trees from bootstrap samples from the training dataset, like bagging.
Unlike bagging, random forest also involves selecting a subset of input features (columns or variables) at each split point in the construction of trees. Typically, constructing a decision tree involves evaluating the value for each input variable in the data in order to select a split point. By reducing the features to a random subset that may be considered at each split point, it forces each decision tree in the ensemble to be more different.
Random forests provide an improvement over bagged trees by way of a small tweak that decorrelates the trees. […] But when building these decision trees, each time a split in a tree is considered, a random sample of m predictors is chosen as split candidates from the full set of p predictors.
— Page 320, An Introduction to Statistical Learning with Applications in R, 2014.
The effect is that the predictions, and in turn, prediction errors, made by each tree in the ensemble are more different or less correlated. When the predictions from these less correlated trees are averaged to make a prediction, it often results in better performance than bagged decision trees.
Perhaps the most important hyperparameter to tune for the random forest is the number of random features to consider at each split point.
Random forests’ tuning parameter is the number of randomly selected predictors, k, to choose from at each split, and is commonly referred to as mtry. In the regression context, Breiman (2001) recommends setting mtry to be one-third of the number of predictors.
— Page 199, Applied Predictive Modeling, 2013.
A good heuristic for regression is to set this hyperparameter to 1/3 the number of input features.
- num_features_for_split = total_input_features / 3
For classification problems, Breiman (2001) recommends setting mtry to the square root of the number of predictors.
— Page 387, Applied Predictive Modeling, 2013.
A good heuristic for classification is to set this hyperparameter to the square root of the number of input features.
- num_features_for_split = sqrt(total_input_features)
Another important hyperparameter to tune is the depth of the decision trees. Deeper trees are often more overfit to the training data, but also less correlated, which in turn may improve the performance of the ensemble. Depths from 1 to 10 levels may be effective.
Finally, the number of decision trees in the ensemble can be set. Often, this is increased until no further improvement is seen.
Want to Get Started With Ensemble Learning?
Take my free 7-day email crash course now (with sample code).
Click to sign-up and also get a free PDF Ebook version of the course.
Random Forest Scikit-Learn API
Random Forest ensembles can be implemented from scratch, although this can be challenging for beginners.
The scikit-learn Python machine learning library provides an implementation of Random Forest for machine learning.
It is available in modern versions of the library.
First, confirm that you are using a modern version of the library by running the following script:
|
1 2 3 |
# check scikit-learn version import sklearn print(sklearn.__version__) |
Running the script will print your version of scikit-learn.
Your version should be the same or higher. If not, you must upgrade your version of the scikit-learn library.
|
1 |
0.22.1 |
Random Forest is provided via the RandomForestRegressor and RandomForestClassifier classes.
Both models operate the same way and take the same arguments that influence how the decision trees are created.
Randomness is used in the construction of the model. This means that each time the algorithm is run on the same data, it will produce a slightly different model.
When using machine learning algorithms that have a stochastic learning algorithm, it is good practice to evaluate them by averaging their performance across multiple runs or repeats of cross-validation. When fitting a final model, it may be desirable to either increase the number of trees until the variance of the model is reduced across repeated evaluations, or to fit multiple final models and average their predictions.
Let’s take a look at how to develop a Random Forest ensemble for both classification and regression tasks.
Random Forest for Classification
In this section, we will look at using Random Forest for a classification problem.
First, we can use the make_classification() function to create a synthetic binary classification problem with 1,000 examples and 20 input features.
The complete example is listed below.
|
1 2 3 4 5 6 |
# test classification dataset from sklearn.datasets import make_classification # define dataset X, y = make_classification(n_samples=1000, n_features=20, n_informative=15, n_redundant=5, random_state=3) # summarize the dataset print(X.shape, y.shape) |
Running the example creates the dataset and summarizes the shape of the input and output components.
|
1 |
(1000, 20) (1000,) |
Next, we can evaluate a random forest algorithm on this dataset.
We will evaluate the model using repeated stratified k-fold cross-validation, with three repeats and 10 folds. We will report the mean and standard deviation of the accuracy of the model across all repeats and folds.
|
1 2 3 4 5 6 7 8 9 10 11 12 13 14 15 16 |
# evaluate random forest algorithm for classification from numpy import mean from numpy import std from sklearn.datasets import make_classification from sklearn.model_selection import cross_val_score from sklearn.model_selection import RepeatedStratifiedKFold from sklearn.ensemble import RandomForestClassifier # define dataset X, y = make_classification(n_samples=1000, n_features=20, n_informative=15, n_redundant=5, random_state=3) # define the model model = RandomForestClassifier() # evaluate the model cv = RepeatedStratifiedKFold(n_splits=10, n_repeats=3, random_state=1) n_scores = cross_val_score(model, X, y, scoring='accuracy', cv=cv, n_jobs=-1, error_score='raise') # report performance print('Accuracy: %.3f (%.3f)' % (mean(n_scores), std(n_scores))) |
Running the example reports the mean and standard deviation accuracy of the model.
Note: Your results may vary given the stochastic nature of the algorithm or evaluation procedure, or differences in numerical precision. Consider running the example a few times and compare the average outcome.
In this case, we can see the random forest ensemble with default hyperparameters achieves a classification accuracy of about 90.5 percent.
|
1 |
Accuracy: 0.905 (0.025) |
We can also use the random forest model as a final model and make predictions for classification.
First, the random forest ensemble is fit on all available data, then the predict() function can be called to make predictions on new data.
The example below demonstrates this on our binary classification dataset.
|
1 2 3 4 5 6 7 8 9 10 11 12 13 |
# make predictions using random forest for classification from sklearn.datasets import make_classification from sklearn.ensemble import RandomForestClassifier # define dataset X, y = make_classification(n_samples=1000, n_features=20, n_informative=15, n_redundant=5, random_state=3) # define the model model = RandomForestClassifier() # fit the model on the whole dataset model.fit(X, y) # make a single prediction row = [[-8.52381793,5.24451077,-12.14967704,-2.92949242,0.99314133,0.67326595,-0.38657932,1.27955683,-0.60712621,3.20807316,0.60504151,-1.38706415,8.92444588,-7.43027595,-2.33653219,1.10358169,0.21547782,1.05057966,0.6975331,0.26076035]] yhat = model.predict(row) print('Predicted Class: %d' % yhat[0]) |
Running the example fits the random forest ensemble model on the entire dataset and is then used to make a prediction on a new row of data, as we might when using the model in an application.
|
1 |
Predicted Class: 0 |
Now that we are familiar with using random forest for classification, let’s look at the API for regression.
Random Forest for Regression
In this section, we will look at using random forests for a regression problem.
First, we can use the make_regression() function to create a synthetic regression problem with 1,000 examples and 20 input features.
The complete example is listed below.
|
1 2 3 4 5 6 |
# test regression dataset from sklearn.datasets import make_regression # define dataset X, y = make_regression(n_samples=1000, n_features=20, n_informative=15, noise=0.1, random_state=2) # summarize the dataset print(X.shape, y.shape) |
Running the example creates the dataset and summarizes the shape of the input and output components.
|
1 |
(1000, 20) (1000,) |
Next, we can evaluate a random forest algorithm on this dataset.
As we did with the last section, we will evaluate the model using repeated k-fold cross-validation, with three repeats and 10 folds. We will report the mean absolute error (MAE) of the model across all repeats and folds. The scikit-learn library makes the MAE negative so that it is maximized instead of minimized. This means that larger negative MAE are better and a perfect model has a MAE of 0.
The complete example is listed below.
|
1 2 3 4 5 6 7 8 9 10 11 12 13 14 15 16 |
# evaluate random forest ensemble for regression from numpy import mean from numpy import std from sklearn.datasets import make_regression from sklearn.model_selection import cross_val_score from sklearn.model_selection import RepeatedKFold from sklearn.ensemble import RandomForestRegressor # define dataset X, y = make_regression(n_samples=1000, n_features=20, n_informative=15, noise=0.1, random_state=2) # define the model model = RandomForestRegressor() # evaluate the model cv = RepeatedKFold(n_splits=10, n_repeats=3, random_state=1) n_scores = cross_val_score(model, X, y, scoring='neg_mean_absolute_error', cv=cv, n_jobs=-1, error_score='raise') # report performance print('MAE: %.3f (%.3f)' % (mean(n_scores), std(n_scores))) |
Running the example reports the mean and standard deviation MAE of the model.
Note: Your results may vary given the stochastic nature of the algorithm or evaluation procedure, or differences in numerical precision. Consider running the example a few times and compare the average outcome.
In this case, we can see the random forest ensemble with default hyperparameters achieves a MAE of about 90.
|
1 |
MAE: -90.149 (7.924) |
We can also use the random forest model as a final model and make predictions for regression.
First, the random forest ensemble is fit on all available data, then the predict() function can be called to make predictions on new data.
The example below demonstrates this on our regression dataset.
|
1 2 3 4 5 6 7 8 9 10 11 12 13 |
# random forest for making predictions for regression from sklearn.datasets import make_regression from sklearn.ensemble import RandomForestRegressor # define dataset X, y = make_regression(n_samples=1000, n_features=20, n_informative=15, noise=0.1, random_state=2) # define the model model = RandomForestRegressor() # fit the model on the whole dataset model.fit(X, y) # make a single prediction row = [[-0.89483109,-1.0670149,-0.25448694,-0.53850126,0.21082105,1.37435592,0.71203659,0.73093031,-1.25878104,-2.01656886,0.51906798,0.62767387,0.96250155,1.31410617,-1.25527295,-0.85079036,0.24129757,-0.17571721,-1.11454339,0.36268268]] yhat = model.predict(row) print('Prediction: %d' % yhat[0]) |
Running the example fits the random forest ensemble model on the entire dataset and is then used to make a prediction on a new row of data, as we might when using the model in an application.
|
1 |
Prediction: -173 |
Now that we are familiar with using the scikit-learn API to evaluate and use random forest ensembles, let’s look at configuring the model.
Random Forest Hyperparameters
In this section, we will take a closer look at some of the hyperparameters you should consider tuning for the random forest ensemble and their effect on model performance.
Explore Number of Samples
Each decision tree in the ensemble is fit on a bootstrap sample drawn from the training dataset.
This can be turned off by setting the “bootstrap” argument to False, if you desire. In that case, the whole training dataset will be used to train each decision tree. This is not recommended.
The “max_samples” argument can be set to a float between 0 and 1 to control the percentage of the size of the training dataset to make the bootstrap sample used to train each decision tree.
For example, if the training dataset has 100 rows, the max_samples argument could be set to 0.5 and each decision tree will be fit on a bootstrap sample with (100 * 0.5) or 50 rows of data.
A smaller sample size will make trees more different, and a larger sample size will make the trees more similar. Setting max_samples to “None” will make the sample size the same size as the training dataset and this is the default.
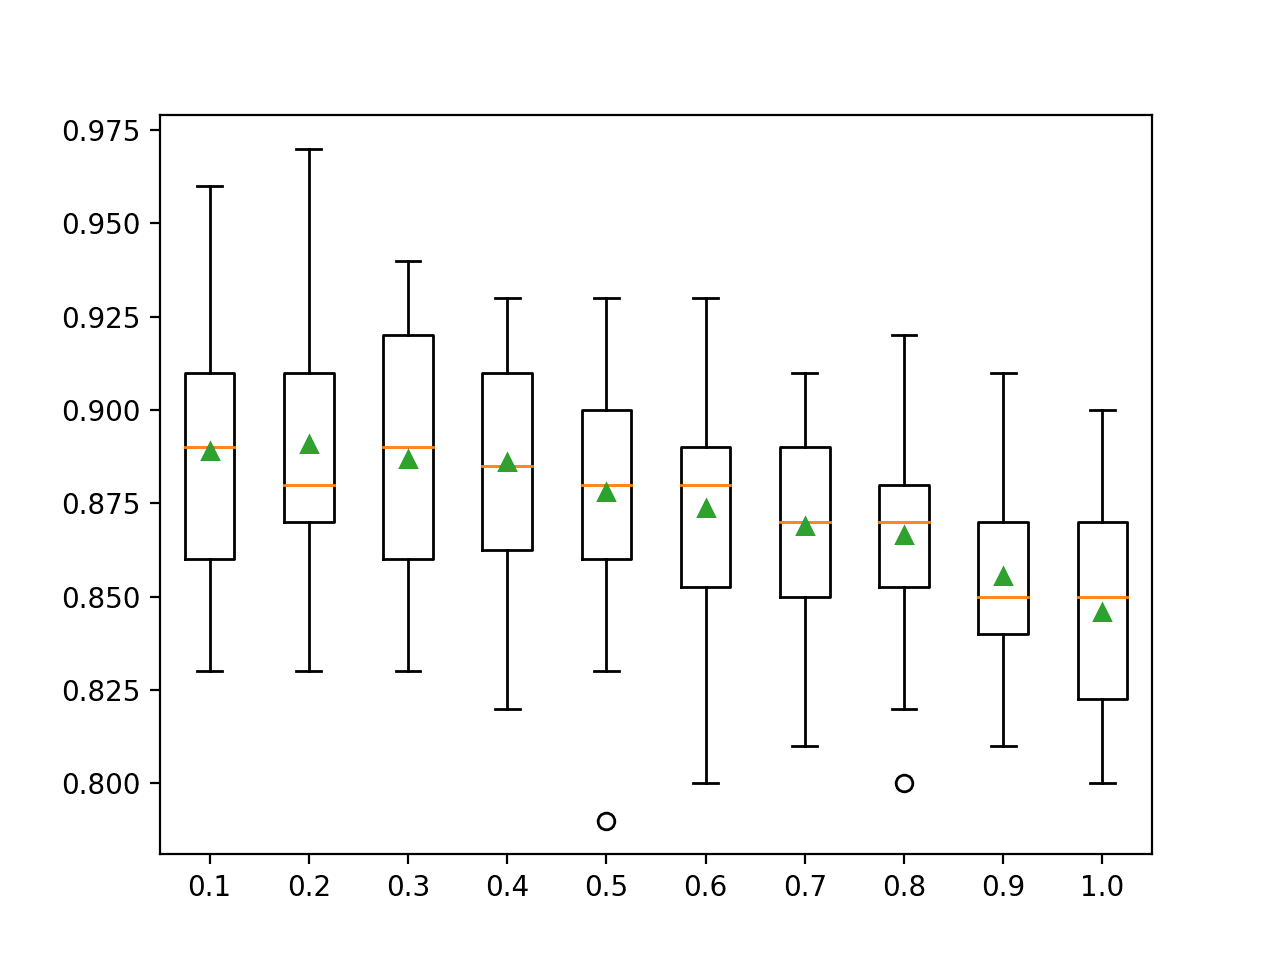
The example below demonstrates the effect of different bootstrap sample sizes from 10 percent to 100 percent on the random forest algorithm.
|
1 2 3 4 5 6 7 8 9 10 11 12 13 14 15 16 17 18 19 20 21 22 23 24 25 26 27 28 29 30 31 32 33 34 35 36 37 38 39 40 41 42 43 44 45 46 47 48 49 50 51 52 |
# explore random forest bootstrap sample size on performance from numpy import mean from numpy import std from numpy import arange from sklearn.datasets import make_classification from sklearn.model_selection import cross_val_score from sklearn.model_selection import RepeatedStratifiedKFold from sklearn.ensemble import RandomForestClassifier from matplotlib import pyplot # get the dataset def get_dataset(): X, y = make_classification(n_samples=1000, n_features=20, n_informative=15, n_redundant=5, random_state=3) return X, y # get a list of models to evaluate def get_models(): models = dict() # explore ratios from 10% to 100% in 10% increments for i in arange(0.1, 1.1, 0.1): key = '%.1f' % i # set max_samples=None to use 100% if i == 1.0: i = None models[key] = RandomForestClassifier(max_samples=i) return models # evaluate a given model using cross-validation def evaluate_model(model, X, y): # define the evaluation procedure cv = RepeatedStratifiedKFold(n_splits=10, n_repeats=3, random_state=1) # evaluate the model and collect the results scores = cross_val_score(model, X, y, scoring='accuracy', cv=cv, n_jobs=-1) return scores # define dataset X, y = get_dataset() # get the models to evaluate models = get_models() # evaluate the models and store results results, names = list(), list() for name, model in models.items(): # evaluate the model scores = evaluate_model(model, X, y) # store the results results.append(scores) names.append(name) # summarize the performance along the way print('>%s %.3f (%.3f)' % (name, mean(scores), std(scores))) # plot model performance for comparison pyplot.boxplot(results, labels=names, showmeans=True) pyplot.show() |
Running the example first reports the mean accuracy for each dataset size.
Note: Your results may vary given the stochastic nature of the algorithm or evaluation procedure, or differences in numerical precision. Consider running the example a few times and compare the average outcome.
In this case, the results suggest that using a bootstrap sample size that is equal to the size of the training dataset achieves the best results on this dataset.
This is the default and it should probably be used in most cases.
|
1 2 3 4 5 6 7 8 9 10 |
>10 0.856 (0.031) >20 0.873 (0.029) >30 0.881 (0.021) >40 0.891 (0.033) >50 0.893 (0.025) >60 0.897 (0.030) >70 0.902 (0.024) >80 0.903 (0.024) >90 0.900 (0.026) >100 0.903 (0.027) |
A box and whisker plot is created for the distribution of accuracy scores for each bootstrap sample size.
In this case, we can see a general trend that the larger the sample, the better the performance of the model.
You might like to extend this example and see what happens if the bootstrap sample size is larger or even much larger than the training dataset (e.g. you can set an integer value as the number of samples instead of a float percentage of the training dataset size).
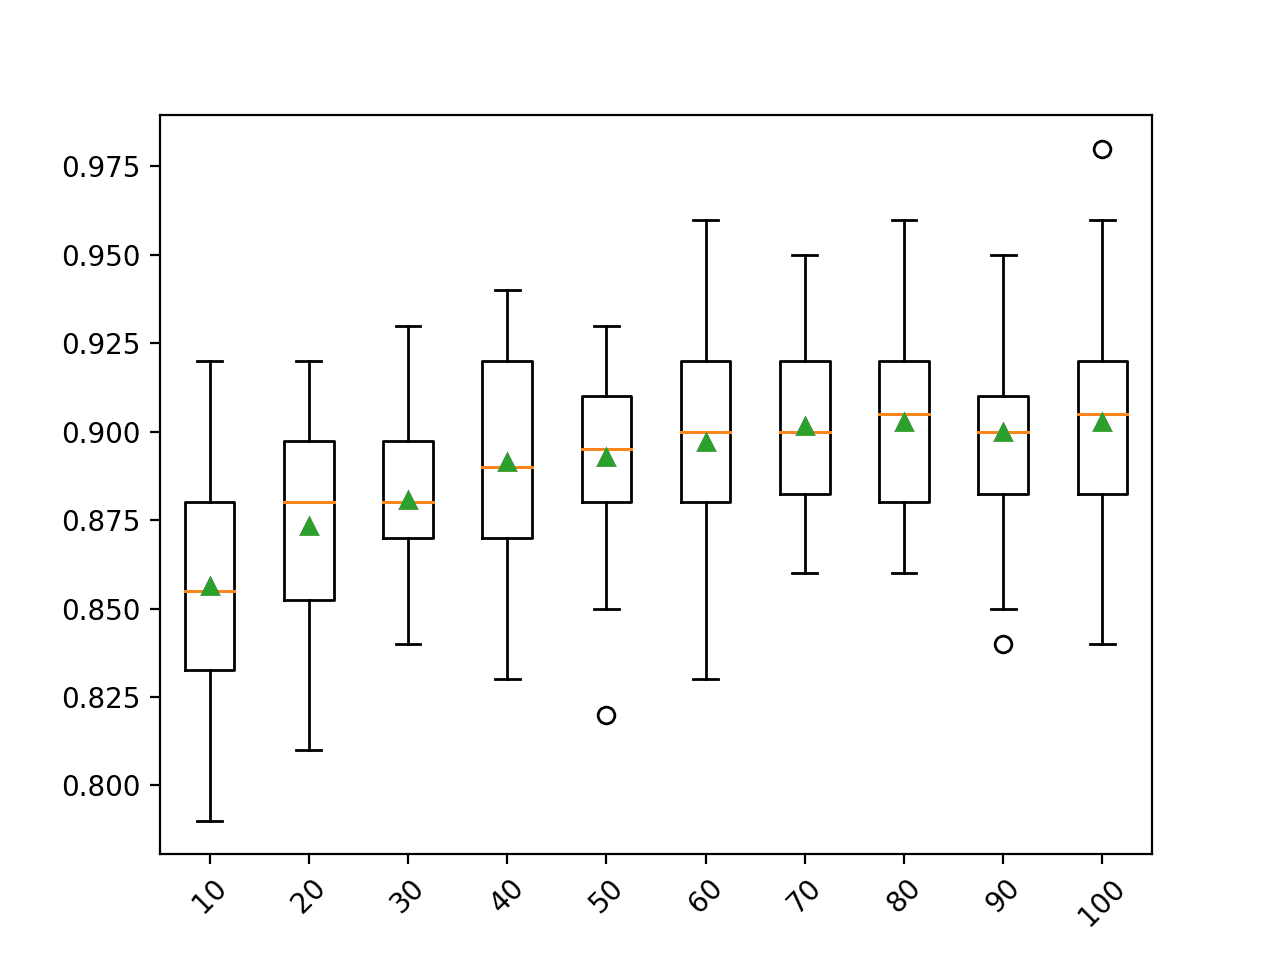
Box Plot of Random Forest Bootstrap Sample Size vs. Classification Accuracy
Explore Number of Features
The number of features that is randomly sampled for each split point is perhaps the most important feature to configure for random forest.
It is set via the max_features argument and defaults to the square root of the number of input features. In this case, for our test dataset, this would be sqrt(20) or about four features.
The example below explores the effect of the number of features randomly selected at each split point on model accuracy. We will try values from 1 to 7 and would expect a small value, around four, to perform well based on the heuristic.
|
1 2 3 4 5 6 7 8 9 10 11 12 13 14 15 16 17 18 19 20 21 22 23 24 25 26 27 28 29 30 31 32 33 34 35 36 37 38 39 40 41 42 43 44 45 46 47 |
# explore random forest number of features effect on performance from numpy import mean from numpy import std from sklearn.datasets import make_classification from sklearn.model_selection import cross_val_score from sklearn.model_selection import RepeatedStratifiedKFold from sklearn.ensemble import RandomForestClassifier from matplotlib import pyplot # get the dataset def get_dataset(): X, y = make_classification(n_samples=1000, n_features=20, n_informative=15, n_redundant=5, random_state=3) return X, y # get a list of models to evaluate def get_models(): models = dict() # explore number of features from 1 to 7 for i in range(1,8): models[str(i)] = RandomForestClassifier(max_features=i) return models # evaluate a given model using cross-validation def evaluate_model(model, X, y): # define the evaluation procedure cv = RepeatedStratifiedKFold(n_splits=10, n_repeats=3, random_state=1) # evaluate the model and collect the results scores = cross_val_score(model, X, y, scoring='accuracy', cv=cv, n_jobs=-1) return scores # define dataset X, y = get_dataset() # get the models to evaluate models = get_models() # evaluate the models and store results results, names = list(), list() for name, model in models.items(): # evaluate the model scores = evaluate_model(model, X, y) # store the results results.append(scores) names.append(name) # summarize the performance along the way print('>%s %.3f (%.3f)' % (name, mean(scores), std(scores))) # plot model performance for comparison pyplot.boxplot(results, labels=names, showmeans=True) pyplot.show() |
Running the example first reports the mean accuracy for each feature set size.
Note: Your results may vary given the stochastic nature of the algorithm or evaluation procedure, or differences in numerical precision. Consider running the example a few times and compare the average outcome.
In this case, the results suggest that a value between three and five would be appropriate, confirming the sensible default of four on this dataset. A value of five might even be better given the smaller standard deviation in classification accuracy as compared to a value of three or four.
|
1 2 3 4 5 6 7 |
>1 0.897 (0.023) >2 0.900 (0.028) >3 0.903 (0.027) >4 0.903 (0.022) >5 0.903 (0.019) >6 0.898 (0.025) >7 0.900 (0.024) |
A box and whisker plot is created for the distribution of accuracy scores for each feature set size.
We can see a trend in performance rising and peaking with values between three and five and falling again as larger feature set sizes are considered.
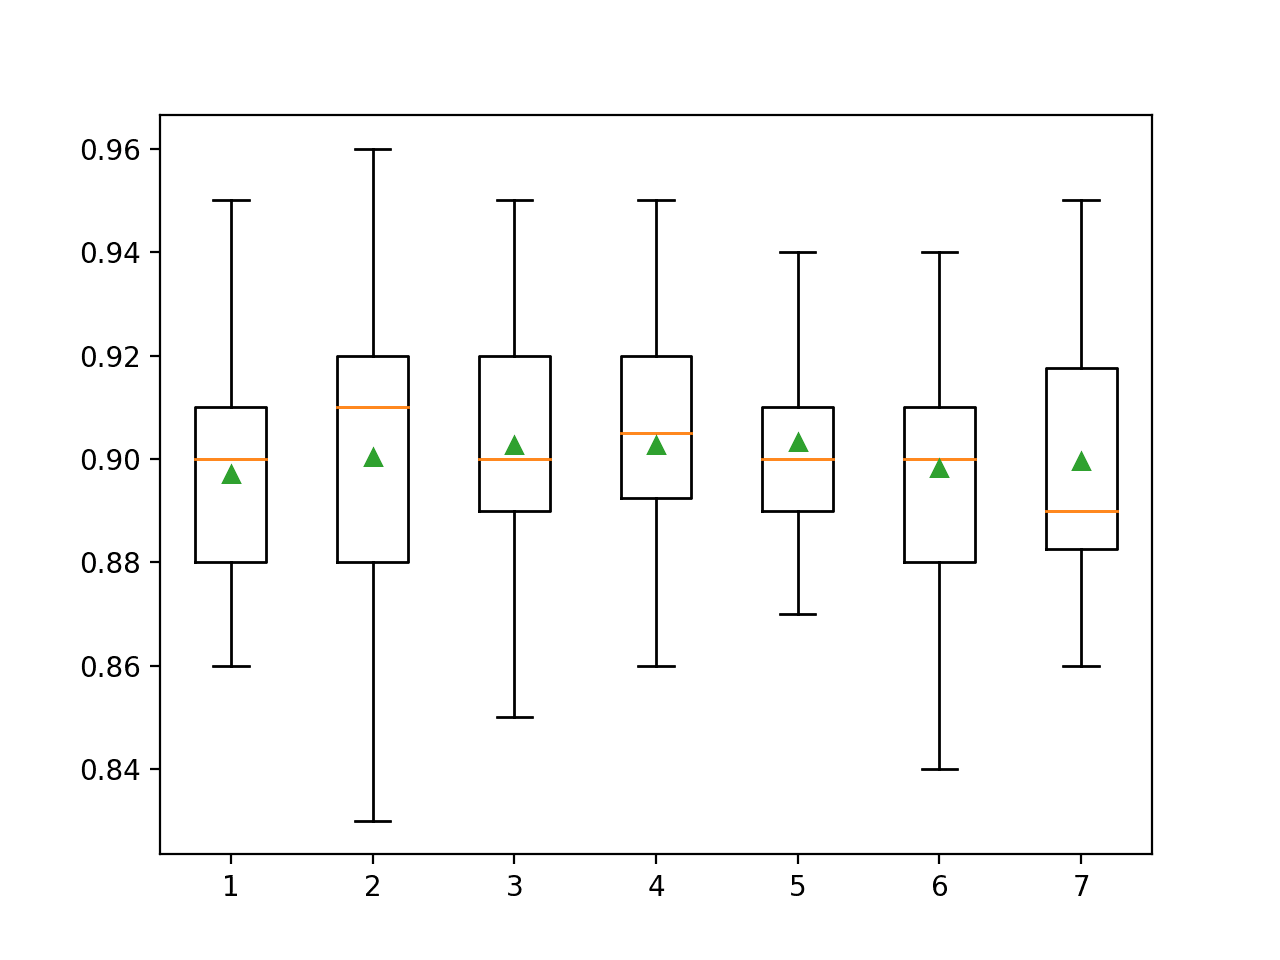
Box Plot of Random Forest Feature Set Size vs. Classification Accuracy
Explore Number of Trees
The number of trees is another key hyperparameter to configure for the random forest.
Typically, the number of trees is increased until the model performance stabilizes. Intuition might suggest that more trees will lead to overfitting, although this is not the case. Both bagging and random forest algorithms appear to be somewhat immune to overfitting the training dataset given the stochastic nature of the learning algorithm.
The number of trees can be set via the “n_estimators” argument and defaults to 100.
The example below explores the effect of the number of trees with values between 10 to 1,000.
|
1 2 3 4 5 6 7 8 9 10 11 12 13 14 15 16 17 18 19 20 21 22 23 24 25 26 27 28 29 30 31 32 33 34 35 36 37 38 39 40 41 42 43 44 45 46 47 48 |
# explore random forest number of trees effect on performance from numpy import mean from numpy import std from sklearn.datasets import make_classification from sklearn.model_selection import cross_val_score from sklearn.model_selection import RepeatedStratifiedKFold from sklearn.ensemble import RandomForestClassifier from matplotlib import pyplot # get the dataset def get_dataset(): X, y = make_classification(n_samples=1000, n_features=20, n_informative=15, n_redundant=5, random_state=3) return X, y # get a list of models to evaluate def get_models(): models = dict() # define number of trees to consider n_trees = [10, 50, 100, 500, 1000] for n in n_trees: models[str(n)] = RandomForestClassifier(n_estimators=n) return models # evaluate a given model using cross-validation def evaluate_model(model, X, y): # define the evaluation procedure cv = RepeatedStratifiedKFold(n_splits=10, n_repeats=3, random_state=1) # evaluate the model and collect the results scores = cross_val_score(model, X, y, scoring='accuracy', cv=cv, n_jobs=-1) return scores # define dataset X, y = get_dataset() # get the models to evaluate models = get_models() # evaluate the models and store results results, names = list(), list() for name, model in models.items(): # evaluate the model scores = evaluate_model(model, X, y) # store the results results.append(scores) names.append(name) # summarize the performance along the way print('>%s %.3f (%.3f)' % (name, mean(scores), std(scores))) # plot model performance for comparison pyplot.boxplot(results, labels=names, showmeans=True) pyplot.show() |
Running the example first reports the mean accuracy for each configured number of trees.
Note: Your results may vary given the stochastic nature of the algorithm or evaluation procedure, or differences in numerical precision. Consider running the example a few times and compare the average outcome.
In this case, we can see that performance rises and stays flat after about 100 trees. Mean accuracy scores fluctuate across 100, 500, and 1,000 trees and this may be statistical noise.
|
1 2 3 4 5 |
>10 0.870 (0.036) >50 0.900 (0.028) >100 0.910 (0.024) >500 0.904 (0.024) >1000 0.906 (0.023) |
A box and whisker plot is created for the distribution of accuracy scores for each configured number of trees.
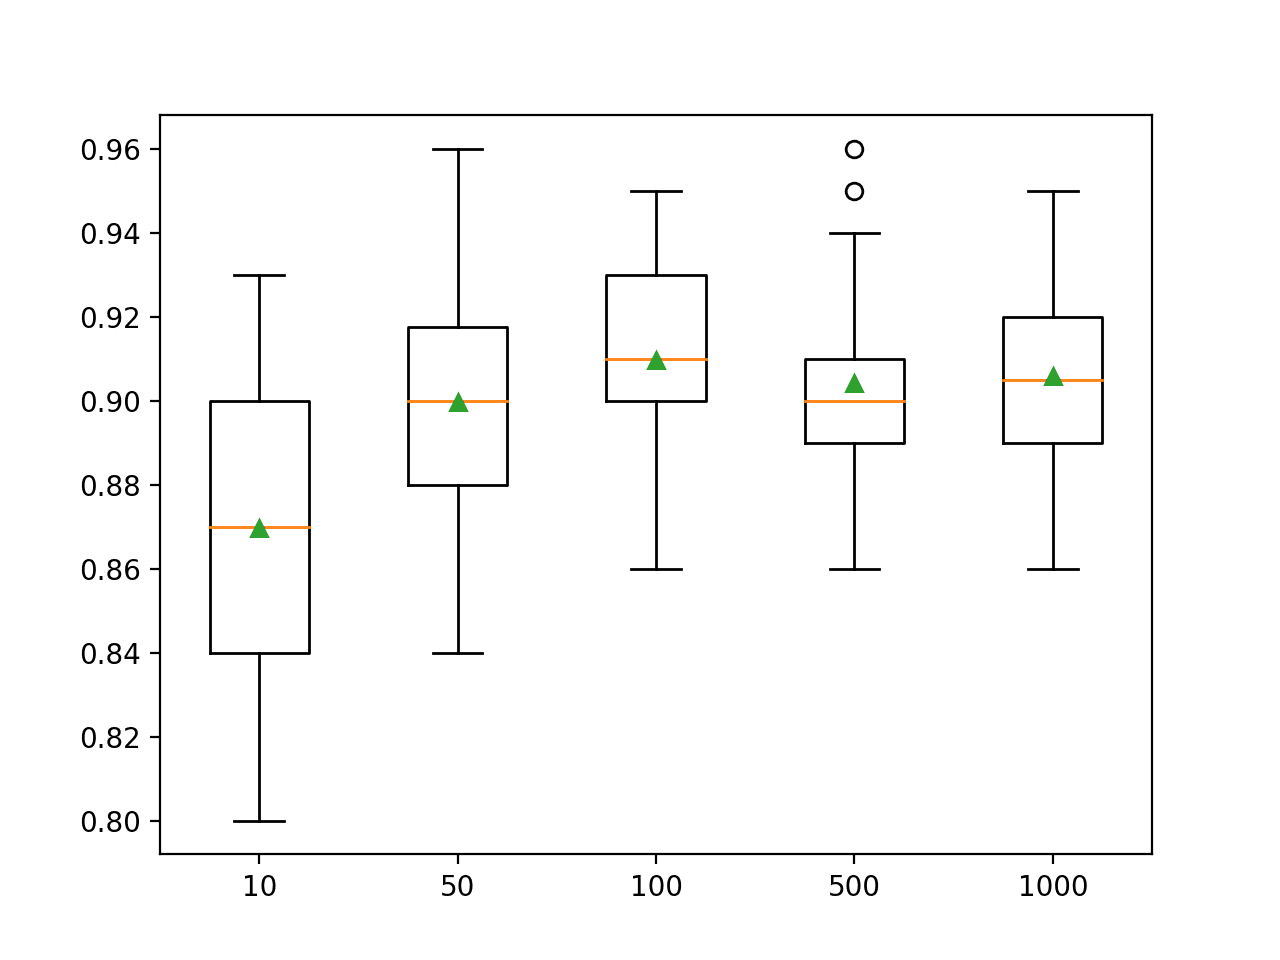
Box Plot of Random Forest Ensemble Size vs. Classification Accuracy
Explore Tree Depth
A final interesting hyperparameter is the maximum depth of decision trees used in the ensemble.
By default, trees are constructed to an arbitrary depth and are not pruned. This is a sensible default, although we can also explore fitting trees with different fixed depths.
The maximum tree depth can be specified via the max_depth argument and is set to None (no maximum depth) by default.
The example below explores the effect of random forest maximum tree depth on model performance.
|
1 2 3 4 5 6 7 8 9 10 11 12 13 14 15 16 17 18 19 20 21 22 23 24 25 26 27 28 29 30 31 32 33 34 35 36 37 38 39 40 41 42 43 44 45 46 47 48 |
# explore random forest tree depth effect on performance from numpy import mean from numpy import std from sklearn.datasets import make_classification from sklearn.model_selection import cross_val_score from sklearn.model_selection import RepeatedStratifiedKFold from sklearn.ensemble import RandomForestClassifier from matplotlib import pyplot # get the dataset def get_dataset(): X, y = make_classification(n_samples=1000, n_features=20, n_informative=15, n_redundant=5, random_state=3) return X, y # get a list of models to evaluate def get_models(): models = dict() # consider tree depths from 1 to 7 and None=full depths = [i for i in range(1,8)] + [None] for n in depths: models[str(n)] = RandomForestClassifier(max_depth=n) return models # evaluate a given model using cross-validation def evaluate_model(model, X, y): # define the evaluation procedure cv = RepeatedStratifiedKFold(n_splits=10, n_repeats=3, random_state=1) # evaluate the model and collect the results scores = cross_val_score(model, X, y, scoring='accuracy', cv=cv, n_jobs=-1) return scores # define dataset X, y = get_dataset() # get the models to evaluate models = get_models() # evaluate the models and store results results, names = list(), list() for name, model in models.items(): # evaluate the model scores = evaluate_model(model, X, y) # store the results results.append(scores) names.append(name) # summarize the performance along the way print('>%s %.3f (%.3f)' % (name, mean(scores), std(scores))) # plot model performance for comparison pyplot.boxplot(results, labels=names, showmeans=True) pyplot.show() |
Running the example first reports the mean accuracy for each configured maximum tree depth.
Note: Your results may vary given the stochastic nature of the algorithm or evaluation procedure, or differences in numerical precision. Consider running the example a few times and compare the average outcome.
In this case, we can see that larger depth results in better model performance, with the default of no maximum depth achieving the best performance on this dataset.
|
1 2 3 4 5 6 7 8 |
>1 0.771 (0.040) >2 0.807 (0.037) >3 0.834 (0.034) >4 0.857 (0.030) >5 0.872 (0.025) >6 0.887 (0.024) >7 0.890 (0.025) >None 0.903 (0.027) |
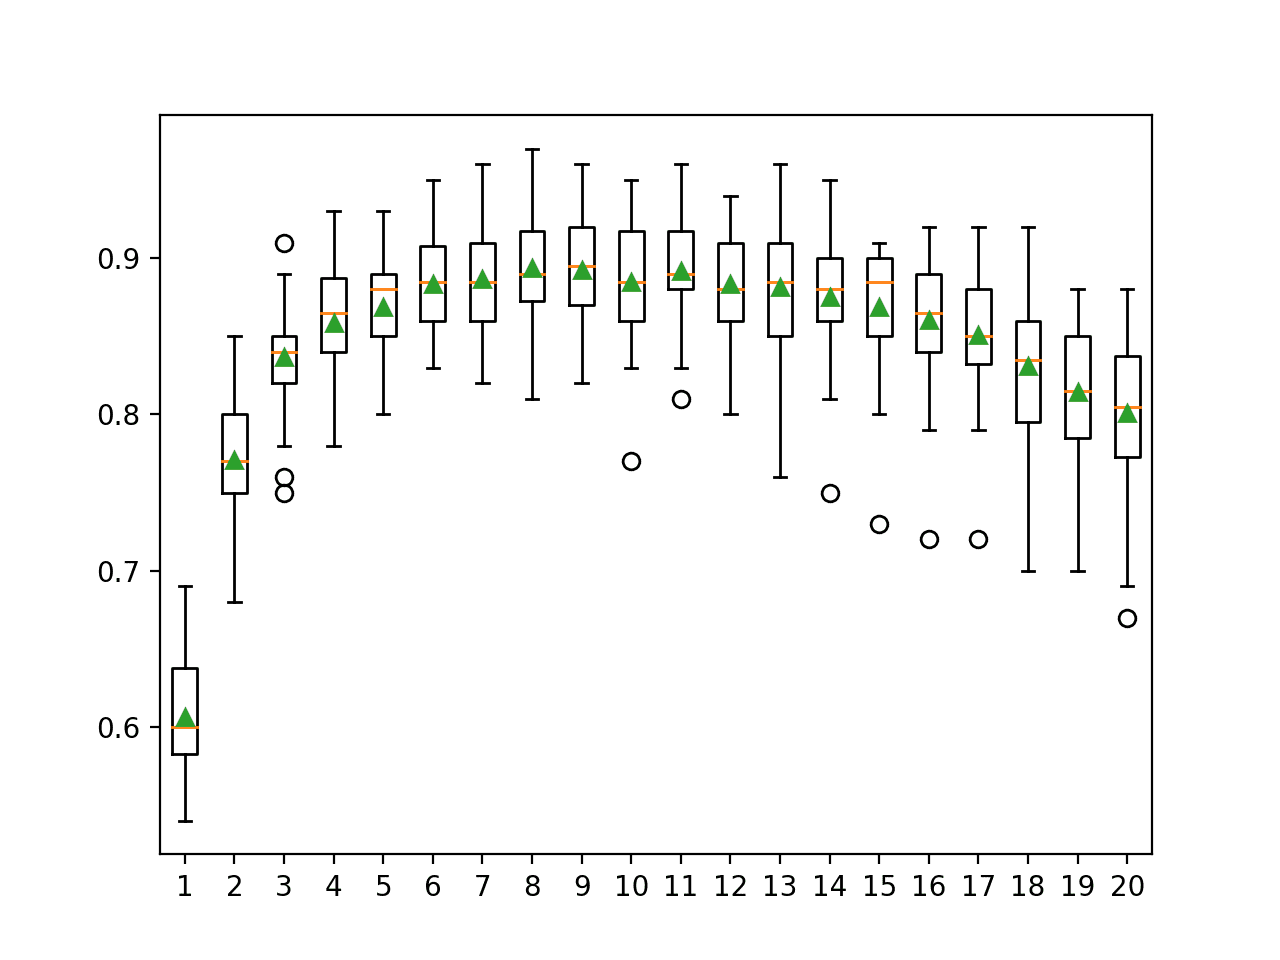
A box and whisker plot is created for the distribution of accuracy scores for each configured maximum tree depth.
In this case, we can see a trend of improved performance with increase in tree depth, supporting the default of no maximum depth.
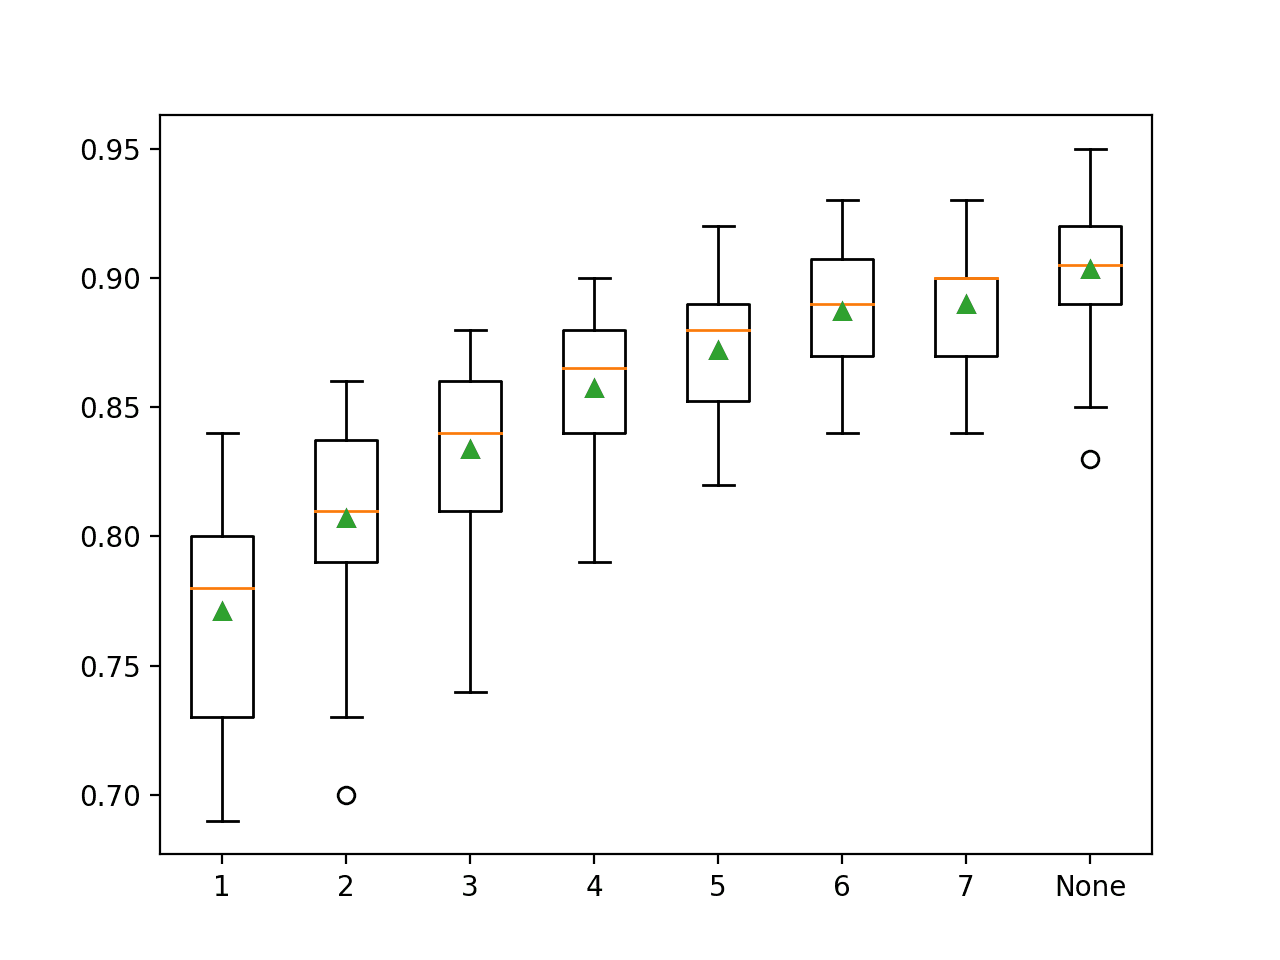
Box Plot of Random Forest Maximum Tree Depth vs. Classification Accuracy
Common Questions
In this section we will take a closer look at some common sticking points you may have with the radom forest ensemble procedure.
Q. What algorithm should be used in the ensemble?
Random forest is designed to be an ensemble of decision tree algorithms.
Q. How many ensemble members should be used?
The number of trees should be increased until no further improvement in performance is seen on your dataset.
As a starting point, we suggest using at least 1,000 trees. If the cross-validation performance profiles are still improving at 1,000 trees, then incorporate more trees until performance levels off.
— Page 200, Applied Predictive Modeling, 2013.
Q. Won’t the ensemble overfit with too many trees?
No. Random forest ensembles (do not) are very unlikely to overfit in general.
Another claim is that random forests “cannot overfit” the data. It is certainly true that increasing [the number of trees] does not cause the random forest sequence to overfit …
— Page 596, The Elements of Statistical Learning, 2016.
Q. How large should the bootstrap sample be?
It is good practice to make the bootstrap sample as large as the original dataset size.
That is 100% the size or an equal number of rows as the original dataset.
Q. How many features should be chosen at each split point?
The best practice is to test a suite of different values and discover what works best for your dataset.
As a heuristic, you can use:
- Classification: Square root of the number of features.
- Regression: One third of the number of features.
Q. What problems are well suited to random forest?
Random forest is known to work well or even best on a wide range of classification and regression problems. Try it and see.
The authors make grand claims about the success of random forests: “most accurate”, “most interpretable”, and the like. In our experience random forests do remarkably well, with very little tuning required.
— Page 590, The Elements of Statistical Learning, 2016.
Further Reading
This section provides more resources on the topic if you are looking to go deeper.
Tutorials
Papers
- Random Forests, 2001.
Books
- Applied Predictive Modeling, 2013.
- The Elements of Statistical Learning, 2016.
- An Introduction to Statistical Learning with Applications in R, 2014.
APIs
Articles
Summary
In this tutorial, you discovered how to develop random forest ensembles for classification and regression.
Specifically, you learned:
- Random forest ensemble is an ensemble of decision trees and a natural extension of bagging.
- How to use the random forest ensemble for classification and regression with scikit-learn.
- How to explore the effect of random forest model hyperparameters on model performance.
Do you have any questions?
Ask your questions in the comments below and I will do my best to answer.




Hi Jason
Hope you are doing well in this time of lock down.
Great articles as usual. Although I like to apply RF in my regression problem. However, I have issue with memory as the data is huge.
Any advise using RF for huge data set?
Thanks
Dennis
Perhaps prepare a prototype on a small sample of data first to see if it is effective.
More ideas here:
https://machinelearningmastery.com/faq/single-faq/how-can-i-run-large-models-or-models-on-lots-of-data
Hi Jason, Are you planning a new book on EnsembleS?
Not sure at this stage.
Are there ensemble topics you’d like me to write about?
probably advanced stacking and how to win kaggle/data science competitions
This will help:
https://machinelearningmastery.com/stacking-ensemble-machine-learning-with-python/
And this:
https://machinelearningmastery.com/super-learner-ensemble-in-python/
Thank you so much for your great support!
You’re welcome.
Hi Jason,
I’m implementing a Random Forest and I’m getting a shifted time-series in the predictions. If I build the model for predicting e.g. 4 steps ahead, my time-series of predictions seems 4 steps shifted to the right comparing to my time-series of observations. If I try to predict 16 steps ahead, it seems 16 steps shifted.
Any idea why this could be happening?
Thanks for all your tutorials!
Yes, it sounds like the model has learned a persistence (no skill) forecast. E.g. it predicts the input as the output.
Hi Jason,
Thanks a lot for your reply.
I’m also wondering, if I try to build a model where my train set has more variables than my test set, how should I proceed?
As far as I’ve seen about it, I should recreate those missing variables in my test dataframe and set them as 0.
The number of variables (columns) must be the same in train and test sets.
Very nice tutorial of RF usage!
It is really practical to know good practices on those models – from my experience Random Forests are very competitive in real industrial applications! (often outperforms such competitors as Artificial Neural Networks).
Regards!
Thanks!
Agreed. XGBoost more so.
Hi Jason,
Please, check it:
“This means that larger negative MAE are better and a perfect model has a MAE of 0.”
Thank you! enjoying a lot this stuff.
It is correct.
-10 is greater than -100.
0 is greater than -10.
Hello Jason, Please I have a question
I have the following situation that is already programmed with Logistic regression, I have tried the same program with Random Forest in order to check how it could improve the accuracy.
Actually, the accuracy was improved, but I don’t know if it is logical to use the Random Forest in my problem case.
My case study is as follow :
Based on a market dataset, I need to predict if a customer will buy a product or not depending on his prior history. I.e to know how much a customer bought the same product previously, and how much he just check it without buying it
The used data has the following structure:
Id clients CurrectProd P1+ P1- P2+ P2- P3+ P3- … PN+ PN- Output
10 CL1 P1, P3 6 1 0 0 8 2 0 0 1
11 CL1 P1, P2 7 1 5 2 0 0 0 0 1
with:
CurrentProd: means a list of products that I need to know if a customer will purchase,
P1+: mean how many time à client buy product 1,
P1-: refers to the number that a client checked a product 1 without buying it.
columns present all products existing in the market so that I have data with too many features (min 200 PRODUCT) and at each row the most of those row take value 0 (becose there are not belong to CurrentPRod
So I want to know if the random forest could be used in this situation
PS: I must use the data as it is without any change in features or structure
Id..|..clients..|..CurrectProd..|.P1+.|.P1-.|.P2+.|.P2-.|.P3+.|.P3-.|. … .|.PN+.|.PN-.|.Output
10.|….CL1….|……P1, P3……|…6….|..1…|…0….|…0…|..8….|…2…|. … .|…0…|…0….|….1
11.|….CL1….|……P1, P2……|…7….|..1…|…5….|…2…|…0…|…0…|. … .|…0…|…0….|….1
Perhaps try it and compare results.
The key will to find an appropriate representation for the problem. This may give you ideas (replace site with product):
https://machinelearningmastery.com/faq/single-faq/how-to-develop-forecast-models-for-multiple-sites
Thanks for your quick replay
I have already tried it, and it gives me a good result,
but I want to know if it is logical to use it with 200 features (Product1, Product2….)
Use the features that result in the best performance, regardless of how many.
how to decide these paramters
n_samples=1000, n_features=20, n_informative=15, n_redundant=5, random_state=3
any suggestion on this please.
This defines the test problem, it is completely arbitrary.
The ideas is you replace this with your own dataset.
what are the best practice , also if i want to learn about the meaning of these parameter.
please share some information about the hyper parameter tuning.
Best practice for test problems? I don’t understand.
Best practice for hyperparameter tuning is in the above example, e.g. grid search.
Perfect!
Thanks!
Thanks for such comprehensive article,
I wonder to know is there any way to find out that under which condition my model has wrong prediction, i mean is there any way to find (range) values for features that tell me that the prediction of the learned model is not reliable. Or let machine learn that when the prediction could not be reliable.
I think it could be, some how , the other way around of machine learning ,isnt it?
Any suggestions for it?
Quite impossible to know because a machine learning model is learned from the data provided. You’re simply asking what the provided data did not cover.
Hello Jason,
Thanks for your articles, they are very useful!
Do you know how can I get a graphic representation of the trees in the trained model ? I was trying to use export_graphviz in sklearn, but using “cross_val_scores” function fitting estimator on its own, i don´t know how to use export_gaphviz function.
Thanks in advance for your answer.
Francisco
I believe it’s possible but I have not done it before, sorry Francisco.
Hi Jason,
Thanks for the clear and useful introduction.
I have a question on how the Random Forest algorithm handles missing features.
For example suppose the data set is a 24H time series, for which I want to build a classifier.
Some of the features are available only in daytime, some only in night-time, and some others are partly unavailable.
What is the best way to adapt the algorithm to address this task.
Thanks in advance,
Ilan
Perhaps try a suite of approaches for handling the missing data and discover what works well or best for your dataset.
Thanks a lot for the article.
I’ve just build my own RF Regressor, i have (2437, 45) shape. I have run my model and got r-square about 0.7
I want to improve it into 0.95. Any suggestion?
Thanks for help!
Perhaps some of these ideas will help:
https://machinelearningmastery.com/machine-learning-performance-improvement-cheat-sheet/
Hai sir,
I m having two seperate data frames. One for Training and another one for Testing. I need to perform Random Forest Classification. How to load these files to Random Forest without splitting.
You just load the training file first and assign to X_trian, y_train; then load the testing file to X_test, y_test. However, you must be sure the format are the same, including int vs float data types.
Hi Jason,
I always follow your post. I have a question , how can I use RepeatedStratifiedKFold for Random Forest Regression in Python? Do you have any tutorial on it? Thanks!
Do you think the example in here works? https://machinelearningmastery.com/dynamic-ensemble-selection-in-python/
Hi Json,
Thanks for another useful post. In the blog you mentioned that turning off the bootstrap is not recommended
“This can be turned off by setting the “bootstrap” argument to False, if you desire. In that case, the whole training dataset will be used to train each decision tree. This is not recommended.”
What is my X and y are time-dependent in nature. For example, they were from IoT sensors (e.g., meteorological observations). Turning off bootstrap makes sense to preserve the temporal structures, right?
Any suggestions/recommendations?
Thanks
For the RFR, when CV is used, it tells us the accuracy mean and all is good, but.. what if we say, ok, I want to use this to predict.. how do I do so? because I have not done the fit() yest. In this documentation, the fit() part is done as an ‘alternative’ to CV, prediction is used with this model fitted.. but what if I want to use a model fitted wit CV? how can I do so?
Hi Pedro…You may find the following of interest:
https://towardsdatascience.com/random-forest-ca80e56224c1
Hi! I wanna know if applying the repeated-k-fold cross validation to predict a categorical feature (map), its really necessary a test set?
Regards!
Hi Dim…the following may help clarify k-fold cross validation concepts:
https://machinelearningmastery.com/k-fold-cross-validation/
Hello.
Thank you for this detailed article with demo on using Random Forest algorithms.
I have a doubt regarding the bootstrap sample size.
Sir, you have mentioned that setting this sample size to the full training dataset will make the decision trees more similar, while a smaller sample size makes them more different. But the accuracy seems to increase with increase in the sample size hyperparameter as per the graph. How is this possible, since, does it not mean the decision tree models are relatively more correlated, having been trained on the same full dataset? If then, what is the correct percentage of bootstrap sample size to be used for practical problems.
Thanks in advance.
Hi PriyaKS…The following resource provides a great introduction to the bootstrap method:
https://machinelearningmastery.com/a-gentle-introduction-to-the-bootstrap-method/
Thank you for the very good article on Bootstrap method. It clarified what exactly is happening behind the sampling process. But, I am still unable to reconcile this statement “A smaller sample size will make trees more different, and a larger sample size will make the trees more similar” here -with- the accuracy coming out better for the larger sample size. Do we need the trees to be more different or similar for the accuracy? – because, while discussing about the number of features, “By reducing the features to a random subset that may be considered at each split point, it forces each decision tree in the ensemble to be more different,” is the reasoning.
So, any further clarification on why the accuracy is better for larger sample size(similar trees), will be greatly appreciated, Sir.
Thank you in advance.