Imbalanced classification are those prediction tasks where the distribution of examples across class labels is not equal.
Most imbalanced classification examples focus on binary classification tasks, yet many of the tools and techniques for imbalanced classification also directly support multi-class classification problems.
In this tutorial, you will discover how to use the tools of imbalanced classification with a multi-class dataset.
After completing this tutorial, you will know:
About the glass identification standard imbalanced multi-class prediction problem.
How to use SMOTE oversampling for imbalanced multi-class classification.
How to use cost-sensitive learning for imbalanced multi-class classification.
Kick-start your project with my new book Imbalanced Classification with Python, including step-by-step tutorials and the Python source code files for all examples.
Let’s get started.
Updated Jan/2021: Updated links for API documentation.
Multi-Class Imbalanced Classification Photo by istolethetv, some rights reserved.
Tutorial Overview
This tutorial is divided into three parts; they are:
Glass Multi-Class Classification Dataset
SMOTE Oversampling for Multi-Class Classification
Cost-Sensitive Learning for Multi-Class Classification
Glass Multi-Class Classification Dataset
In this tutorial, we will focus on the standard imbalanced multi-class classification problem referred to as “Glass Identification” or simply “glass.”
The dataset describes the chemical properties of glass and involves classifying samples of glass using their chemical properties as one of six classes. The dataset was credited to Vina Spiehler in 1987.
Ignoring the sample identification number, there are nine input variables that summarize the properties of the glass dataset; they are:
RI: Refractive Index
Na: Sodium
Mg: Magnesium
Al: Aluminum
Si: Silicon
K: Potassium
Ca: Calcium
Ba: Barium
Fe: Iron
The chemical compositions are measured as the weight percent in corresponding oxide.
There are seven types of glass listed; they are:
Class 1: building windows (float processed)
Class 2: building windows (non-float processed)
Class 3: vehicle windows (float processed)
Class 4: vehicle windows (non-float processed)
Class 5: containers
Class 6: tableware
Class 7: headlamps
Float glass refers to the process used to make the glass.
There are 214 observations in the dataset and the number of observations in each class is imbalanced. Note that there are no examples for class 4 (non-float processed vehicle windows) in the dataset.
Class 1: 70 examples
Class 2: 76 examples
Class 3: 17 examples
Class 4: 0 examples
Class 5: 13 examples
Class 6: 9 examples
Class 7: 29 examples
Although there are minority classes, all classes are equally important in this prediction problem.
The dataset can be divided into window glass (classes 1-4) and non-window glass (classes 5-7). There are 163 examples of window glass and 51 examples of non-window glass.
Window Glass: 163 examples
Non-Window Glass: 51 examples
Another division of the observations would be between float processed glass and non-float processed glass, in the case of window glass only. This division is more balanced.
Now that we are familiar with the glass multi-class classification dataset, let’s explore how we can use standard imbalanced classification tools with it.
Want to Get Started With Imbalance Classification?
Take my free 7-day email crash course now (with sample code).
Click to sign-up and also get a free PDF Ebook version of the course.
SMOTE Oversampling for Multi-Class Classification
Oversampling refers to copying or synthesizing new examples of the minority classes so that the number of examples in the minority class better resembles or matches the number of examples in the majority classes.
Perhaps the most widely used approach to synthesizing new examples is called the Synthetic Minority Oversampling TEchnique, or SMOTE for short. This technique was described by Nitesh Chawla, et al. in their 2002 paper named for the technique titled “SMOTE: Synthetic Minority Over-sampling Technique.”
Running the example first downloads the dataset and splits it into train and test sets.
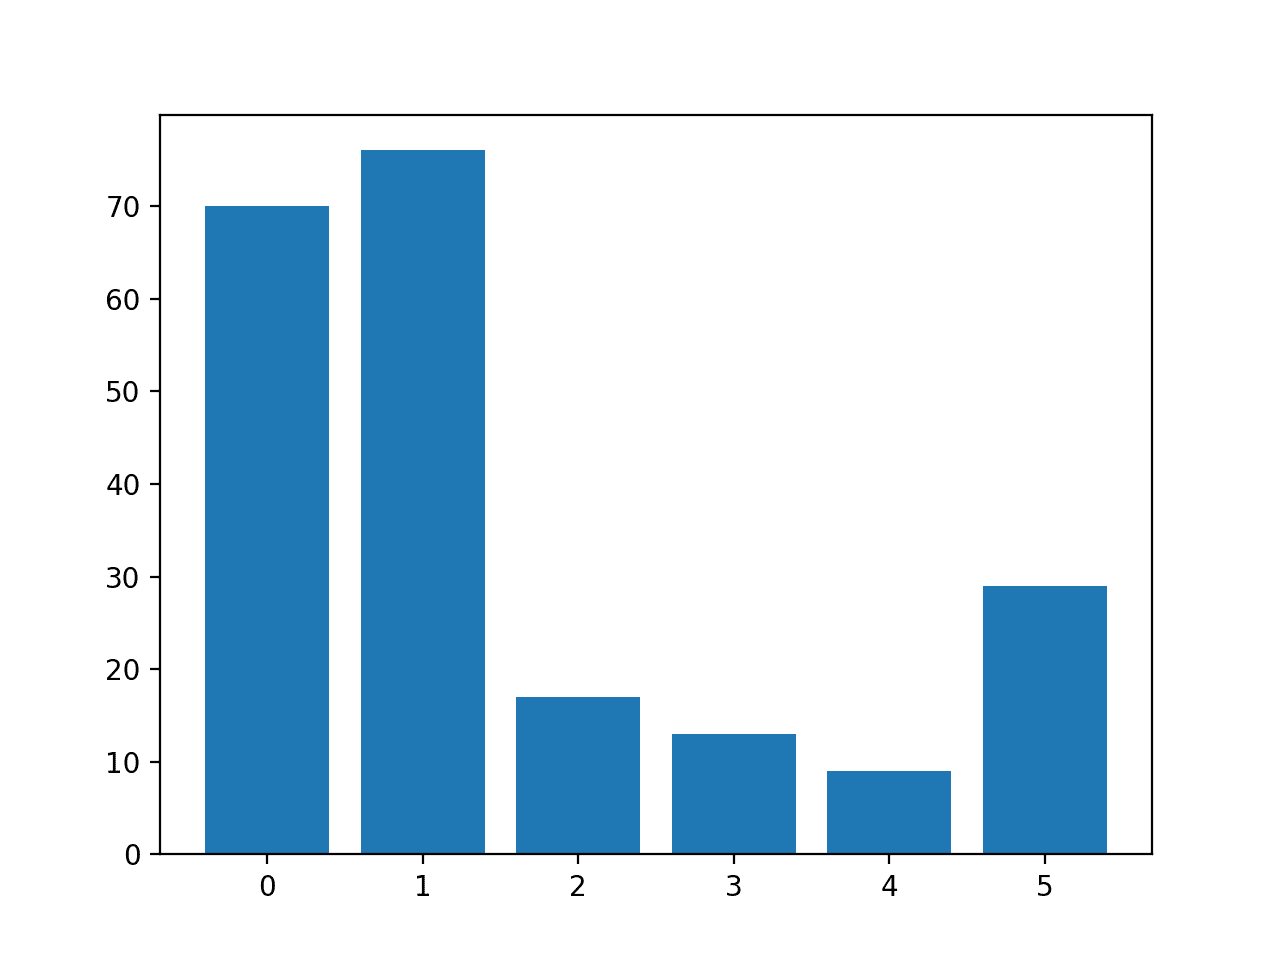
The number of rows in each class is then reported, confirming that some classes, such as 0 and 1, have many more examples (more than 70) than other classes, such as 3 and 4 (less than 15).
1
2
3
4
5
6
Class=0, n=70 (32.710%)
Class=1, n=76 (35.514%)
Class=2, n=17 (7.944%)
Class=3, n=13 (6.075%)
Class=4, n=9 (4.206%)
Class=5, n=29 (13.551%)
A bar chart is created providing a visualization of the class breakdown of the dataset.
This gives a clearer idea that classes 0 and 1 have many more examples than classes 2, 3, 4 and 5.
Histogram of Examples in Each Class in the Glass Multi-Class Classification Dataset
Next, we can apply SMOTE to oversample the dataset.
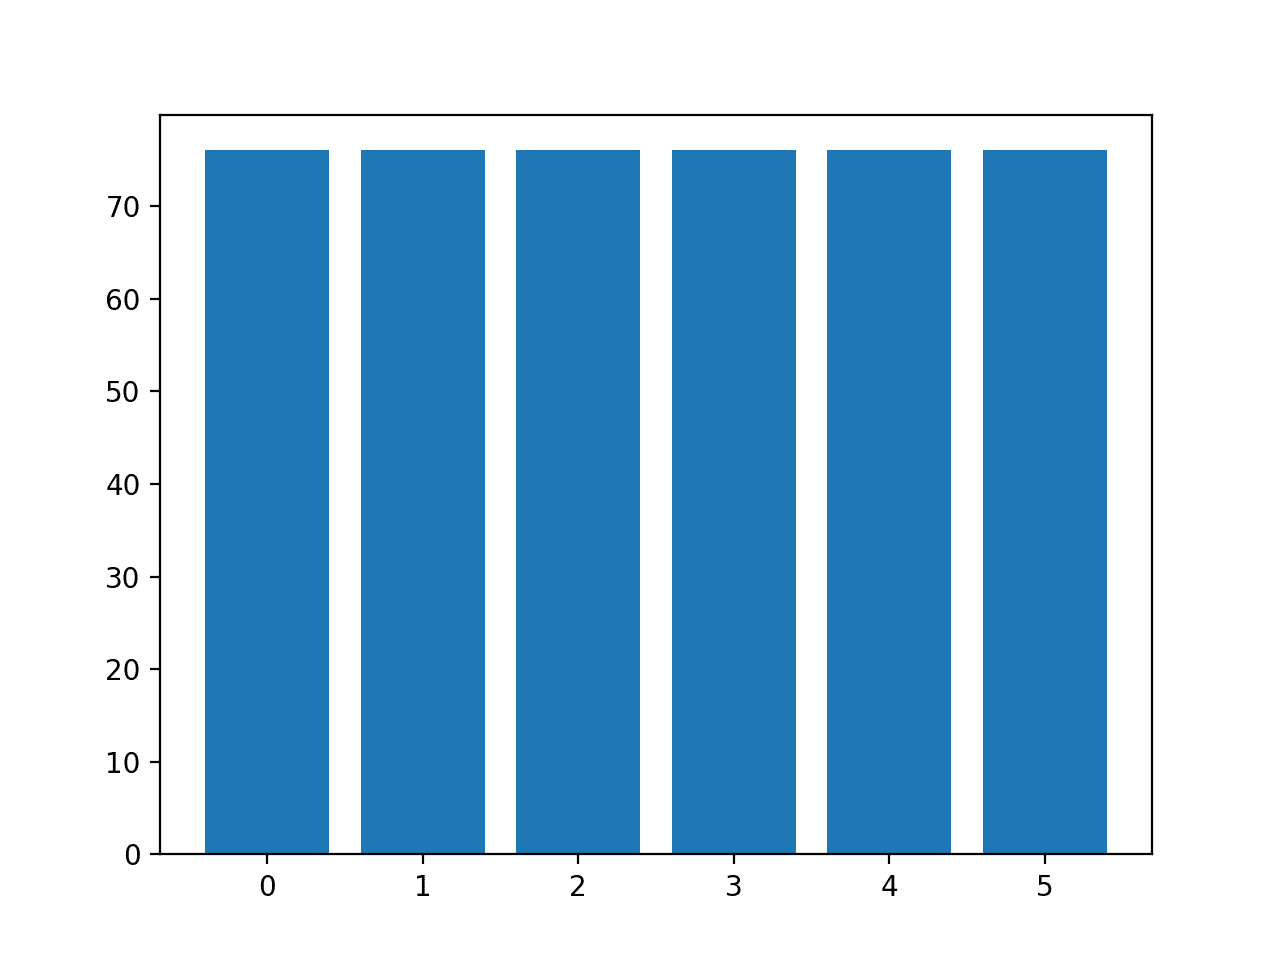
By default, SMOTE will oversample all classes to have the same number of examples as the class with the most examples.
In this case, class 1 has the most examples with 76, therefore, SMOTE will oversample all classes to have 76 examples.
The complete example of oversampling the glass dataset with SMOTE is listed below.
1
2
3
4
5
6
7
8
9
10
11
12
13
14
15
16
17
18
19
20
21
22
23
24
25
26
# example of oversampling a multi-class classification dataset
Running the example first loads the dataset and applies SMOTE to it.
The distribution of examples in each class is then reported, confirming that each class now has 76 examples, as we expected.
1
2
3
4
5
6
Class=0, n=76 (16.667%)
Class=1, n=76 (16.667%)
Class=2, n=76 (16.667%)
Class=3, n=76 (16.667%)
Class=4, n=76 (16.667%)
Class=5, n=76 (16.667%)
A bar chart of the class distribution is also created, providing a strong visual indication that all classes now have the same number of examples.
Histogram of Examples in Each Class in the Glass Multi-Class Classification Dataset After Default SMOTE Oversampling
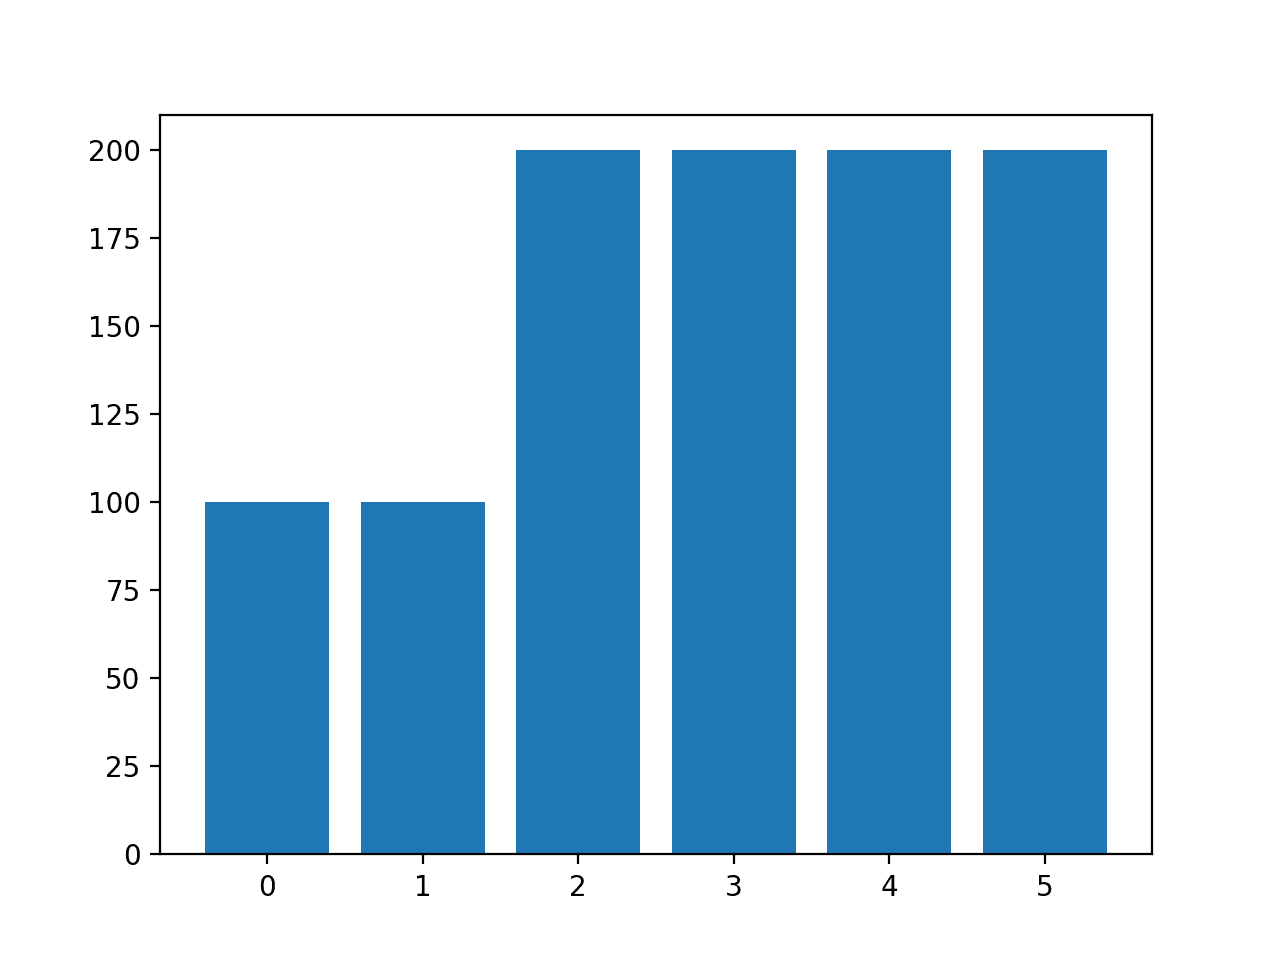
Instead of using the default strategy of SMOTE to oversample all classes to the number of examples in the majority class, we could instead specify the number of examples to oversample in each class.
For example, we could oversample to 100 examples in classes 0 and 1 and 200 examples in remaining classes. This can be achieved by creating a dictionary that maps class labels to the number of desired examples in each class, then specifying this via the “sampling_strategy” argument to the SMOTE class.
1
2
3
4
5
...
# transform the dataset
strategy={0:100,1:100,2:200,3:200,4:200,5:200}
oversample=SMOTE(sampling_strategy=strategy)
X,y=oversample.fit_resample(X,y)
Tying this together, the complete example of using a custom oversampling strategy for SMOTE is listed below.
1
2
3
4
5
6
7
8
9
10
11
12
13
14
15
16
17
18
19
20
21
22
23
24
25
26
27
# example of oversampling a multi-class classification dataset with a custom strategy
Running the example creates the desired sampling and summarizes the effect on the dataset, confirming the intended result.
1
2
3
4
5
6
Class=0, n=100 (10.000%)
Class=1, n=100 (10.000%)
Class=2, n=200 (20.000%)
Class=3, n=200 (20.000%)
Class=4, n=200 (20.000%)
Class=5, n=200 (20.000%)
Note: you may see warnings that can be safely ignored for the purposes of this example, such as:
1
UserWarning: After over-sampling, the number of samples (200) in class 5 will be larger than the number of samples in the majority class (class #1 -> 76)
A bar chart of the class distribution is also created confirming the specified class distribution after data sampling.
Histogram of Examples in Each Class in the Glass Multi-Class Classification Dataset After Custom SMOTE Oversampling
Note: when using data sampling like SMOTE, it must only be applied to the training dataset, not the entire dataset. I recommend using a Pipeline to ensure that the SMOTE method is correctly used when evaluating models and making predictions with models.
You can see an example of the correct usage of SMOTE in a Pipeline in this tutorial:
Cost-Sensitive Learning for Multi-Class Classification
Most machine learning algorithms assume that all classes have an equal number of examples.
This is not the case in multi-class imbalanced classification. Algorithms can be modified to change the way learning is performed to bias towards those classes that have fewer examples in the training dataset. This is generally called cost-sensitive learning.
For more on cost-sensitive learning, see the tutorial:
The mean and standard deviation classification accuracy are reported at the end of the run.
Note: Your results may vary given the stochastic nature of the algorithm or evaluation procedure, or differences in numerical precision. Consider running the example a few times and compare the average outcome.
In this case, we can see that the default model achieved a classification accuracy of about 79.6 percent.
1
Mean Accuracy: 0.796 (0.047)
We can specify the “class_weight” argument to the value “balanced” that will automatically calculates a class weighting that will ensure each class gets an equal weighting during the training of the model.
Running the example reports the mean and standard deviation classification accuracy of the cost-sensitive version of random forest on the glass dataset.
Note: Your results may vary given the stochastic nature of the algorithm or evaluation procedure, or differences in numerical precision. Consider running the example a few times and compare the average outcome.
In this case, we can see that the default model achieved a lift in classification accuracy over the cost-insensitive version of the algorithm, with 80.2 percent classification accuracy vs. 79.6 percent.
1
Mean Accuracy: 0.802 (0.044)
The “class_weight” argument takes a dictionary of class labels mapped to a class weighting value.
We can use this to specify a custom weighting, such as a default weighting for classes 0 and 1.0 that have many examples and a double class weighting of 2.0 for the other classes.
Tying this together, the complete example of using a custom class weighting for cost-sensitive learning on the glass multi-class imbalanced classification problem is listed below.
1
2
3
4
5
6
7
8
9
10
11
12
13
14
15
16
17
18
19
20
21
22
23
24
25
26
27
28
29
30
31
32
33
34
35
36
37
38
39
40
# cost sensitive random forest with custom class weightings
from numpy import mean
from numpy import std
from pandas import read_csv
from sklearn.preprocessing import LabelEncoder
from sklearn.model_selection import cross_val_score
from sklearn.model_selection import RepeatedStratifiedKFold
from sklearn.ensemble import RandomForestClassifier
Running the example reports the mean and standard deviation classification accuracy of the cost-sensitive version of random forest on the glass dataset with custom weights.
Note: Your results may vary given the stochastic nature of the algorithm or evaluation procedure, or differences in numerical precision. Consider running the example a few times and compare the average outcome.
In this case, we can see that we achieved a further lift in accuracy from about 80.2 percent with balanced class weighting to 80.8 percent with a more biased class weighting.
1
Mean Accuracy: 0.808 (0.059)
Further Reading
This section provides more resources on the topic if you are looking to go deeper.
It provides self-study tutorials and end-to-end projects on: Performance Metrics, Undersampling Methods, SMOTE, Threshold Moving, Probability Calibration, Cost-Sensitive Algorithms
and much more...
Bring Imbalanced Classification Methods to Your Machine Learning Projects
Hello Jason, thanks for the excellent article. My question is to what extent should oversampling be done as a rule of thumb? I have a dataset of 6 classes with the number of examples as following (approx.): [10000, 1000, 12000, 8000, 400, 6000]. So is it okay to oversample the classes with 400, 1000 examples to 12000 level?
Hello Jasonn,
I’ve seen it is possible to use XGBoost for Time Series.
Where also is possibile to apply XGBoost (i.e what are typical applications of XGBoost)?
Is time serie a kind of regression?
Thanks,
Marco
Good morning Sir!
Hopefully you will be fine with good health. Sir i face a problem in machine learning classifier training and testing and this problem is due to dataset. i use UNSW-NB15 dataset which is attack dataset. there is two feature one is attack category and the other is Label feature. Now i am confuse that how to use this two feature in machine learning classifier as a Label class. Kindly quide me thanks in advance.
Hi Jason, interesting article. I didn’t find any mentioning about text data. I assume this would work as with any form of vectorised data, right?
Do you have made any experiences with that so far or would you suggest another lib or approach for imbalanced textual data?
Very good article!
Out of your experience, what is better, oversampling or cost-sensitive learning?
Certainly oversampling gives you control over the sampling method. But beside that?
Great article as always!
Can you please advise if it is necessary to take care of imbalance if I am modeling intents of text (say 50 intent labels from 16000 texts) where intents have imbalanced frequencies? What happens if I dont treat imbalance?
I hope your are fine ?
Thanks you for this article , it is very helpful and clearly simple.
Actually , i work in ML porject, particularly in NLP project with mutiple class imbalanced but also a small dataset. I have 465 class for only 1050 examples and 3 columns which are a list of few word (not structured sentence or paragraph ). This is very small as is said. Do you know how i can resolve this problem please? . How i can apply smote method for text data ? Do you know an api or library to add external corpus to my corpus ?
Do you please have some articles or ideas you suggeste me.
Hi,Jason, I want to know how to caculate the cost matrix or class_weight in my project?
And what do you think can I need use the cost_sensitive learning with feature selection before XGboost? I was going to use dataset balanced and feature selection before XGboost.
Look forward to your answer. Thanks you a lot in advance
is it possible to use any single option like smote to use for both binary and multi-class problems in a single code base?
like we will give the dataset and algorithm will realize is it binary or multi class problem and then predict according to them.
Hi, Jason, would confusion matrix help to see the comparison of balanced data with SMOTE and imbalanced data? If yes how should I apply the confusion matrix before SMOTE oversampling?
Note that confusion matrix tells how your model output related to the truth in the training data. Therefore, you cannot. You need to apply the data to train one model with SMOTE and one without, and then you get two confusion matrices to compare.
Thank you for the reply! how can I get the two confusion matrices to compare? Would there be any tutorials from your post using confusion matrices? : “You need to apply the data to train one model with SMOTE and one without” I would love to try this out on my own and compare two confusion matrices.
Hi Adrian! thanks for the reply again! Would the dataset that Jason used for this article which is the (glass dataset )be able to split as well to train_test_split?
Hi @Jason Brownlee – I have a dataset something like below.
FeatureA Target
a,b,c,d xyz
Multiple categorical values in FeatureA with comma separated and I need to predict the Target categorical value.
I have few questions:
1. How to plot the graphs on this data?
2. What is best way to resolve imbalance issues.
3. How to plot accuracy graphs like CM, F1, Precision and Recall.
(1) If you use categorial value to plot categorical value, I think you can simply do the count of a=value1 to xyz=value1, then you get a matrix of count.
(2) did you tried SMOTE?
(3) If target is binary, I believe the most common graph is ROC
1. a,b,c,d are in a single feature, not in a different feature. In that case, do I need to separate it as different features?
2. Yes, I have tried SMOTENC which is for categorical and numerical, but I do not have numerical features in this dataset. Any other suggestions for oversampling the data?
3. My target is categorical again, not binary.
(1) Same. You have 4 different possible values in the feature, and N different class in the target, then you have a table of 4xN
(2) If you have no numerical values in input, SMOTE is not suitable. Maybe you can just do a bootstrap resampling: https://machinelearningmastery.com/a-gentle-introduction-to-the-bootstrap-method/
(3) You can consider mean-F1 as the score function
I have used SMOTEN and resampled the imbalanced classes and now train, test, and cross-validation accuracies are high(around 99%), but when I tested with the unseen data most of the times model is unable to predict. Could you pls help me what is the issue with my model training?
Unable to predict means predicted the opposite class? I would go back to check your model and how you handled the data in the training. The always high 99% accuracy maybe not a realistic result in most cases.
It’s a great article
Is it possible to apply SMOTE to computer vision systems?
because when I tried to use SMOTE with images and pass my images dataset to fit_resample(X, y) function it’s not working, an error appeared to me which is ” the fit_resample function Found array with dim 3. Estimator expected <= 2)
if the fit_resample(X, y) accepts a 3-dimensional array, please tell me how to do it?
SMOTE is about a vector space model, which a data point is represented by a coordinate (x1,x2,…,xn). If your computer vision system can recognize input in this format, I believe SMOTE can work too. But generally converting a 2D pixels (i.e., images) into 1D vector does not work well.
Actually i want to apply SMOTE to my image dataset which contains 5955 images with 4 classes (2552, 227, 621, 2555). Could anyone please help me. It would be greatly appreciated!
I appreciate your help in advance
very nice work. Thank you, as usual, for covering so many useful topics in your articles
I would ask you the following questions: in my dataset the 3-class multiclass target has the class proportions = [ 1, 16, 83] If I try the Cost-Sensitive Learning strategy with class weights end the metrics are good, should I also try SMOTE due to the very low proportion ( 1% ) of the most minority class?
Hi! Thank you so much for the explanation, it helps a lot.
I’d ask some following questions:
I am trying to apply cost-sensitive learning to the Random Forest classifier for my multi-class imbalanced dataset. Is the weight on the code is the same with the cost matrix? I can see that you give 1.0 to majority classes and 2.0 to others. Is there any base or references to decide what value of weight should I assign to each class?
Hope this question finds you well. Thank you so much.
hi jason your training and testing data’s are same so accuracy could be good . can u please split the data as train and test after prediction show some classification report so that we can find how the models are predicting the other classes


Hello Jason, thanks for the excellent article. My question is to what extent should oversampling be done as a rule of thumb? I have a dataset of 6 classes with the number of examples as following (approx.): [10000, 1000, 12000, 8000, 400, 6000]. So is it okay to oversample the classes with 400, 1000 examples to 12000 level?
I would suggest you try it – just like any method, then use what works best for your specific dataset.
Hello Jason,
I’ve found a useful map at https://scikit-learn.org/stable/tutorial/machine_learning_map/index.html (but it is only for scikit learn).
Did you make a map (or mind map) that helps to chose the right classifier/ regressor? (or do you advice where I can find it?)
Thanks,
Marco
This might help:
https://machinelearningmastery.com/a-tour-of-machine-learning-algorithms/
Hello Jasonn,
I’ve seen it is possible to use XGBoost for Time Series.
Where also is possibile to apply XGBoost (i.e what are typical applications of XGBoost)?
Is time serie a kind of regression?
Thanks,
Marco
Yes, time series can be framed as a regression supervised learning problem.
XGBoost can be used for regression and classification and many prediction tasks can be reduced this problems.
Hi.Thank you very much due to your excellent tutorial.I wish the best for you
Thank you!
Good morning Sir!
Hopefully you will be fine with good health. Sir i face a problem in machine learning classifier training and testing and this problem is due to dataset. i use UNSW-NB15 dataset which is attack dataset. there is two feature one is attack category and the other is Label feature. Now i am confuse that how to use this two feature in machine learning classifier as a Label class. Kindly quide me thanks in advance.
Perhaps start with this tutorial to get familiar with the API and preparing data:
https://machinelearningmastery.com/machine-learning-in-python-step-by-step/
Hi Jason,
Is it possible to apply SMOTE on Multitargets problem?
Perhaps. I don’t know offhand. Try it and see.
Hi Jason, interesting article. I didn’t find any mentioning about text data. I assume this would work as with any form of vectorised data, right?
Do you have made any experiences with that so far or would you suggest another lib or approach for imbalanced textual data?
Thanks.
You can get started with text data here:
https://machinelearningmastery.com/start-here/#nlp
Hi Jason,
Very good article!
Out of your experience, what is better, oversampling or cost-sensitive learning?
Certainly oversampling gives you control over the sampling method. But beside that?
Moreover,
It depends on the dataset, you must discover what works well for your dataset with controlled experiments.
Great article as always!
Can you please advise if it is necessary to take care of imbalance if I am modeling intents of text (say 50 intent labels from 16000 texts) where intents have imbalanced frequencies? What happens if I dont treat imbalance?
It really depends on the specifics of your project and project goals.
Perhaps try some of the techniques and see if it makes a difference to your model performance for your chosen metric.
Great article as usual!
Can we apply the same to ADAYSN
<>
Perhaps try it and see?
It was really helpful!
Thanks!
Hello Jason ,
I hope your are fine ?
Thanks you for this article , it is very helpful and clearly simple.
Actually , i work in ML porject, particularly in NLP project with mutiple class imbalanced but also a small dataset. I have 465 class for only 1050 examples and 3 columns which are a list of few word (not structured sentence or paragraph ). This is very small as is said. Do you know how i can resolve this problem please? . How i can apply smote method for text data ? Do you know an api or library to add external corpus to my corpus ?
Do you please have some articles or ideas you suggeste me.
Thanks you a lot in advance
No, SMOTE is not appropriate for text.
Perhaps you can explore using a generative model to create more text data, e.g. language models.
Thanks you very lot Jason. I try to regroup all small categories and take high categories frequencie, this give me good accuracy ffor the moment.
Nice!
smote applied at train set only, but in this article applied on x and y , is this true?
It’s just a demo of how to use the class and the effect it has.
When evaluating a model use a pipeline, see this example:
https://machinelearningmastery.com/smote-oversampling-for-imbalanced-classification/
Hi,Jason, I want to know how to caculate the cost matrix or class_weight in my project?
And what do you think can I need use the cost_sensitive learning with feature selection before XGboost? I was going to use dataset balanced and feature selection before XGboost.
Look forward to your answer. Thanks you a lot in advance
XGBoost only supports two classes when used in cost-sensitive learning, see this tutorial for examples:
https://machinelearningmastery.com/xgboost-for-imbalanced-classification/
is it possible to use any single option like smote to use for both binary and multi-class problems in a single code base?
like we will give the dataset and algorithm will realize is it binary or multi class problem and then predict according to them.
Not sure I understand, sorry. Each dataset is a different “project”.
Hi, Jason, would confusion matrix help to see the comparison of balanced data with SMOTE and imbalanced data? If yes how should I apply the confusion matrix before SMOTE oversampling?
Note that confusion matrix tells how your model output related to the truth in the training data. Therefore, you cannot. You need to apply the data to train one model with SMOTE and one without, and then you get two confusion matrices to compare.
Thank you for the reply! how can I get the two confusion matrices to compare? Would there be any tutorials from your post using confusion matrices? : “You need to apply the data to train one model with SMOTE and one without” I would love to try this out on my own and compare two confusion matrices.
I think this post has the sample code you want: https://machinelearningmastery.com/confusion-matrix-machine-learning/
Hi Adrian, Sorry for keep asking questions. Do I need to split the data first to use a confusion matrix for this dataset?
As I’m a beginner with coding I’m not sure how I could split this:
“# split into input and output elements
X, y = data[:, :-1], data[:, -1]”
this part to “confusion_matrix(y_true=y_test, y_pred=y_pred_single)”
If your “y” is entire data, you will need to split it into training and test sets, look for “train_test_split” function in scikit-learn, for example.
Hi Adrian! thanks for the reply again! Would the dataset that Jason used for this article which is the (glass dataset )be able to split as well to train_test_split?
Regards
Yes, that train_test_split function is quite flexible and powerful.
Hi @Jason Brownlee – I have a dataset something like below.
FeatureA Target
a,b,c,d xyz
Multiple categorical values in FeatureA with comma separated and I need to predict the Target categorical value.
I have few questions:
1. How to plot the graphs on this data?
2. What is best way to resolve imbalance issues.
3. How to plot accuracy graphs like CM, F1, Precision and Recall.
Thanks in Advance.
(1) If you use categorial value to plot categorical value, I think you can simply do the count of a=value1 to xyz=value1, then you get a matrix of count.
(2) did you tried SMOTE?
(3) If target is binary, I believe the most common graph is ROC
Thank you so much Adrian for your quick response.
1. a,b,c,d are in a single feature, not in a different feature. In that case, do I need to separate it as different features?
2. Yes, I have tried SMOTENC which is for categorical and numerical, but I do not have numerical features in this dataset. Any other suggestions for oversampling the data?
3. My target is categorical again, not binary.
Appreciate your advice.
(1) Same. You have 4 different possible values in the feature, and N different class in the target, then you have a table of 4xN
(2) If you have no numerical values in input, SMOTE is not suitable. Maybe you can just do a bootstrap resampling: https://machinelearningmastery.com/a-gentle-introduction-to-the-bootstrap-method/
(3) You can consider mean-F1 as the score function
@Adrian,
Thank you for your suggestion.
I have used SMOTEN and resampled the imbalanced classes and now train, test, and cross-validation accuracies are high(around 99%), but when I tested with the unseen data most of the times model is unable to predict. Could you pls help me what is the issue with my model training?
Regrads,
Ashok.
Unable to predict means predicted the opposite class? I would go back to check your model and how you handled the data in the training. The always high 99% accuracy maybe not a realistic result in most cases.
Is there a reason for not using any classifier before balancing the data with SMOTE oversampling?
Can you elaborate on how do you think the classifier can be used?
Hi Jason,
It’s a great article
Is it possible to apply SMOTE to computer vision systems?
because when I tried to use SMOTE with images and pass my images dataset to fit_resample(X, y) function it’s not working, an error appeared to me which is ” the fit_resample function Found array with dim 3. Estimator expected <= 2)
if the fit_resample(X, y) accepts a 3-dimensional array, please tell me how to do it?
SMOTE is about a vector space model, which a data point is represented by a coordinate (x1,x2,…,xn). If your computer vision system can recognize input in this format, I believe SMOTE can work too. But generally converting a 2D pixels (i.e., images) into 1D vector does not work well.
well, that’s clear now.
thank you so much, sir.
Hello sir! How do I apply SMOTE to my dataset with 4 classes (none(2552),ischemia(227),both(621),infection(2555))?
Hi Goe…Please specify what you are attempting to accomplish as it relates to the code examples provided so that I may better assist you.
Actually i want to apply SMOTE to my image dataset which contains 5955 images with 4 classes (2552, 227, 621, 2555). Could anyone please help me. It would be greatly appreciated!
I appreciate your help in advance
Hi Goe…Have you tried an a model implementation? If so, please any error messages or results that were not expected so that we may better assist you.
Why not use Randon Stratified Sampling instead?
Hi Sruthi…That is certainly an option. Feel free to implement it and let us know your findings.
Hi,
very nice work. Thank you, as usual, for covering so many useful topics in your articles
I would ask you the following questions: in my dataset the 3-class multiclass target has the class proportions = [ 1, 16, 83] If I try the Cost-Sensitive Learning strategy with class weights end the metrics are good, should I also try SMOTE due to the very low proportion ( 1% ) of the most minority class?
Thank you
Hi Michele…Thank you for the great feedback and support! I would recommend trying SMOTE:
https://machinelearningmastery.com/smote-oversampling-for-imbalanced-classification/
Hi! Thank you so much for the explanation, it helps a lot.
I’d ask some following questions:
I am trying to apply cost-sensitive learning to the Random Forest classifier for my multi-class imbalanced dataset. Is the weight on the code is the same with the cost matrix? I can see that you give 1.0 to majority classes and 2.0 to others. Is there any base or references to decide what value of weight should I assign to each class?
Hope this question finds you well. Thank you so much.
Hi Jess…The following resource may be of interest to you:
https://www.analyticsvidhya.com/blog/2020/10/improve-class-imbalance-class-weights/
hi jason your training and testing data’s are same so accuracy could be good . can u please split the data as train and test after prediction show some classification report so that we can find how the models are predicting the other classes
Hi Sagar N.R….Thank you for the recommendation!