Small computers, such as Arduino devices, can be used within buildings to record environmental variables from which simple and useful properties can be predicted.
One example is predicting whether a room or rooms are occupied based on environmental measures such as temperature, humidity, and related measures.
This is a type of common time series classification problem called room occupancy classification.
In this tutorial, you will discover a standard multivariate time series classification problem for predicting room occupancy using the measurements of environmental variables.
After completing this tutorial, you will know:
The Occupancy Detection standard time series classification problem in machine learning.
How to load and visualize multivariate time series classification data.
How to develop simple naive and logistic regression models that achieve nearly perfect skill on the problem.
Kick-start your project with my new book Deep Learning for Time Series Forecasting, including step-by-step tutorials and the Python source code files for all examples.
Let’s get started.
Update Oct/2018: Updated description of the source of the dataset (I really messed that up), thanks Luis Candanedo.
Tutorial Overview
This tutorial is divided into four parts; they are:
Occupancy Detection Problem Description
Data Visualization
Concatenated Dataset
Simple Predictive Models
Occupancy Detection Problem Description
A standard time series classification data set is the “Occupancy Detection” problem available on the UCI Machine Learning repository.
It is a binary classification problem which requires that an observation of environmental factors such as temperature and humidity be used to classify whether a room is occupied or unoccupied.
The dataset was collected by monitoring an office with a suite of environmental sensors and using a camera to determine if the room was occupied.
An office room […] was monitored for the following variables: temperature, humidity, light and CO2 levels. A microcontroller was employed to acquire the data. A ZigBee radio was connected to it and was used to transmit the information to a recording station. A digital camera was used to determine if the room was occupied or not. The camera time stamped pictures every minute and these were studied manually to label the data.
Take my free 7-day email crash course now (with sample code).
Click to sign-up and also get a free PDF Ebook version of the course.
Data Visualization
The data is available in CSV format in three files, claimed to be a split of data for training, validation and testing.
The three files are as follows:
datatest.txt (test): From 2015-02-02 14:19:00 to 2015-02-04 10:43:00
datatraining.txt (train): From 2015-02-04 17:51:00 to 2015-02-10 09:33:00
datatest2.txt (val): From 2015-02-11 14:48:00 to 2015-02-18 09:19:00
What is obvious at first is that the split in the data is not contiguous in time and that there are gaps.
The test dataset is before the train and validation datasets in time. Perhaps this was an error in the naming convention of the files. We can also see that the data extends from Feb 2 to Feb 18, which spans 17 calendar days, not 20.
Download the files from here and place them in your current working directory:
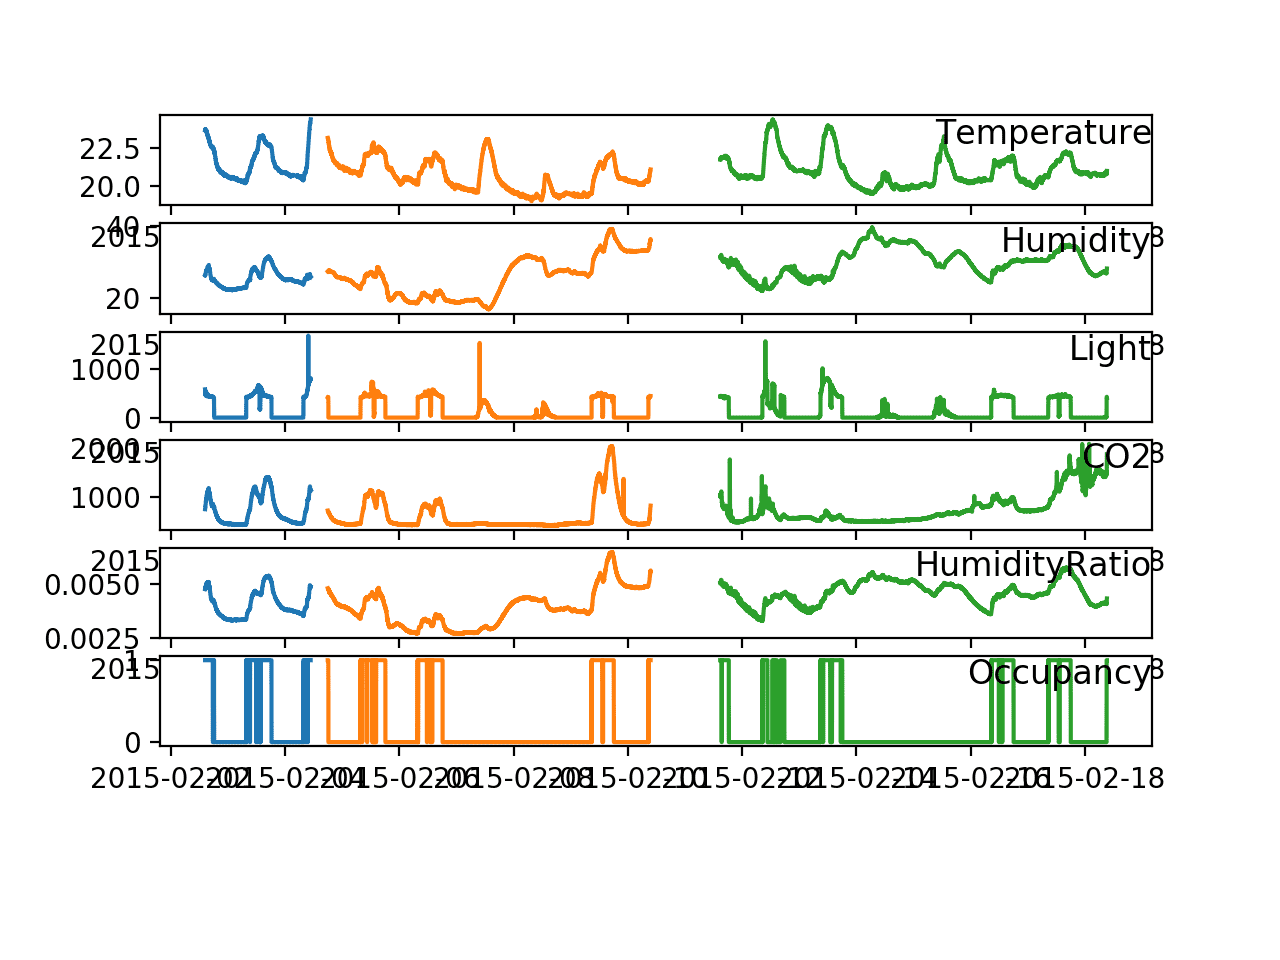
Running the example creates a plot with a different color for each dataset:
datatest.txt (test): Blue
datatraining.txt (train): Orange
datatest2.txt (val): Green
We can see the small gap between the test and train sets and the larger gap between the train and validation sets.
We can also see corresponding structures (peaks) in the series for each variable with the room occupancy.
Line Plot Showing Time Series Plots for all variables and each dataset
Concatenated Dataset
We can simplify the dataset by preserving the temporal consistency of the data and concatenating all three sets into a single dataset, dropping the “no” column.
This will allow ad hoc testing of simple direct framings of the problem (in the next section) that can be tested on a temporally consistent way with ad hoc train/test set sizes.
Note: This simplification does not account for the temporal gaps in the data and algorithms that rely on a sequence of observations at prior time steps may require a different organization of the data.
The example below loads the data, concatenates it into a temporally consistent dataset, and saves the results to a new file named “combined.csv“.
Running the example saves the concatenated dataset to the new file ‘combined.csv‘.
Simple Predictive Models
The simplest formulation of the problem is to predict occupancy based on the environmental conditions at the current time.
I refer to this as a direct model as it does not make use of the observations of the environmental measures at prior time steps. Technically, this is not sequence classification, it is just a straight classification problem where the observations are temporally ordered.
This seems to be the standard formulation of the problem from my skim of the literature, and disappointingly, the papers seem to use the train/validation/test data as labeled on the UCI website.
We will use the combined dataset described in the previous section and evaluate model skill by holding back the last 30% of the data as a test set. For example:
Next, we can evaluate some models of the dataset, starting with a naive prediction model.
Naive Model
A simple model for this formulation of the problem is to predict the most prominent class outcome.
This is called the Zero Rule, or the naive prediction algorithm. We will evaluate predicting all 0 (unoccupied) and all 1 (occupied) for each example in the test set and evaluate the approach using the accuracy metric.
Below is a function that will perform this naive prediction given a test set and a chosen outcome variable
1
2
def naive_prediction(testX,value):
return[value forxinrange(len(testX))]
The complete example is listed below.
1
2
3
4
5
6
7
8
9
10
11
12
13
14
15
16
17
18
19
20
21
22
23
24
25
# naive prediction model
from pandas import read_csv
from sklearn.metrics import accuracy_score
from sklearn.model_selection import train_test_split
Running the example prints the naive prediction and the related score.
Note: Your results may vary given the stochastic nature of the algorithm or evaluation procedure, or differences in numerical precision. Consider running the example a few times and compare the average outcome.
We can see that the baseline score is about 82% accuracy by predicting all 0, e.g. all no occupancy.
For any model to be considered skilful on the problem, it must achieve a skill of 82% or better.
1
2
Naive=0 score=0.822
Naive=1 score=0.178
Logistic Regression
A skim of the literature shows a range of sophisticated neural network models applied on this problem.
To start with, let’s try a simple logistic regression classification algorithm.
The complete example is listed below.
1
2
3
4
5
6
7
8
9
10
11
12
13
14
15
16
17
18
19
20
21
22
# logistic regression
from pandas import read_csv
from sklearn.metrics import accuracy_score
from sklearn.model_selection import train_test_split
from sklearn.metrics import accuracy_score
from sklearn.linear_model import LogisticRegression
Running the example fits a logistic regression model on the training dataset and predicts the test dataset.
Note: Your results may vary given the stochastic nature of the algorithm or evaluation procedure, or differences in numerical precision. Consider running the example a few times and compare the average outcome.
The skill of the model is about 99% accurate, showing skill over the naive method.
Normally, I would recommend centering and normalizing the data prior to modeling, but some trial and error demonstrated that a model on the unscaled data was more skilful.
1
0.992704280155642
This is an impressive result at first glance.
Although the test-setup is different to that presented in the research literature, the reported skill of a very simple model outperforms more sophisticated neural network models.
Feature Selection and Logistic Regression
A closer look at the time series plot shows a clear relationship between the times when the rooms are occupied and peaks in the environmental measures.
This makes sense and explains why this problem is in fact so easy to model.
We can further simplify the model by testing a simple logistic regression model on each environment measure in isolation. The idea is that we don’t need all of the data to predict occupancy; that perhaps just one of the measures is sufficient.
This is the simplest type of feature selection where a model is created and evaluated with each feature in isolation. More advanced methods may consider each subgroup of features.
The complete example testing a logistic model with each of the five input features in isolation is listed below.
1
2
3
4
5
6
7
8
9
10
11
12
13
14
15
16
17
18
19
20
21
22
23
24
25
# logistic regression feature selection
from pandas import read_csv
from sklearn.metrics import accuracy_score
from sklearn.model_selection import train_test_split
from sklearn.metrics import accuracy_score
from sklearn.linear_model import LogisticRegression
Running the example prints the feature index, name, and the skill of a logistic model trained on that feature and evaluated on the test set.
Note: Your results may vary given the stochastic nature of the algorithm or evaluation procedure, or differences in numerical precision. Consider running the example a few times and compare the average outcome.
We can see that only the “Light” variable is required in order to achieve 99% accuracy on this dataset.
It is very likely that the lab rooms in which the environmental variables were recorded had a light sensor that turned internal lights on when the room was occupied.
Alternately, perhaps the light is recorded during the daylight hours (e.g. sunshine through windows), and the rooms are occupied on each day, or perhaps each week day.
At the very least, the results of this tutorial ask some hard questions about any research papers that use this dataset, as clearly it is not a challenging prediction problem.
1
2
3
4
5
feature=0, name=Temperature, score=0.799
feature=1, name=Humidity, score=0.822
feature=2, name=Light, score=0.991
feature=3, name=CO2, score=0.763
feature=4, name=HumidityRatio, score=0.822
Extensions
This data may still be interesting for further investigation.
Some ideas include:
Perhaps the problem would be more challenging if the light column was removed.
Perhaps the problem can be framed as a true multivariate time series classification where lag observations are used in the model.
Perhaps the clear peaks in the environmental variables can be exploited in the prediction.
I tried each of these models briefly without exciting results.
If you explore any of these extensions or find some examples online, let me know in the comments below.
Further Reading
This section provides more resources on the topic if you are looking to go deeper.
In this tutorial, you discovered a standard multivariate time series classification problem for predicting room occupancy using the measurements of environmental variables.
Specifically, you learned:
The Occupancy Detection standard time series classification problem in machine learning.
How to load and visualize multivariate time series classification data.
How to develop simple naive and logistic regression models that achieve nearly perfect skill on the problem.
Do you have any questions?
Ask your questions in the comments below and I will do my best to answer.
Develop Deep Learning models for Time Series Today!
Hi Jason, Isn’t predicting occupancy based on AQI technically incorrect? Because AQI is a dependent variable and Occupancy independent. Shouldn’t we be predicting AQI based on occupancy?


")


Hi! Awesome blog!. Thanks! One thing, why don’t you use plt.tight_layout() at the end of the script in order to have non-overlapping graphs?
Great suggestion, thanks!
i have this code:
to calculate logistic regression and show its result but when i run it in pycharm i see this error:
what should i do?
Sorry, I don’t have the capacity to debug your code, I have some suggestions here:
https://machinelearningmastery.com/faq/single-faq/can-you-read-review-or-debug-my-code
I believe you have defined value = requests.get(url) and calling values[:,:-1] with an extra ‘s’ @Star
Can you help me find 5 hypothesis for the data set?
Sorry, I don’t understand your question. Perhaps you can elaborate.
Hi Jason, Isn’t predicting occupancy based on AQI technically incorrect? Because AQI is a dependent variable and Occupancy independent. Shouldn’t we be predicting AQI based on occupancy?
Hi Navneet…You could determine whether there is any correlation:
https://machinelearningmastery.com/how-to-use-correlation-to-understand-the-relationship-between-variables/