Test datasets are small contrived datasets that let you test a machine learning algorithm or test harness.
The data from test datasets have well-defined properties, such as linearly or non-linearity, that allow you to explore specific algorithm behavior. The scikit-learn Python library provides a suite of functions for generating samples from configurable test problems for regression and classification.
In this tutorial, you will discover test problems and how to use them in Python with scikit-learn.
After completing this tutorial, you will know:
How to generate multi-class classification prediction test problems.
How to generate binary classification prediction test problems.
How to generate linear regression prediction test problems.
Kick-start your project with my new book Machine Learning Mastery With Python, including step-by-step tutorials and the Python source code files for all examples.
Let’s get started.
Updated Jan/2020: Updated for changes in scikit-learn v0.22 API.
Tutorial Overview
This tutorial is divided into 3 parts; they are:
Test Datasets
Classification Test Problems
Regression Test Problems
Test Datasets
A problem when developing and implementing machine learning algorithms is how do you know whether you have implemented them correctly. They seem to work even with bugs.
Test datasets are small contrived problems that allow you to test and debug your algorithms and test harness. They are also useful for better understanding the behavior of algorithms in response to changes in hyperparameters.
Below are some desirable properties of test datasets:
They can be generated quickly and easily.
They contain “known” or “understood” outcomes for comparison with predictions.
They are stochastic, allowing random variations on the same problem each time they are generated.
They are small and easily visualized in two dimensions.
They can be scaled up trivially.
I recommend using test datasets when getting started with a new machine learning algorithm or when developing a new test harness.
scikit-learn is a Python library for machine learning that provides functions for generating a suite of test problems.
In this tutorial, we will look at some examples of generating test problems for classification and regression algorithms.
Classification Test Problems
Classification is the problem of assigning labels to observations.
In this section, we will look at three classification problems: blobs, moons and circles.
Blobs Classification Problem
The make_blobs() function can be used to generate blobs of points with a Gaussian distribution.
You can control how many blobs to generate and the number of samples to generate, as well as a host of other properties.
The problem is suitable for linear classification problems given the linearly separable nature of the blobs.
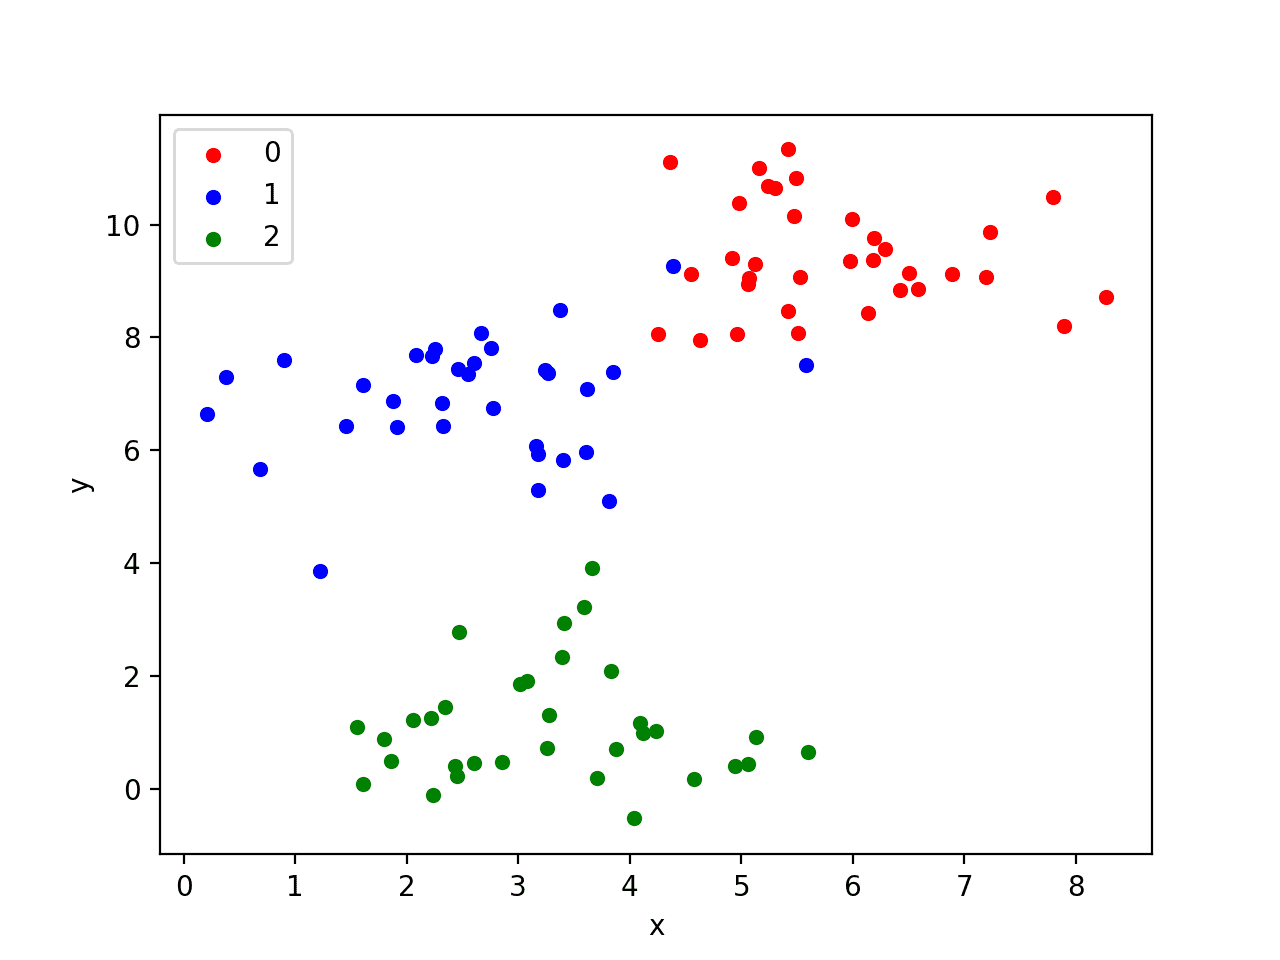
The example below generates a 2D dataset of samples with three blobs as a multi-class classification prediction problem. Each observation has two inputs and 0, 1, or 2 class values.
Running the example generates the inputs and outputs for the problem and then creates a handy 2D plot showing points for the different classes using different colors.
Note, your specific dataset and resulting plot will vary given the stochastic nature of the problem generator. This is a feature, not a bug.
Scatter Plot of Blobs Test Classification Problem
We will use this same example structure for the following examples.
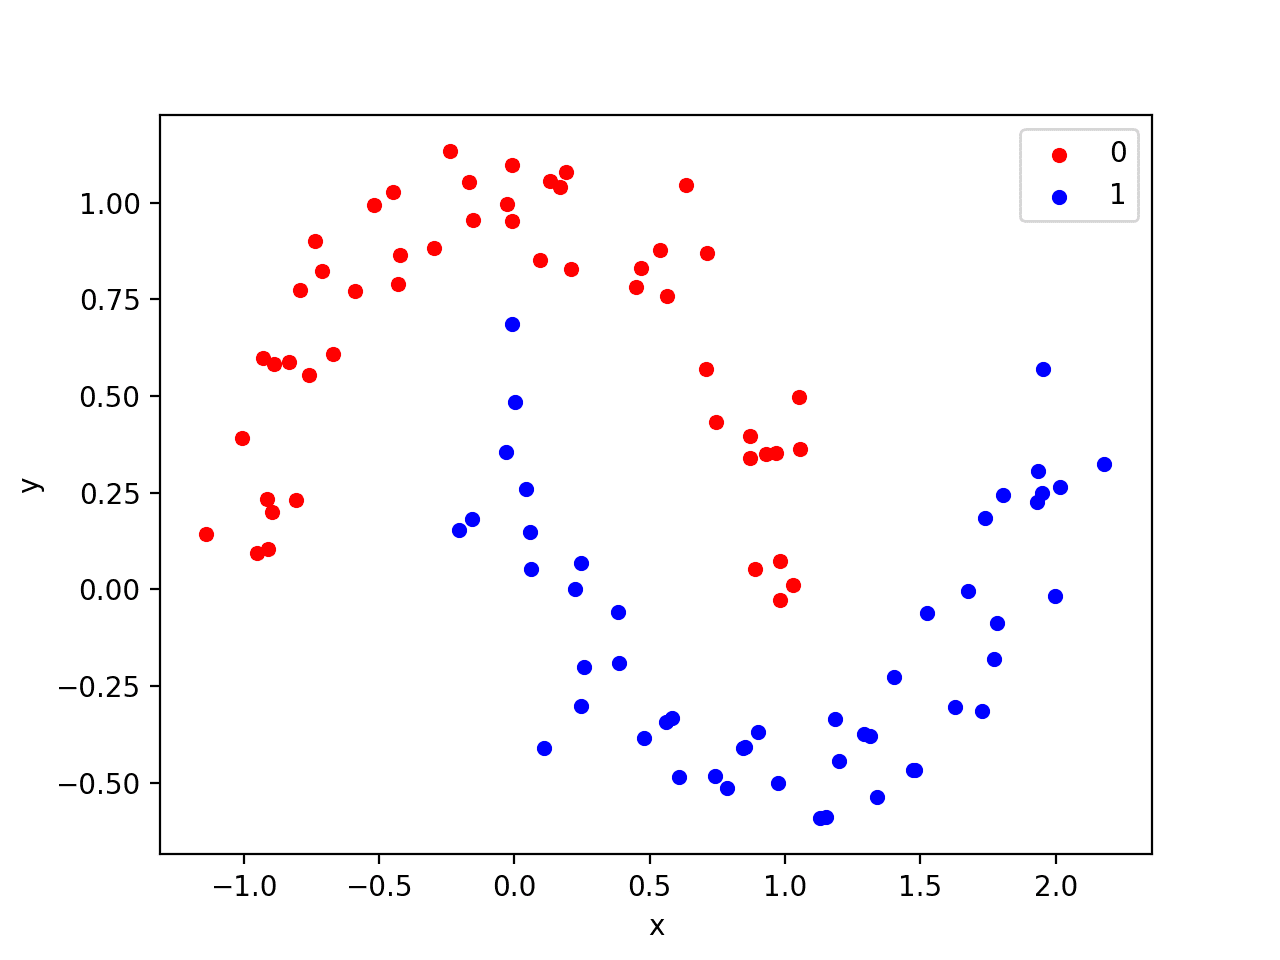
Moons Classification Problem
The make_moons() function is for binary classification and will generate a swirl pattern, or two moons.
You can control how noisy the moon shapes are and the number of samples to generate.
This test problem is suitable for algorithms that are capable of learning nonlinear class boundaries.
The example below generates a moon dataset with moderate noise.
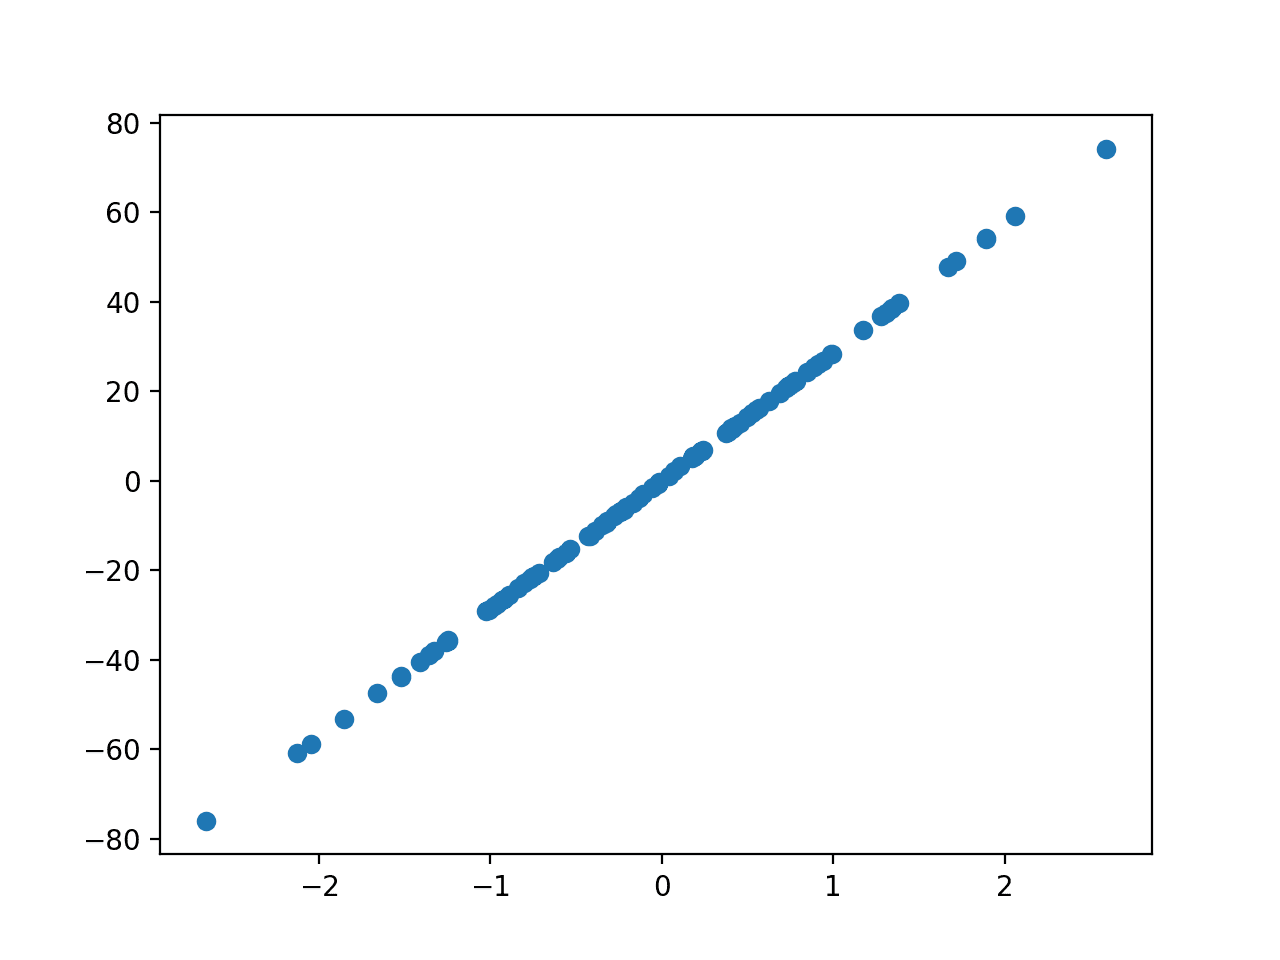
Running the example will generate the data and plot the X and y relationship, which, given that it is linear, is quite boring.
Scatter Plot of Regression Test Problem
Extensions
This section lists some ideas for extending the tutorial that you may wish to explore.
Compare Algorithms. Select a test problem and compare a suite of algorithms on the problem and report the performance.
Scale Up Problem. Select a test problem and explore scaling it up, use progression methods to visualize the results, and perhaps explore model skill vs problem scale for a given algorithm.
Additional Problems. The library provides a suite of additional test problems; write a code example for each to demonstrate how they work.
If you explore any of these extensions, I’d love to know.
Further Reading
This section provides more resources on the topic if you are looking to go deeper.
Can the number of features for these datasets be greater than the examples given? For example, can the make_blobs function make datasets with 3+ features?
Hi,
I have built my model for gender prediction based on Text dataset using Multinomial Naive Bayes algorithm. However, I am trying to use my built model to make predictions on new real test dataset for Gender-based on Text. How do I achieve that? Can you please explain me the concept? Thanks.
hi Jason , am working on credit card fraud detection where datasets are missing , can use that method to generate a datasets to validate my work , if no should abandon that work
best regard
Hi Jason. Thanks for the great article. I already have a dataset that I want to increase its size. Maybe by copying some of the records but I’m looking for a more accurate way of doing it. Also do you know of a python library that can generate new data points out of a current dataset?
How would I plot something with more n_features? For example, in the blob generator, if I set n_features to 7, I get 7 columns of features. However, when I plot it, it only takes the first two columns as data for the plot. More importantly, the way it assigns a y-value seems to only be based on the first two feature columns as well – are the remaining features taken into account at all when it groups the data into specific clusters? I hope my question makes sense. Thank you.
Thank you Jason, I confused the meaning of ‘centers’ with what normally would be equivalent to the y_train/y_test element (as the n_features element is basically the features in neural networks (X_train/X_test), so I falsely parallelized ‘centers’ with y_train/y_test in multivariate networks). Solves the graphing confusion as well.
i have to create a data.pkl and label.pkl files of some images with the dataset of some images .
how can i create a data and label.pkl form the data set of images ?
Thank you, Jason, for this nice tutorial!
It helped me in finding a module in the sklearn by the name ‘datasets.make_regression’.
I am currently trying to understand how pca works and require to make some mock data of higher dimension than the feature itself.
In ‘datasets.make_regression’ the argument ‘n_feature’ is simple to understand, but ‘n_informative’ is confusing to me.
I desire my (initial) data to comprise of more feature columns than the actual ones and I try the following:
for, n_informative > n_feature, I get X.shape as (n,n_feature), where n is the total number of sample points.
Then, later on, I might want to carry out pca to reduce the dimension, which I seem to handle (say).
The question I want to ask is how do I obtain X.shape as (n, n_informative)?
hello there,
I have been asked to do a clustering using k Mean Algorithm for gene expression data and asked to provide the clustering result. Please provide me with the answer.
Hi Jason, is there a way to generate this test data with only integer value instead of float. I am trying but can’t figure it out. Any help would be much appreciated it. thanks


Can the number of features for these datasets be greater than the examples given? For example, can the make_blobs function make datasets with 3+ features?
Try it.
Is there an analogous function in R?
There must be, I don’t know off hand sorry.
Hi,
I have built my model for gender prediction based on Text dataset using Multinomial Naive Bayes algorithm. However, I am trying to use my built model to make predictions on new real test dataset for Gender-based on Text. How do I achieve that? Can you please explain me the concept? Thanks.
This is a common question that I answer here:
https://machinelearningmastery.com/faq/single-faq/how-do-i-make-predictions
hi Jason , am working on credit card fraud detection where datasets are missing , can use that method to generate a datasets to validate my work , if no should abandon that work
best regard
If you do not have data, you cannot develop and test a model.
Alternately, if you have missing observations in a dataset, you have options:
https://machinelearningmastery.com/faq/single-faq/how-do-i-handle-missing-data
Why does make_blobs assign a classification y to the data points? Isn’t that the job of a classification algorithm?
Yes, but we need data to train the model.
Hey,
Have any idea on how to create a time series dataset using Brownian motion including trend and seasonality?
Sorry, I don’t have an example of Brownian motion.
How can I generate an imbalanced dataset? For example among 100 points I want 10 in one class and 90 in other class.
I’m sure the API can do it, but if not, generate with 100 examples in each class, then delete 90 examples from one class and 10 from the other.
can i generate a particular image detection by using this?
I don’t think so.
Hi Jason. Thanks for the great article. I already have a dataset that I want to increase its size. Maybe by copying some of the records but I’m looking for a more accurate way of doing it. Also do you know of a python library that can generate new data points out of a current dataset?
Many thanks,
Pamela
The simplest way is to copy records and add Gaussian noise with zero mean and a small stdev that makes sense for each dimension of your data.
Beyond that, you may want to look into resampling methods used by techniques such as SMOTE, etc.
Sorry, I don’t know of libraries that do this.
How would I plot something with more n_features? For example, in the blob generator, if I set n_features to 7, I get 7 columns of features. However, when I plot it, it only takes the first two columns as data for the plot. More importantly, the way it assigns a y-value seems to only be based on the first two feature columns as well – are the remaining features taken into account at all when it groups the data into specific clusters? I hope my question makes sense. Thank you.
You can choose the number of features and the number of features that contribute to the outcome.
Obviously, a 2D plot can only show two features at a time, you could create a matrix of each variable plotted against every other variable.
Thank you Jason, I confused the meaning of ‘centers’ with what normally would be equivalent to the y_train/y_test element (as the n_features element is basically the features in neural networks (X_train/X_test), so I falsely parallelized ‘centers’ with y_train/y_test in multivariate networks). Solves the graphing confusion as well.
Here, “center” referrs to an artificial cluster center for a samples that belong to a class.
i have to create a data.pkl and label.pkl files of some images with the dataset of some images .
how can i create a data and label.pkl form the data set of images ?
Perhaps load the data as numpy arrays and save the numpy arrays using the numpy save() function instead of using pickle?
Thank you, Jason, for this nice tutorial!
It helped me in finding a module in the sklearn by the name ‘datasets.make_regression’.
I am currently trying to understand how pca works and require to make some mock data of higher dimension than the feature itself.
In ‘datasets.make_regression’ the argument ‘n_feature’ is simple to understand, but ‘n_informative’ is confusing to me.
I desire my (initial) data to comprise of more feature columns than the actual ones and I try the following:
for, n_informative > n_feature, I get X.shape as (n,n_feature), where n is the total number of sample points.
Then, later on, I might want to carry out pca to reduce the dimension, which I seem to handle (say).
The question I want to ask is how do I obtain X.shape as (n, n_informative)?
The ‘n_informative’ argument controls how many of the input arguments are real or contribute to the outcome.
It sounds like you might want to set n_informative to the number of dimensions of your dataset.
Why n_features are used?
It specifies the number of variables we want in our problem, e.g. input variables.
hello there,
I have been asked to do a clustering using k Mean Algorithm for gene expression data and asked to provide the clustering result. Please provide me with the answer.
Sorry, I don’t have any tutorials on clustering at this stage.
Hi Jason, is there a way to generate this test data with only integer value instead of float. I am trying but can’t figure it out. Any help would be much appreciated it. thanks
You may need to implement a new procedure to generate a dataset with integer values.