Feature selection is the process of identifying and selecting a subset of input features that are most relevant to the target variable.
Feature selection is often straightforward when working with real-valued data, such as using the Pearson’s correlation coefficient, but can be challenging when working with categorical data.
The two most commonly used feature selection methods for categorical input data when the target variable is also categorical (e.g. classification predictive modeling) are the chi-squared statistic and the mutual information statistic.
In this tutorial, you will discover how to perform feature selection with categorical input data.
After completing this tutorial, you will know:
The breast cancer predictive modeling problem with categorical inputs and binary classification target variable.
How to evaluate the importance of categorical features using the chi-squared and mutual information statistics.
How to perform feature selection for categorical data when fitting and evaluating a classification model.
Kick-start your project with my new book Data Preparation for Machine Learning, including step-by-step tutorials and the Python source code files for all examples.
Let’s get started.
How to Perform Feature Selection with Categorical Data Photo by Phil Dolby, some rights reserved.
Tutorial Overview
This tutorial is divided into three parts; they are:
Breast Cancer Categorical Dataset
Categorical Feature Selection
Chi-Squared Feature Selection
Mutual Information Feature Selection
Modeling With Selected Features
Model Built Using All Features
Model Built Using Chi-Squared Features
Model Built Using Mutual Information Features
Breast Cancer Categorical Dataset
As the basis of this tutorial, we will use the so-called “Breast cancer” dataset that has been widely studied as a machine learning dataset since the 1980s.
The dataset classifies breast cancer patient data as either a recurrence or no recurrence of cancer. There are 286 examples and nine input variables. It is a binary classification problem.
A naive model can achieve an accuracy of 70% on this dataset. A good score is about 76% +/- 3%. We will aim for this region, but note that the models in this tutorial are not optimized; they are designed to demonstrate encoding schemes.
You can download the dataset and save the file as “breast-cancer.csv” in your current working directory.
Running the example reports the size of the input and output elements of the train and test sets.
We can see that we have 191 examples for training and 95 for testing.
1
2
Train (191, 9) (191, 1)
Test (95, 9) (95, 1)
Now that we are familiar with the dataset, let’s look at how we can encode it for modeling.
We can use the OrdinalEncoder() from scikit-learn to encode each variable to integers. This is a flexible class and does allow the order of the categories to be specified as arguments if any such order is known.
Note: I will leave it as an exercise to you to update the example below to try specifying the order for those variables that have a natural ordering and see if it has an impact on model performance.
The best practice when encoding variables is to fit the encoding on the training dataset, then apply it to the train and test datasets.
The function below named prepare_inputs() takes the input data for the train and test sets and encodes it using an ordinal encoding.
1
2
3
4
5
6
7
# prepare input data
def prepare_inputs(X_train,X_test):
oe=OrdinalEncoder()
oe.fit(X_train)
X_train_enc=oe.transform(X_train)
X_test_enc=oe.transform(X_test)
returnX_train_enc,X_test_enc
We also need to prepare the target variable.
It is a binary classification problem, so we need to map the two class labels to 0 and 1. This is a type of ordinal encoding, and scikit-learn provides the LabelEncoder class specifically designed for this purpose. We could just as easily use the OrdinalEncoder and achieve the same result, although the LabelEncoder is designed for encoding a single variable.
The prepare_targets() function integer encodes the output data for the train and test sets.
Tying this all together, the complete example of loading and encoding the input and output variables for the breast cancer categorical dataset is listed below.
1
2
3
4
5
6
7
8
9
10
11
12
13
14
15
16
17
18
19
20
21
22
23
24
25
26
27
28
29
30
31
32
33
34
35
36
37
38
39
40
41
42
43
# example of loading and preparing the breast cancer dataset
from pandas import read_csv
from sklearn.model_selection import train_test_split
The results of this test can be used for feature selection, where those features that are independent of the target variable can be removed from the dataset.
When there are three or more levels for the predictor, the degree of association between predictor and outcome can be measured with statistics such as X2 (chi-squared) tests …
The scikit-learn machine library provides an implementation of the chi-squared test in the chi2() function. This function can be used in a feature selection strategy, such as selecting the top k most relevant features (largest values) via the SelectKBest class.
For example, we can define the SelectKBest class to use the chi2() function and select all features, then transform the train and test sets.
1
2
3
4
5
...
fs=SelectKBest(score_func=chi2,k='all')
fs.fit(X_train,y_train)
X_train_fs=fs.transform(X_train)
X_test_fs=fs.transform(X_test)
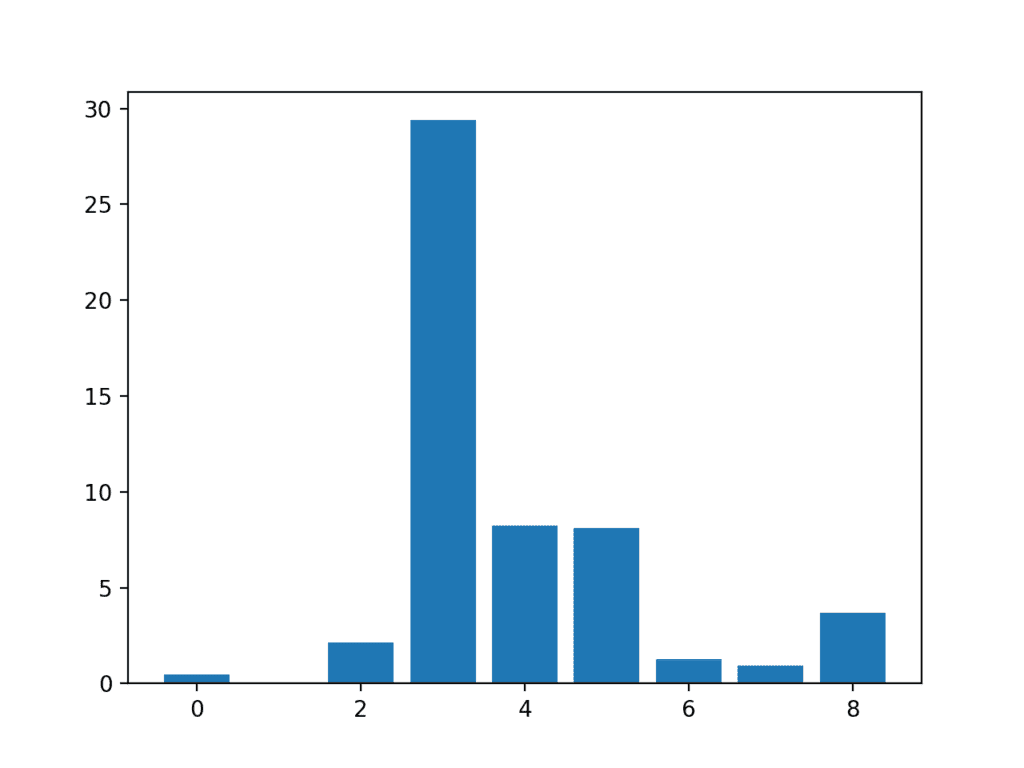
We can then print the scores for each variable (largest is better), and plot the scores for each variable as a bar graph to get an idea of how many features we should select.
Running the example first prints the scores calculated for each input feature and the target variable.
Note: Your results may vary given the stochastic nature of the algorithm or evaluation procedure, or differences in numerical precision. Consider running the example a few times and compare the average outcome.
In this case, we can see the scores are small and it is hard to get an idea from the number alone as to which features are more relevant.
Perhaps features 3, 4, 5, and 8 are most relevant.
1
2
3
4
5
6
7
8
9
Feature 0: 0.472553
Feature 1: 0.029193
Feature 2: 2.137658
Feature 3: 29.381059
Feature 4: 8.222601
Feature 5: 8.100183
Feature 6: 1.273822
Feature 7: 0.950682
Feature 8: 3.699989
A bar chart of the feature importance scores for each input feature is created.
This clearly shows that feature 3 might be the most relevant (according to chi-squared) and that perhaps four of the nine input features are the most relevant.
We could set k=4 When configuring the SelectKBest to select these top four features.
Bar Chart of the Input Features (x) vs The Chi-Squared Feature Importance (y)
Mutual Information Feature Selection
Mutual information from the field of information theory is the application of information gain (typically used in the construction of decision trees) to feature selection.
Mutual information is calculated between two variables and measures the reduction in uncertainty for one variable given a known value of the other variable.
You can learn more about mutual information in the following tutorial.
The scikit-learn machine learning library provides an implementation of mutual information for feature selection via the mutual_info_classif() function.
Like chi2(), it can be used in the SelectKBest feature selection strategy (and other strategies).
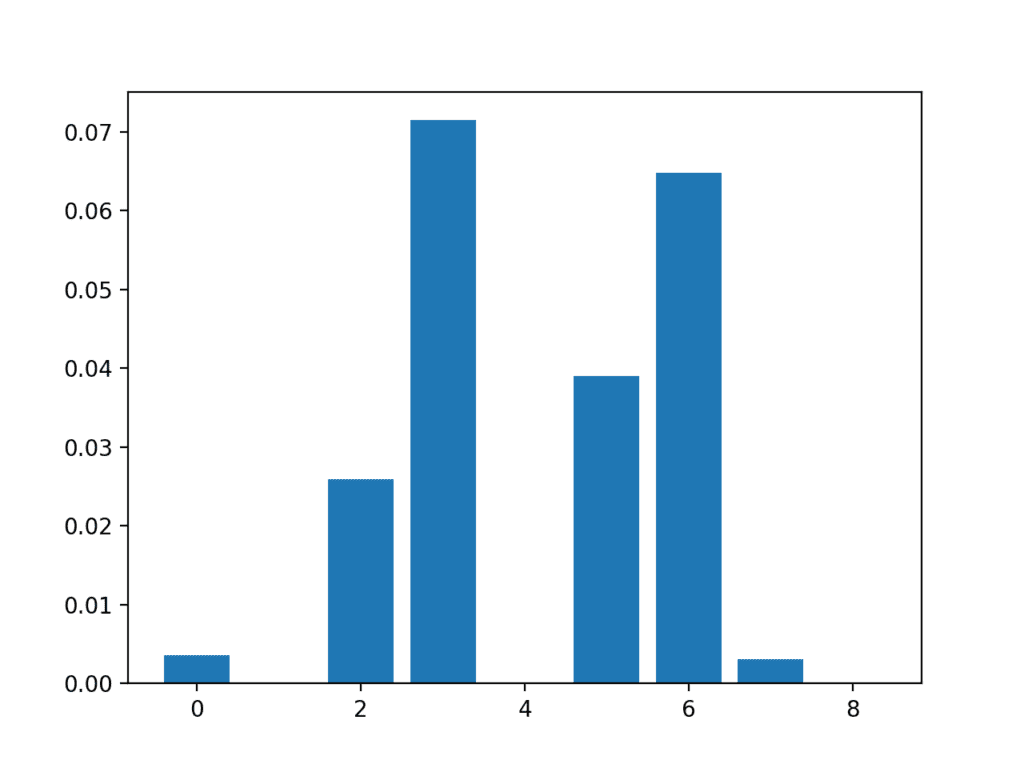
We can perform feature selection using mutual information on the breast cancer set and print and plot the scores (larger is better) as we did in the previous section.
The complete example of using mutual information for categorical feature selection is listed below.
1
2
3
4
5
6
7
8
9
10
11
12
13
14
15
16
17
18
19
20
21
22
23
24
25
26
27
28
29
30
31
32
33
34
35
36
37
38
39
40
41
42
43
44
45
46
47
48
49
50
51
52
53
54
55
56
57
58
59
60
61
62
# example of mutual information feature selection for categorical data
from pandas import read_csv
from sklearn.model_selection import train_test_split
from sklearn.preprocessing import LabelEncoder
from sklearn.preprocessing import OrdinalEncoder
from sklearn.feature_selection import SelectKBest
from sklearn.feature_selection import mutual_info_classif
Running the example first prints the scores calculated for each input feature and the target variable.
Note: Your results may vary given the stochastic nature of the algorithm or evaluation procedure, or differences in numerical precision. Consider running the example a few times and compare the average outcome.
In this case, we can see that some of the features have a very low score, suggesting that perhaps they can be removed.
Perhaps features 3, 6, 2, and 5 are most relevant.
1
2
3
4
5
6
7
8
9
Feature 0: 0.003588
Feature 1: 0.000000
Feature 2: 0.025934
Feature 3: 0.071461
Feature 4: 0.000000
Feature 5: 0.038973
Feature 6: 0.064759
Feature 7: 0.003068
Feature 8: 0.000000
A bar chart of the feature importance scores for each input feature is created.
Importantly, a different mixture of features is promoted.
Bar Chart of the Input Features (x) vs The Mutual Information Feature Importance (y)
Now that we know how to perform feature selection on categorical data for a classification predictive modeling problem, we can try developing a model using the selected features and compare the results.
Modeling With Selected Features
There are many different techniques for scoring features and selecting features based on scores; how do you know which one to use?
A robust approach is to evaluate models using different feature selection methods (and numbers of features) and select the method that results in a model with the best performance.
In this section, we will evaluate a Logistic Regression model with all features compared to a model built from features selected by chi-squared and those features selected via mutual information.
Logistic regression is a good model for testing feature selection methods as it can perform better if irrelevant features are removed from the model.
Model Built Using All Features
As a first step, we will evaluate a LogisticRegression model using all the available features.
The model is fit on the training dataset and evaluated on the test dataset.
The complete example is listed below.
1
2
3
4
5
6
7
8
9
10
11
12
13
14
15
16
17
18
19
20
21
22
23
24
25
26
27
28
29
30
31
32
33
34
35
36
37
38
39
40
41
42
43
44
45
46
47
48
49
50
51
52
53
# evaluation of a model using all input features
from pandas import read_csv
from sklearn.preprocessing import LabelEncoder
from sklearn.preprocessing import OrdinalEncoder
from sklearn.model_selection import train_test_split
from sklearn.linear_model import LogisticRegression
Running the example prints the accuracy of the model on the training dataset.
Note: Your results may vary given the stochastic nature of the algorithm or evaluation procedure, or differences in numerical precision. Consider running the example a few times and compare the average outcome.
In this case, we can see that the model achieves a classification accuracy of about 75%.
We would prefer to use a subset of features that achieves a classification accuracy that is as good or better than this.
1
Accuracy: 75.79
Model Built Using Chi-Squared Features
We can use the chi-squared test to score the features and select the four most relevant features.
The select_features() function below is updated to achieve this.
1
2
3
4
5
6
7
# feature selection
def select_features(X_train,y_train,X_test):
fs=SelectKBest(score_func=chi2,k=4)
fs.fit(X_train,y_train)
X_train_fs=fs.transform(X_train)
X_test_fs=fs.transform(X_test)
returnX_train_fs,X_test_fs
The complete example of evaluating a logistic regression model fit and evaluated on data using this feature selection method is listed below.
1
2
3
4
5
6
7
8
9
10
11
12
13
14
15
16
17
18
19
20
21
22
23
24
25
26
27
28
29
30
31
32
33
34
35
36
37
38
39
40
41
42
43
44
45
46
47
48
49
50
51
52
53
54
55
56
57
58
59
60
61
62
63
64
65
# evaluation of a model fit using chi squared input features
from pandas import read_csv
from sklearn.preprocessing import LabelEncoder
from sklearn.preprocessing import OrdinalEncoder
from sklearn.feature_selection import SelectKBest
from sklearn.feature_selection import chi2
from sklearn.model_selection import train_test_split
from sklearn.linear_model import LogisticRegression
Running the example reports the performance of the model on just four of the nine input features selected using the chi-squared statistic.
Note: Your results may vary given the stochastic nature of the algorithm or evaluation procedure, or differences in numerical precision. Consider running the example a few times and compare the average outcome.
In this case, we see that the model achieved an accuracy of about 74%, a slight drop in performance.
It is possible that some of the features removed are, in fact, adding value directly or in concert with the selected features.
At this stage, we would probably prefer to use all of the input features.
1
Accuracy: 74.74
Model Built Using Mutual Information Features
We can repeat the experiment and select the top four features using a mutual information statistic.
The updated version of the select_features() function to achieve this is listed below.
Running the example fits the model on the four top selected features chosen using mutual information.
Note: Your results may vary given the stochastic nature of the algorithm or evaluation procedure, or differences in numerical precision. Consider running the example a few times and compare the average outcome.
In this case, we can see a small lift in classification accuracy to 76%.
To be sure that the effect is real, it would be a good idea to repeat each experiment multiple times and compare the mean performance. It may also be a good idea to explore using k-fold cross-validation instead of a simple train/test split.
1
Accuracy: 76.84
Further Reading
This section provides more resources on the topic if you are looking to go deeper.
It provides self-study tutorials with full working code on: Feature Selection, RFE, Data Cleaning, Data Transforms, Scaling, Dimensionality Reduction,
and much more...
Bring Modern Data Preparation Techniques to Your Machine Learning Projects
I have performed feature selection on the columns of my data (after cleaning it). The method I used is the Extra Tree Classifier for Feature Selection (from sklearn.ensemble).
I fit the model and get the n most relevant features of my data. However, every time I run it, different features come up as the most important ones. I’m not sure why this is happening, shouldn’t the method always output the same n top features?
Hello Alan,
The problem is in fact even broader than you describe because there exist variable importance methods different than default Gini importance from ExtraTrees or RandomForest in sklearn.
I have in mind for example permutation and dropcol importances. And each of those can provide different variable rankings.
From my experience I apply multiple permutation importance evaluations (e.g. 5 times) and take an average before comparing variables.
Regards!
Jason:
I am a long time fan of your blog posts. I want to bring to your attention a new library that I have developed called Auto_ViML which performs feature selection and model tuning automatically using many great Kaggle techniques. I’d like you to try it on this breast-cancer.csv file and report results if you can.
Here’s the Medium article that describes it:
Thank you for this a nice post with an illustrative code demo.
I have a question on the Chi-Squared Feature Selection:
Are the importance (score) of variable and the Chi-squared score same thing, OR different things in opposite direction?
The reason I am puzzled is by below understanding (misunderstanding?). The null hypothesis of Chi-Squared test is that the two inputs have similar distribution (i.e. related or dependent). Thus, higher Chi-Squared score implies less dependency. For the sake of feature selection, we want to use those variables that are related to target variable for predicting. Or in your text, “those features that are independent of the target variable can be REMOVED from the dataset”.
My understanding is that variables with larger Chi-square score should be removed, since they are independent to the target variable. Thus, I have the impression that the importance of variable be inverse to the raw Chi-square score.
Hello Jason,
one more question is about using sklearn Precision, Recall, F1 metrics and ROC/ AUC to evaluate Keras model.
Is up to you correct to use the above metrics to evaluate Keras models?
Does Keras provide any other function to evaluate models?
Thanks
I have read it somewhere that we should use dummy variable (using one hot encoding ) for those categorical features which have more than 2 categories. But in this logistic regression model you have not done so which makes me confused about when exactly should we use dummy variable and when it is not necessary.
I think his problem is why can use OrdinalEncoder to encode those 5 classes instead of OHE, because their relationship is equal but OE doesn’t show this property.
I’m using the same piece of code and getting this stuck at this error when I am encoding my inputs using ordinalencoder : “Input contains NaN, infinity or a value too large for dtype(‘float64’).” Could u suggest what can be done to resolve this ???
Is it advisable to do feature scaling before doing feature selection. And can feature selection be done after one hot encoding(like using the get_dummies function). I have multiple columns having many categories and when I one hot encode it gives about 13 extra columns, so should I feature select after label encoding or I can do it after one hot encoding. What would you recommend
Hi Jason, thanks for this answer. In that case, how should we handle these one-hot encoded columns? Does feature importance using coefficient values still work?
Hello Jason, thanks for the continued excellent blogs you provide.
I’m wondering if you can help with something though. I have loaded and prepared my own data set with your sample code instead of using the breast cancer data. My data has 5 cat vars and the output var which us binary:
from pandas import read_csv
from sklearn.model_selection import train_test_split
from sklearn.preprocessing import LabelEncoder
from sklearn.preprocessing import OrdinalEncoder
def load_dataset(filename):
# load the dataset as a pandas DataFrame
data = read_csv(filename, header=None)
# retrieve numpy array
dataset = data.values
# split into input (X) and output (y) variables
X = dataset[:, :-1]
y = dataset[:,-1]
# format all fields as string
X = X.astype(str)
return X, y
# split the data
# load teh dataset
X, y = load_dataset(‘…..cat_tester.csv’)
X_train, X_test, y_train, y_test = train_test_split(X, y, test_size=0.25, random_state=1)
# prepare the input data
X_train_enc, X_test_enc = prepare_inputs(X_train, X_test)
# prepare output data
y_train_enc, y_test_enc = prepare_target(y_train, y_test)
My issue is the error it’s returning which seems to equate to the test data no. of labels but I’m struggling to see what’s causing the issues :
ValueError Traceback (most recent call last)
in ()
37 X_train, X_test, y_train, y_test = train_test_split(X, y, test_size=0.25, random_state=1)
38 # prepare the input data
—> 39 X_train_enc, X_test_enc = prepare_inputs(X_train, X_test)
40 # prepare output data
41 y_train_enc, y_test_enc = prepare_target(y_train, y_test)
~/anaconda3/lib/python3.6/site-packages/sklearn/preprocessing/_encoders.py in _transform(self, X, handle_unknown)
120 msg = (“Found unknown categories {0} in column {1}”
121 ” during transform”.format(diff, i))
–> 122 raise ValueError(msg)
123 else:
124 # Set the problematic rows to an acceptable value and
ValueError: Found unknown categories [‘Above The Rest (IRE)’, ‘Adventureman’, ‘Alba Del Sole (IRE)’, ‘Alfa McGuire (IRE)’, ‘Autretot (FR)’, ‘Axe Axelrod (USA)’, ‘Bartholomeu Dias’, ‘Bedouins Story’, ‘Bird For Life’, ‘Brian The Snail (IRE)’, ‘Canford Heights (IRE)’, ‘Chaplin Bay (IRE)’, ‘Cosmelli (ITY)’, ‘Deebaj (IRE)’, ‘Deeds Not Words (IRE)’, ‘Delilah Park’, ‘Elixsoft (IRE)’, ‘Epona’, ‘Fairy Stories’, ‘Falathaat (USA)’, ‘First Flight (IRE)’, ‘Fool For You (IRE)’, ‘Fronsac’, ‘Full Strength’, ‘Glance’, ‘Gometra Ginty (IRE)’, ‘Houlton’, ‘Hour Of The Dawn (IRE)’, ‘Hurcle (IRE)’, ‘Im Dapper Too’, ‘Irish Charm (FR)’, ‘Jellmood’, ‘Kodiac Lass (IRE)’, ‘Laugh A Minute’, ‘Local History’, ‘London Eye (USA)’, ‘Looking For Carl’, ‘Lucky Lodge’, ‘Military Law’, ‘Moonraker’, ‘Mrs Bouquet’, ‘Mutabaahy (IRE)’, ‘Newmarket Warrior (IRE)’, ‘Nyaleti (IRE)’, ‘Oh Its Saucepot’, ‘Orsino (IRE)’, ‘Paparazzi’, ‘Que Amoro (IRE)’, ‘Raydiance’, ‘Red Galileo’, ‘Regal Banner’, ‘Roman De Brut (IRE)’, ‘Seniority’, ‘Sense of Belonging (FR)’, ‘Shark (FR)’, ‘Sonnet Rose (IRE)’, ‘Speedo Boy (FR)’, ‘Stratum’, ‘Tarboosh’, ‘The Fiddler’, ‘Theglasgowwarrior’, ‘Time Change’, ‘Trevithick’, ‘Trickydickysimpson’, ‘Vale Of Kent (IRE)’, ‘Windsor Cross (IRE)’, ‘Woven’, ‘Youre My Rock’] in column 0 during transform
Your categorical variable has a high cardinality (ie there are too many different entries). Some of it were not seen in the training set, so your model does not recognize it when it sees it in the test set. Decide whether the variable is really necessary. You will need to simplify it. Hope this helps.
I’m getting an error when I try to transform X_test from my dataset using OrdinalEncoder. This is weird because it transforms my X_train data without a problem:
I came across your articles and they are great source of information and really really helpful for the beginners. Thanks a lot for the efforts sharing your knowledge with one and all.
How to train the final model many times on the train data. And then get the performance of the final model on the test dataset many times.
predictions = None
testing_accuracies = []
for k in range(1, 10):
result = cross_val_score(parent_model, X_resampled, y_resampled, cv=k,
scoring=’accuracy’)
print(k, result.mean())
predictions = cross_val_predict(parent_model, X_test, y_test, cv=k)
print(predictions)
test_accuracy = metrics.accuracy_score(y_test, predictions)
testing_accuracies.append(test_accuracy)
print(“Test Accuracy – for iteration :”, test_accuracy)
# Get the average test score
sum = 0
for i in range(len(testing_accuracies)):
score = testing_accuracies[i]
sum += score
avg_test_score = sum / len(testing_accuracies)
print(“Mean Region: Test score “, avg_test_score)
I tried out this code, but it doesn’t seem to give what I want. What I want to do is,
1. train the final model on the train dataset many times as it is a small dataset.
2. Then use that model on the test data.
3. Then repeatedly make predictions & get the average test accuracy of the final model.
For this purpose is it okay if I simply use 2 loops. Or is there any way to perform this with cross validation.
You mention that OrdinalEncoder allows you to specify the order of the variable, this is so because actually we can only use this function when the categorical variable can be sorted with any sense that was acceptable taking into account what the variable refers to and the study at hand, right? But actually you let the algorithm choose it alone, I suppose randomly. It is correct to do that?. Do you have any advice for doing this with categorical variables that can’t be sorted? Thanks and excuse my poor English.
concerning the feature selection part with chi-2 and multi info method, what if I have one hot or multihot encoding of one feature? it is to say we have 3 dimension train_X.
Hi,
Thank you for your blog.
I have read in several posts that LabelEncoder has an ordering problem (1<2<3<4..)
However does this ordering problem exist if i use LabelEncoder for encoding target labels only? (say i have 5 labels)
Hi, Jason great article!
I just wanted to ask that is doing ordinal encoding of all the features even those which aren’t ordinal in nature like ‘breast-quad’ appropriate? Like we do onehot encoding of non-ordinal features before applying any machine learning model, what should we do here?
My target has 3 classes. Should I make them 3 binary variables and do Chi-squared and Mutual Information methods for each binary variable separately? I read somewhere that chi-square is suited for categorical variables and binary targets only (not labels)
Hi. I followed all the steps for the ‘Chi-Squared Feature Selection’ using my dataset, and it is working with 0 problems.
My question is, is there a way, when printing the results, that i can get the original feature name? Something like ‘Feature *name*: value?.
If not, is there any other way for me to find out to exactly what feature does the value correspond?
Yes, the section that lists the selected features indicates the feature number or column index. If you have a list of column names as strings, you can use these indexes to print the names directly.
I have a question about feature selection for classification problem when input feature is nominal categorical variables and output is categorical variable.
For chi2 feature selection, does it matter if one forcibly converts nominal categorical variables to ordinal by using say OrdinalEncoder() ? The SelectKbest internally constructs a contingency table and calculates the chi2 statistic and then orders the variables. The user can select the top K. My question pertains only to selection of features. I understand that forcing nominal variables to be ordinal during training of models can give bad models depending on the ML model used.
To make my question more concrete consider an example problem with two features and a binary target variable (“bought” and “not bought”). The two features are color and shape of the product. The target variable tells if the product was bought or not by the customer. Color has three levels (red, green, blue) and shape has three levels (circular, triangular, square). Clearly both features are nominal. If OrdinalEncoder is used then say (red=0,green=1,blue=2) and (circular=0,triangular=1,square=2). chi2 test is run separately to find dependency between (color, target) and also between (shape, target). I do not see a problem with the test even though the order is fake. Please give your comments.
Secondly, why not use chi2 between (each level, target) ? The above test either accepts or reject each variable. Lets say the chi2 test says that (color, target) is dependent while
(shape,target) is independent. This leads to dropping of shape variable as a predictor. This setup does not inform about which level in each variable is giving rise to the dependence/independence. Therefore in general why not convert each variable into one hot encoded vector and then conduct a chi2 test pairwise (a particular level for particular variable, target). Then maybe a few levels from each variable are rejected and we end up with a reduced dataset that looks like (as an example),
(red,green,triangular,target).
The number of predictor columns decrease from 6 to 3. Please give your valuable comments. Thanks.
I don’t understand why having a large score means it’s significant. How do we know that these scores are larger than the critical value and therefore exists a relationship (not independent)?
Thank you very much for this wonderful tutorial Dr. Brownlee.
If our goal is to do dimension reduction, could MCA be a more efficient solution in this case? Also, what is the pros and cons of using MCA vs feature selection?
Thank you very much for your kind reply.
Sorry for not using the full name Multiple correspondence analysis (MCA) : https://github.com/MaxHalford/prince. Purpose wise it’s similar to PCA.
Also, as you mentioned in previous article, ordinal encoder should only be used when there is relationship between each categories, when the variables are nominal, could the measure of association (http://shakedzy.xyz/dython/) be a replacement of the ordinal+selectKbest?
Thank you very much for your kind reply and helpful guidance.
I have a small question: In Chi-2 calculation, we usually calculate the degree of freedom and pick a significant level(i.e. 5%)to find the critical value, then we compare our chi-2 score and the critical value, if our score is larger then critical value then we say we reject NULL hypothesis and conclude that the 2 variables are dependent.
In this SelectKBest method, how do we know what’s the critical value? Without comparing to a ‘cutoff’ or ‘a standard’, how do we select the K ? I am confused because, for example, assume that feature 3,4,5,8 are the highest 4 compared others, but what if the chi2 score for some of them are less then critical value? Is it still fair to select them as predictor?
I am now working on one of my dataset using selectKBest method, and I have 20 features, (all boolean features), and there are 19 features got >= 20 score with 100), but should I pick the top 3 as the highest, or 19 features since they all actually have high scores and shows a dependency to the output value y?
Hi, great tutorials, really learned a lot! So I have a data set at hand with the following 2 characteristics:
1. it contains nominal values, but a huge number of distinct values (i.e. person names)
2. it contains both numerical and nominal values
And my interest is still investigating a importance of those features for a binary classification problem. I have a few options in mind to get it done:
Recursive Feature Elimination (RFE) combined with Randomforest or LogisticRegression..
Does this sound reasonable? It still kinda bugs me on how to deal with those nominal values with large distinct values.
Any suggestions or ideas would be greatly appreciated!
First, thank you this amazing helpful tutorials. You articles are really on the best and I often find my solutions in them.
Second, I have been doing research about my problem (correlation) but didn’t really find something useful.
I have classification problem and have multiple input features which I want to feed to my neural network. I want to know the correlation between the input feature(s) and the categorical output. Once I know whether there is correlation or not, I manually want to perform feature selection and add/remove this feature.
My input features are:
1. “numerical real-valued” numbers (shape: N, 1)
2. “categorical vectors [textual data] (shape: N, >1)
3. “numerical vectors” of shape (shape: N, >1)
(where “N” is the number of training examples)
For point 2, instead of having textual/categorical data separated into multiple input features (shape: N, 1), I am having them combined (shape: N, >1). Thus,I need to find a single correlation between a categorical vector and the categorical output.
For point 3, I want to also find a single correlation between my multidimensional array (shape: N, >1) and my output.
By single correlation coefficient I mean, I am not interested in the correlation of each parameter in the vector with that of the output, I am rather looking for the correlation between the entire vector and the output.
Thank you. Please let me know if any clarification is needed.
Hi Jason, I have a question.
You have used Ordinal encoding for categorical features. But what if categorical features are nominal? Which encoding should we use?
What I like the most about your worked examples is that, besides the main topic, I learn much more things.
After deploying the model, how to perform the same transformation (in this present case the ordinal encoding ) on the new data as we did to the training samples ( oe.transform(X_train) ), to make sure that the encoding remains the same.
Thank you so much, Sir, for these amazing and comprehensible tutorials. You sure hold a lot of credit for what I know today in Data Science. God Bless You.
Thank you for the above, it was very useful indeed. But one important item missing is getting a list of the variables that were kept and deemed useful by the model and which were ‘dropped’. This is pretty important if we really want to understand the model and how it forecasts.
In one of the questions, you write
“Yes, the section that lists the selected features indicates the feature number or column index. If you have a list of column names as strings, you can use these indexes to print the names directly.”
For those of use who are newbies, can you please show us how this is done? Is there a link to another section of your website that has this info?
You can use the feature selection method in a standalone manner and report the features that were selected and ones that were dropped using attributes on the object itself.
Hello Jason, and thank you for all the material that you share with us.
I would like to ask you how to deal with the ‘random_state’ parameter when invoking ‘mutual_info_classif’ feature selection method.
I found that this parameter, if not initialized (e.g with the usual 42), in practice causes completely different features to be selected as most important at every execution.
Hi,
Thank you for the useful post. Do you by any chance have another post that goes over unsupervised feature selection (I mean since I don’t have target variable), how can I figure out which features are important/irrelevant/redundant/etc in my dataset? Thanks!
Features are important for what? That’s why we usually use it for supervised learning because we can measure.
If you really want to go on that direction, may be you can consider the correlation between features and see if they have low correlation? Because a high correlation means two features are essentially carrying the same information.
Thank you Adrian. What you are saying makes sense, however, measuring correlation between feature will only cover linear correlation among them for me. However, I need non-linear as well.
Basically, what I have is a set of features (no class labels), that I’d like to get rid of those features that are basically repetitive and keep the ones that are set together (the values under features are 0 and 1). So I am thinking about mutual information but do not know how to perform with no target variable (/class label). I appreciate any help I can get!
Correlation is the closest bet here that I can think of. Otherwise you may consider to use feature *extraction* instead of feature *selection*, which for example you can use PCA transform of your features instead of the features directly.
Correct. PCA is blending all features together and extract something new. If you think about it, if one feature is a key and the other is redundant, you can also turn it around and say the other is key while the first one is redundant. That’s why no unique way to do this selection.
In that case it doesn’t matter which one you choose of course, since those are repetitive/redundant. The idea is to find a subset of features with high importance. It’s alright… I’ll figure it out.
Hi Ashwin…It is common practice to convert categorical features to numerical features. Please refer to the documentation below related to LabelEncoder.
Hello Adrian, thanks for the beautiful and comprehensive paper!
I’ve got one question, regarding one project that I am handling:
The database is composed by many columns that are binary, that is: IsBitDefenderEnabled (0/1), IsSxsPassiveModeEnabled (0/1), and so on, but they are not the target label (which is binary too).
How can I conduct feature selection over this type of features? Should I consider the values as vectors and use a distance metric such as the co-sine to investigate the similarity with the target label?
I am looking forward to hearing from you!
Best,
Jacopo
Thanks for the post, very well explained. Reading through a question came up, when talking about the data set you mentioned that a good classification accuracy would be around 76%. I was wondering how did you come up with that number?
I skimmed through the paper “Mutual information between discrete and continuous datasets”. A KNN based approach is used to calculate the mutual information for implementing “mutual_info_classification” and “mutual_info_regression”. I have the following quick questions. Please reply when you can.
1) Since there is a distance measure involved in the KNN approach, you reckon outliers in the data will have an impact on the mutual information calculation? Thus, the best practice would be to cap/ floor outliers before implementing feature selection using mutual information? It is interesting to note that the “binning implementation” of the mutual information should not be impacted by outliers
2) I don’t think the skewness of the distributions of the variables x and y would have an impact on mutual information calculation. Right? Thus, we don’t have to make the distributions more Gaussian before implementing feature selection using mutual information?
1. Your understanding is correct! Do you have any implementations of KNN that would confirm this? I would be interested.
2. The following may help add clarity:
Thanks for your reply James. So, I have skimmed through that paper I mentioned. However, I believe the binning process is similar to what is generally done for credit risk modelling. If you google – Weights of evidence and Information Value (IV) – you will see that IV and mutual information are similar concepts. I might have to check whether they calculate the same things though. The ease of using IV approach via binning is that, we don’t have to worry about any outliers and skewness in the data. I believe when mutual information is calculated using the binning approach, we should not worry about outliers and skewness. It is the same thing as using a decision tree stump with >=2 splits of a variable.
Thanks for that link. We can always transform variables to adjust for skewness.


 for Feature Selection in Python")

Hi Jason,
I have performed feature selection on the columns of my data (after cleaning it). The method I used is the Extra Tree Classifier for Feature Selection (from sklearn.ensemble).
I fit the model and get the n most relevant features of my data. However, every time I run it, different features come up as the most important ones. I’m not sure why this is happening, shouldn’t the method always output the same n top features?
Thanks for your inputs!
Perhaps the choice of model has too much variance.
Perhaps try an alternate model or alternate model configuration with less variance?
Perhaps try evaluating the strategy “on average” rather than for a single run?
Perhaps compare the approach on average to other less stochastic methods, like RFE or chi squared?
Hello Alan,
The problem is in fact even broader than you describe because there exist variable importance methods different than default Gini importance from ExtraTrees or RandomForest in sklearn.
I have in mind for example permutation and dropcol importances. And each of those can provide different variable rankings.
From my experience I apply multiple permutation importance evaluations (e.g. 5 times) and take an average before comparing variables.
Regards!
Very useful! Thanks!
Thanks, I’m happy to hear that!
Why do the two methods give completely different values for feature importance?
Maybe the numbering of features is not matching?
There is no ground truth of “importance”, just different “ideas” or methods.
Try a suite of methods, fit models and see which subset of features results in the most skilful model:
https://machinelearningmastery.com/faq/single-faq/what-feature-selection-method-should-i-use
Jason:
I am a long time fan of your blog posts. I want to bring to your attention a new library that I have developed called Auto_ViML which performs feature selection and model tuning automatically using many great Kaggle techniques. I’d like you to try it on this breast-cancer.csv file and report results if you can.
Here’s the Medium article that describes it:
https://towardsdatascience.com/why-automl-is-an-essential-new-tool-for-data-scientists-2d9ab4e25e46?gi=7814502b6fb8
Please try It and let me know. Thanks.
Thanks for your note.
Thank you for this a nice post with an illustrative code demo.
I have a question on the Chi-Squared Feature Selection:
Are the importance (score) of variable and the Chi-squared score same thing, OR different things in opposite direction?
The reason I am puzzled is by below understanding (misunderstanding?). The null hypothesis of Chi-Squared test is that the two inputs have similar distribution (i.e. related or dependent). Thus, higher Chi-Squared score implies less dependency. For the sake of feature selection, we want to use those variables that are related to target variable for predicting. Or in your text, “those features that are independent of the target variable can be REMOVED from the dataset”.
My understanding is that variables with larger Chi-square score should be removed, since they are independent to the target variable. Thus, I have the impression that the importance of variable be inverse to the raw Chi-square score.
Good question.
No, the null hypothesis (h0) for chi squared is that they are independent. Larger scores mean more dependent.
See this for details on how chi squared works:
https://machinelearningmastery.com/chi-squared-test-for-machine-learning/
And this:
https://machinelearningmastery.com/statistical-hypothesis-tests-in-python-cheat-sheet/
Hello Jason,
I have a question.
Regularization methods increase accuracy and reduce overfitting or are just for accuracy?
Thanks
Regularization reduces complexity, which often reduces overfitting and generalization error.
Hello Jason,
one more question is about using sklearn Precision, Recall, F1 metrics and ROC/ AUC to evaluate Keras model.
Is up to you correct to use the above metrics to evaluate Keras models?
Does Keras provide any other function to evaluate models?
Thanks
Here is an example:
https://machinelearningmastery.com/how-to-calculate-precision-recall-f1-and-more-for-deep-learning-models/
Hello Jason,
Thanks for sharing the interesting blog!
You’re welcome!
Hi Jason, I have a question.
I have read it somewhere that we should use dummy variable (using one hot encoding ) for those categorical features which have more than 2 categories. But in this logistic regression model you have not done so which makes me confused about when exactly should we use dummy variable and when it is not necessary.
Please help.
Because the test problem has 2 classes.
But there are many features with more than 2 classes. (e.g. breast-quad has 5 classes: left-up, left-low, right-up, right-low, central).
So my question is that whether we should use dummy variable for such columns or not.
They are input variables.
The class is the output variable. There is one class and it has two values.
I think his problem is why can use OrdinalEncoder to encode those 5 classes instead of OHE, because their relationship is equal but OE doesn’t show this property.
Hi James…Thank you for your feedback!
I’m using the same piece of code and getting this stuck at this error when I am encoding my inputs using ordinalencoder : “Input contains NaN, infinity or a value too large for dtype(‘float64’).” Could u suggest what can be done to resolve this ???
I have some suggestions here for you:
https://machinelearningmastery.com/faq/single-faq/why-does-the-code-in-the-tutorial-not-work-for-me
Is it advisable to do feature scaling before doing feature selection. And can feature selection be done after one hot encoding(like using the get_dummies function). I have multiple columns having many categories and when I one hot encode it gives about 13 extra columns, so should I feature select after label encoding or I can do it after one hot encoding. What would you recommend
Great question!
I guess it depends on the feature selection methods being used.
Feature selection on one hot encoded columns is probably not a good idea.
Hi Jason, thanks for this answer. In that case, how should we handle these one-hot encoded columns? Does feature importance using coefficient values still work?
As in the above tutorial, try feature selection on the ordinal encoded variables.
It is best practice to apply ordinal encoding to nominal features for feature selection.
Do I understand this right?
Hi Sonicsun23…the following resource may be of interest and help clarify best practices:
https://machinelearningmastery.com/one-hot-encoding-for-categorical-data/
https://machinelearningmastery.com/framework-for-data-preparation-for-machine-learning/
Hello Jason, thanks for the continued excellent blogs you provide.
I’m wondering if you can help with something though. I have loaded and prepared my own data set with your sample code instead of using the breast cancer data. My data has 5 cat vars and the output var which us binary:
from pandas import read_csv
from sklearn.model_selection import train_test_split
from sklearn.preprocessing import LabelEncoder
from sklearn.preprocessing import OrdinalEncoder
def load_dataset(filename):
# load the dataset as a pandas DataFrame
data = read_csv(filename, header=None)
# retrieve numpy array
dataset = data.values
# split into input (X) and output (y) variables
X = dataset[:, :-1]
y = dataset[:,-1]
# format all fields as string
X = X.astype(str)
return X, y
# prepare input data
def prepare_inputs(X_train, X_test):
oe = OrdinalEncoder()
oe.fit(X_train)
X_train_enc = oe.transform(X_train)
X_test_enc = oe.transform(X_test)
return X_train_enc, X_test_enc
# prepare target
def prepare_target(y_train, y_test):
le = LabelEncoder()
le.fit(y_train)
y_train_enc = le.transform(y_train)
y_test_enc = le.transform(y_test)
return y_train_enc, y_test_enc
# split the data
# load teh dataset
X, y = load_dataset(‘…..cat_tester.csv’)
X_train, X_test, y_train, y_test = train_test_split(X, y, test_size=0.25, random_state=1)
# prepare the input data
X_train_enc, X_test_enc = prepare_inputs(X_train, X_test)
# prepare output data
y_train_enc, y_test_enc = prepare_target(y_train, y_test)
My issue is the error it’s returning which seems to equate to the test data no. of labels but I’m struggling to see what’s causing the issues :
ValueError Traceback (most recent call last)
in ()
37 X_train, X_test, y_train, y_test = train_test_split(X, y, test_size=0.25, random_state=1)
38 # prepare the input data
—> 39 X_train_enc, X_test_enc = prepare_inputs(X_train, X_test)
40 # prepare output data
41 y_train_enc, y_test_enc = prepare_target(y_train, y_test)
in prepare_inputs(X_train, X_test)
21 oe.fit(X_train)
22 X_train_enc = oe.transform(X_train)
—> 23 X_test_enc = oe.transform(X_test)
24 return X_train_enc, X_test_enc
25
~/anaconda3/lib/python3.6/site-packages/sklearn/preprocessing/_encoders.py in transform(self, X)
955
956 “””
–> 957 X_int, _ = self._transform(X)
958 return X_int.astype(self.dtype, copy=False)
959
~/anaconda3/lib/python3.6/site-packages/sklearn/preprocessing/_encoders.py in _transform(self, X, handle_unknown)
120 msg = (“Found unknown categories {0} in column {1}”
121 ” during transform”.format(diff, i))
–> 122 raise ValueError(msg)
123 else:
124 # Set the problematic rows to an acceptable value and
ValueError: Found unknown categories [‘Above The Rest (IRE)’, ‘Adventureman’, ‘Alba Del Sole (IRE)’, ‘Alfa McGuire (IRE)’, ‘Autretot (FR)’, ‘Axe Axelrod (USA)’, ‘Bartholomeu Dias’, ‘Bedouins Story’, ‘Bird For Life’, ‘Brian The Snail (IRE)’, ‘Canford Heights (IRE)’, ‘Chaplin Bay (IRE)’, ‘Cosmelli (ITY)’, ‘Deebaj (IRE)’, ‘Deeds Not Words (IRE)’, ‘Delilah Park’, ‘Elixsoft (IRE)’, ‘Epona’, ‘Fairy Stories’, ‘Falathaat (USA)’, ‘First Flight (IRE)’, ‘Fool For You (IRE)’, ‘Fronsac’, ‘Full Strength’, ‘Glance’, ‘Gometra Ginty (IRE)’, ‘Houlton’, ‘Hour Of The Dawn (IRE)’, ‘Hurcle (IRE)’, ‘Im Dapper Too’, ‘Irish Charm (FR)’, ‘Jellmood’, ‘Kodiac Lass (IRE)’, ‘Laugh A Minute’, ‘Local History’, ‘London Eye (USA)’, ‘Looking For Carl’, ‘Lucky Lodge’, ‘Military Law’, ‘Moonraker’, ‘Mrs Bouquet’, ‘Mutabaahy (IRE)’, ‘Newmarket Warrior (IRE)’, ‘Nyaleti (IRE)’, ‘Oh Its Saucepot’, ‘Orsino (IRE)’, ‘Paparazzi’, ‘Que Amoro (IRE)’, ‘Raydiance’, ‘Red Galileo’, ‘Regal Banner’, ‘Roman De Brut (IRE)’, ‘Seniority’, ‘Sense of Belonging (FR)’, ‘Shark (FR)’, ‘Sonnet Rose (IRE)’, ‘Speedo Boy (FR)’, ‘Stratum’, ‘Tarboosh’, ‘The Fiddler’, ‘Theglasgowwarrior’, ‘Time Change’, ‘Trevithick’, ‘Trickydickysimpson’, ‘Vale Of Kent (IRE)’, ‘Windsor Cross (IRE)’, ‘Woven’, ‘Youre My Rock’] in column 0 during transform
Can you advise at all.
This is a common question that I answer here:
https://machinelearningmastery.com/faq/single-faq/can-you-read-review-or-debug-my-code
Your categorical variable has a high cardinality (ie there are too many different entries). Some of it were not seen in the training set, so your model does not recognize it when it sees it in the test set. Decide whether the variable is really necessary. You will need to simplify it. Hope this helps.
I’m getting an error when I try to transform X_test from my dataset using OrdinalEncoder. This is weird because it transforms my X_train data without a problem:
14 X_train_enc = oe.transform(X_train)
—> 15 X_test_enc = oe.transform(X_test)
ValueError: Found unknown categories [‘1733′, ’56’] in column 0 during transform
This can happen if the test set has values not seen in the training set.
You can change the training set to have an example of all possible cases.
Or create a custom mapping of all known cases to integers.
Hi! I too am facing the same problem. Could you figure it out?
Hi Jason
I came across your articles and they are great source of information and really really helpful for the beginners. Thanks a lot for the efforts sharing your knowledge with one and all.
God bless you.
Thanks!
How to train the final model many times on the train data. And then get the performance of the final model on the test dataset many times.
predictions = None
testing_accuracies = []
for k in range(1, 10):
result = cross_val_score(parent_model, X_resampled, y_resampled, cv=k,
scoring=’accuracy’)
print(k, result.mean())
predictions = cross_val_predict(parent_model, X_test, y_test, cv=k)
print(predictions)
test_accuracy = metrics.accuracy_score(y_test, predictions)
testing_accuracies.append(test_accuracy)
print(“Test Accuracy – for iteration :”, test_accuracy)
# Get the average test score
sum = 0
for i in range(len(testing_accuracies)):
score = testing_accuracies[i]
sum += score
avg_test_score = sum / len(testing_accuracies)
print(“Mean Region: Test score “, avg_test_score)
I tried out this code, but it doesn’t seem to give what I want. What I want to do is,
1. train the final model on the train dataset many times as it is a small dataset.
2. Then use that model on the test data.
3. Then repeatedly make predictions & get the average test accuracy of the final model.
For this purpose is it okay if I simply use 2 loops. Or is there any way to perform this with cross validation.
Thanks
San
Sorry, I don’t understand.
We evaluate models using a resampling procedure. There is only a single final model, or an ensemble of final models.
Perhaps see this:
https://machinelearningmastery.com/train-final-machine-learning-model/
You mention that OrdinalEncoder allows you to specify the order of the variable, this is so because actually we can only use this function when the categorical variable can be sorted with any sense that was acceptable taking into account what the variable refers to and the study at hand, right? But actually you let the algorithm choose it alone, I suppose randomly. It is correct to do that?. Do you have any advice for doing this with categorical variables that can’t be sorted? Thanks and excuse my poor English.
Probably not, as I stated in the tutorial.
If the variable is ordinal, it is probably best to represent it using an ordinalencoder.
concerning the feature selection part with chi-2 and multi info method, what if I have one hot or multihot encoding of one feature? it is to say we have 3 dimension train_X.
Great question.
The selection is performed before the encoding.
Hi,
Thank you for your blog.
I have read in several posts that LabelEncoder has an ordering problem (1<2<3<4..)
However does this ordering problem exist if i use LabelEncoder for encoding target labels only? (say i have 5 labels)
Great question!
Typically no, as good implementation of the standard algorithms is aware if this representation.
A naive implementation of a given algorithm may have this problem.
Hi, Jason great article!
I just wanted to ask that is doing ordinal encoding of all the features even those which aren’t ordinal in nature like ‘breast-quad’ appropriate? Like we do onehot encoding of non-ordinal features before applying any machine learning model, what should we do here?
Probably not appropriate, but try it anyway. Sometimes good results come from breaking the rules.
Hello,
My target has 3 classes. Should I make them 3 binary variables and do Chi-squared and Mutual Information methods for each binary variable separately? I read somewhere that chi-square is suited for categorical variables and binary targets only (not labels)
No, probably ordinal encode the labels then try the statistical test.
Hi. I followed all the steps for the ‘Chi-Squared Feature Selection’ using my dataset, and it is working with 0 problems.
My question is, is there a way, when printing the results, that i can get the original feature name? Something like ‘Feature *name*: value?.
If not, is there any other way for me to find out to exactly what feature does the value correspond?
Thank you for your great work.
Well done!
Yes, the section that lists the selected features indicates the feature number or column index. If you have a list of column names as strings, you can use these indexes to print the names directly.
Forgive me if this is a noob question but I was wondering for a case when the data has a mix of categorical and numerical variables.
Can we split the data into :
– ds1 with numeric and target
– ds2 with categorical and target
and then apply fclassif on ds1 and chisquare on ds2?
Thank you for this article!
Yes, you can use an rfe that does not care about data types:
https://machinelearningmastery.com/rfe-feature-selection-in-python/
Or use a columntransformer to split by types and select separately:
https://machinelearningmastery.com/columntransformer-for-numerical-and-categorical-data/
why the Mutual Information Feature Selection need a lot of time to calculate? extremely slow?
It treats each observation as an event from a distribution. If you have fewer events (unique values) it would be faster.
I have a question about feature selection for classification problem when input feature is nominal categorical variables and output is categorical variable.
For chi2 feature selection, does it matter if one forcibly converts nominal categorical variables to ordinal by using say OrdinalEncoder() ? The SelectKbest internally constructs a contingency table and calculates the chi2 statistic and then orders the variables. The user can select the top K. My question pertains only to selection of features. I understand that forcing nominal variables to be ordinal during training of models can give bad models depending on the ML model used.
To make my question more concrete consider an example problem with two features and a binary target variable (“bought” and “not bought”). The two features are color and shape of the product. The target variable tells if the product was bought or not by the customer. Color has three levels (red, green, blue) and shape has three levels (circular, triangular, square). Clearly both features are nominal. If OrdinalEncoder is used then say (red=0,green=1,blue=2) and (circular=0,triangular=1,square=2). chi2 test is run separately to find dependency between (color, target) and also between (shape, target). I do not see a problem with the test even though the order is fake. Please give your comments.
Secondly, why not use chi2 between (each level, target) ? The above test either accepts or reject each variable. Lets say the chi2 test says that (color, target) is dependent while
(shape,target) is independent. This leads to dropping of shape variable as a predictor. This setup does not inform about which level in each variable is giving rise to the dependence/independence. Therefore in general why not convert each variable into one hot encoded vector and then conduct a chi2 test pairwise (a particular level for particular variable, target). Then maybe a few levels from each variable are rejected and we end up with a reduced dataset that looks like (as an example),
(red,green,triangular,target).
The number of predictor columns decrease from 6 to 3. Please give your valuable comments. Thanks.
Yes, it may matter to force a categorical variable to be ordinal.
Perhaps try a few methods listed above and see which results in a model with the best performance for your dataset.
I don’t understand why having a large score means it’s significant. How do we know that these scores are larger than the critical value and therefore exists a relationship (not independent)?
Is this something we have to check later on?
Perhaps this will help with understanding critical values in hypothesis tests more generally:
https://machinelearningmastery.com/critical-values-for-statistical-hypothesis-testing/
Thank you very much for this wonderful tutorial Dr. Brownlee.
If our goal is to do dimension reduction, could MCA be a more efficient solution in this case? Also, what is the pros and cons of using MCA vs feature selection?
Thank you very much for your kind reply.
What is MCA?
Sorry for not using the full name Multiple correspondence analysis (MCA) : https://github.com/MaxHalford/prince. Purpose wise it’s similar to PCA.
Also, as you mentioned in previous article, ordinal encoder should only be used when there is relationship between each categories, when the variables are nominal, could the measure of association (http://shakedzy.xyz/dython/) be a replacement of the ordinal+selectKbest?
Thank you very much for your kind reply and helpful guidance.
I’m not familiar with either project, sorry.
Thanks anyway. What you shared here already helped a lot.
I’m happy to hear that.
Hi Jason,
Thanks for sharing, this works great for me.
I have a small question: In Chi-2 calculation, we usually calculate the degree of freedom and pick a significant level(i.e. 5%)to find the critical value, then we compare our chi-2 score and the critical value, if our score is larger then critical value then we say we reject NULL hypothesis and conclude that the 2 variables are dependent.
In this SelectKBest method, how do we know what’s the critical value? Without comparing to a ‘cutoff’ or ‘a standard’, how do we select the K ? I am confused because, for example, assume that feature 3,4,5,8 are the highest 4 compared others, but what if the chi2 score for some of them are less then critical value? Is it still fair to select them as predictor?
I am now working on one of my dataset using selectKBest method, and I have 20 features, (all boolean features), and there are 19 features got >= 20 score with 100), but should I pick the top 3 as the highest, or 19 features since they all actually have high scores and shows a dependency to the output value y?
Thanks again!
I’m happy to hear that.
You could treat the cut-off as a hyperparameter and tune it (preferred), or perform the statistical test manually for each variable (yuck).
Sorry got a typo there-
‘there are 19 features got score >= 20 and with <0.01 p value'
Hi, great tutorials, really learned a lot! So I have a data set at hand with the following 2 characteristics:
1. it contains nominal values, but a huge number of distinct values (i.e. person names)
2. it contains both numerical and nominal values
And my interest is still investigating a importance of those features for a binary classification problem. I have a few options in mind to get it done:
Recursive Feature Elimination (RFE) combined with Randomforest or LogisticRegression..
Does this sound reasonable? It still kinda bugs me on how to deal with those nominal values with large distinct values.
Any suggestions or ideas would be greatly appreciated!
Thanks!
Yes, sounds like a good start. I’d use RFE and wrap a robust model or the model I intended to use.
Names are probably not predictive. If you think they are, ordinal encode them, or a hash or an embedding or a even a bag of words and test.
Hello Jason,
First, thank you this amazing helpful tutorials. You articles are really on the best and I often find my solutions in them.
Second, I have been doing research about my problem (correlation) but didn’t really find something useful.
I have classification problem and have multiple input features which I want to feed to my neural network. I want to know the correlation between the input feature(s) and the categorical output. Once I know whether there is correlation or not, I manually want to perform feature selection and add/remove this feature.
My input features are:
1. “numerical real-valued” numbers (shape: N, 1)
2. “categorical vectors [textual data] (shape: N, >1)
3. “numerical vectors” of shape (shape: N, >1)
(where “N” is the number of training examples)
For point 2, instead of having textual/categorical data separated into multiple input features (shape: N, 1), I am having them combined (shape: N, >1). Thus,I need to find a single correlation between a categorical vector and the categorical output.
For point 3, I want to also find a single correlation between my multidimensional array (shape: N, >1) and my output.
By single correlation coefficient I mean, I am not interested in the correlation of each parameter in the vector with that of the output, I am rather looking for the correlation between the entire vector and the output.
Thank you. Please let me know if any clarification is needed.
Thanks!
Not sure about that. Correlation is designed to operate between two variables, such as one input and one output variable.
Thanks for your reply Jason.
I think performing “Sensitivity Analysis” makes more sense for my case.
Great!
Hi Jason, I have a question.
You have used Ordinal encoding for categorical features. But what if categorical features are nominal? Which encoding should we use?
Same – at least for feature selection.
Hi Jason,
What I like the most about your worked examples is that, besides the main topic, I learn much more things.
After deploying the model, how to perform the same transformation (in this present case the ordinal encoding ) on the new data as we did to the training samples ( oe.transform(X_train) ), to make sure that the encoding remains the same.
Thanks in advance.
Thanks.
You must save your transform objects along with the model so that the same transform can be applied to new data:
https://machinelearningmastery.com/how-to-save-and-load-models-and-data-preparation-in-scikit-learn-for-later-use/
Thanks.
Thank you so much, Sir, for these amazing and comprehensible tutorials. You sure hold a lot of credit for what I know today in Data Science. God Bless You.
You’re very welcome!
Hi Jason,
Chi-Squared Feature Selection could be applied in a dataset with numerical inputs and categorical output?
Thanks in advance
It could, but it would not be appropriate.
Instead, see alternate methods here:
https://machinelearningmastery.com/feature-selection-with-real-and-categorical-data/
Hi Jason,
Thank you for the above, it was very useful indeed. But one important item missing is getting a list of the variables that were kept and deemed useful by the model and which were ‘dropped’. This is pretty important if we really want to understand the model and how it forecasts.
In one of the questions, you write
“Yes, the section that lists the selected features indicates the feature number or column index. If you have a list of column names as strings, you can use these indexes to print the names directly.”
For those of use who are newbies, can you please show us how this is done? Is there a link to another section of your website that has this info?
All the best.
You’re welcome.
You can use the feature selection method in a standalone manner and report the features that were selected and ones that were dropped using attributes on the object itself.
I have many examples on the blog and in the books, perhaps start here:
https://machinelearningmastery.com/rfe-feature-selection-in-python/
You can also search “feature selection” in the box at the top of the page.
Hello Jason, and thank you for all the material that you share with us.
I would like to ask you how to deal with the ‘random_state’ parameter when invoking ‘mutual_info_classif’ feature selection method.
I found that this parameter, if not initialized (e.g with the usual 42), in practice causes completely different features to be selected as most important at every execution.
Am I missing something?
Again, thank you in advance.
You’re welcome.
You can set the random_state (seed) to anything you like, see this:
https://machinelearningmastery.com/introduction-to-random-number-generators-for-machine-learning/
Jason… It’s a wonderful post.. A great solution to my problem. But is it available in R Code?
Thanks!
Sorry, I don’t have an example in R.
Hi,
Thank you for the useful post. Do you by any chance have another post that goes over unsupervised feature selection (I mean since I don’t have target variable), how can I figure out which features are important/irrelevant/redundant/etc in my dataset? Thanks!
Features are important for what? That’s why we usually use it for supervised learning because we can measure.
If you really want to go on that direction, may be you can consider the correlation between features and see if they have low correlation? Because a high correlation means two features are essentially carrying the same information.
Thank you Adrian. What you are saying makes sense, however, measuring correlation between feature will only cover linear correlation among them for me. However, I need non-linear as well.
Basically, what I have is a set of features (no class labels), that I’d like to get rid of those features that are basically repetitive and keep the ones that are set together (the values under features are 0 and 1). So I am thinking about mutual information but do not know how to perform with no target variable (/class label). I appreciate any help I can get!
Correlation is the closest bet here that I can think of. Otherwise you may consider to use feature *extraction* instead of feature *selection*, which for example you can use PCA transform of your features instead of the features directly.
Thanks, but PCA doesn’t tell me which features are the key and others are basically repetitive.
The whole point of this project is know know the important features. Thank you for your thoughts though!
Correct. PCA is blending all features together and extract something new. If you think about it, if one feature is a key and the other is redundant, you can also turn it around and say the other is key while the first one is redundant. That’s why no unique way to do this selection.
In that case it doesn’t matter which one you choose of course, since those are repetitive/redundant. The idea is to find a subset of features with high importance. It’s alright… I’ll figure it out.
what if the dataset has a combination of numerical and categorical features.
Numerical should be easy as you don’t need to do one-hot encoding, for example.
Hi Ashwin…It is common practice to convert categorical features to numerical features. Please refer to the documentation below related to LabelEncoder.
https://scikit-learn.org/stable/modules/generated/sklearn.preprocessing.LabelEncoder.html
Regards,
Hello Adrian, thanks for the beautiful and comprehensive paper!
I’ve got one question, regarding one project that I am handling:
The database is composed by many columns that are binary, that is: IsBitDefenderEnabled (0/1), IsSxsPassiveModeEnabled (0/1), and so on, but they are not the target label (which is binary too).
How can I conduct feature selection over this type of features? Should I consider the values as vectors and use a distance metric such as the co-sine to investigate the similarity with the target label?
I am looking forward to hearing from you!
Best,
Jacopo
Hi Jacopo…Thanks for asking.
Sorry, I cannot help you with your project.
I’m eager to help, but I don’t have the capacity to get involved in your project at the level you need or at a level to do a good job.
I’m sure you can understand my position, as I get many of requests to help with projects each day.
Nevertheless, I am happy to answer any specific questions you have about machine learning.
Hi Jason!
Thanks for the post, very well explained. Reading through a question came up, when talking about the data set you mentioned that a good classification accuracy would be around 76%. I was wondering how did you come up with that number?
Hi Natalia…In general any score greater than the performance of a naive model is considered a “good” score.
Hi, Jason!
Could you help me. I don`t understand, what we want to predict in our data with cancer?
Hi Alina…One possibility is simply a classification of the presence of cancer or not.
Hi James / Jason –
I skimmed through the paper “Mutual information between discrete and continuous datasets”. A KNN based approach is used to calculate the mutual information for implementing “mutual_info_classification” and “mutual_info_regression”. I have the following quick questions. Please reply when you can.
1) Since there is a distance measure involved in the KNN approach, you reckon outliers in the data will have an impact on the mutual information calculation? Thus, the best practice would be to cap/ floor outliers before implementing feature selection using mutual information? It is interesting to note that the “binning implementation” of the mutual information should not be impacted by outliers
2) I don’t think the skewness of the distributions of the variables x and y would have an impact on mutual information calculation. Right? Thus, we don’t have to make the distributions more Gaussian before implementing feature selection using mutual information?
Hi Varun,
1. Your understanding is correct! Do you have any implementations of KNN that would confirm this? I would be interested.
2. The following may help add clarity:
https://towardsdatascience.com/skewed-data-a-problem-to-your-statistical-model-9a6b5bb74e37
Thanks for your reply James. So, I have skimmed through that paper I mentioned. However, I believe the binning process is similar to what is generally done for credit risk modelling. If you google – Weights of evidence and Information Value (IV) – you will see that IV and mutual information are similar concepts. I might have to check whether they calculate the same things though. The ease of using IV approach via binning is that, we don’t have to worry about any outliers and skewness in the data. I believe when mutual information is calculated using the binning approach, we should not worry about outliers and skewness. It is the same thing as using a decision tree stump with >=2 splits of a variable.
Thanks for that link. We can always transform variables to adjust for skewness.