
It can be difficult to determine whether your Long Short-Term Memory model is performing well on your sequence prediction problem.
You may be getting a good model skill score, but it is important to know whether your model is a good fit for your data or if it is underfit or overfit and could do better with a different configuration.
In this tutorial, you will discover how you can diagnose the fit of your LSTM model on your sequence prediction problem.
After completing this tutorial, you will know:
- How to gather and plot training history of LSTM models.
- How to diagnose an underfit, good fit, and overfit model.
- How to develop more robust diagnostics by averaging multiple model runs.
Kick-start your project with my new book Long Short-Term Memory Networks With Python, including step-by-step tutorials and the Python source code files for all examples.
Let’s get started.
- Update Jan/2020: Updated API for Keras 2.3 and TensorFlow 2.0.
Tutorial Overview
This tutorial is divided into 6 parts; they are:
- Training History in Keras
- Diagnostic Plots
- Underfit Example
- Good Fit Example
- Overfit Example
- Multiple Runs Example
1. Training History in Keras
You can learn a lot about the behavior of your model by reviewing its performance over time.
LSTM models are trained by calling the fit() function. This function returns a variable called history that contains a trace of the loss and any other metrics specified during the compilation of the model. These scores are recorded at the end of each epoch.
|
1 2 |
... history = model.fit(...) |
For example, if your model was compiled to optimize the log loss (binary_crossentropy) and measure accuracy each epoch, then the log loss and accuracy will be calculated and recorded in the history trace for each training epoch.
Each score is accessed by a key in the history object returned from calling fit(). By default, the loss optimized when fitting the model is called “loss” and accuracy is called “acc“.
|
1 2 3 4 5 |
... model.compile(loss='binary_crossentropy', optimizer='adam', metrics=['accuracy']) history = model.fit(X, Y, epochs=100) print(history.history['loss']) print(history.history['accuracy']) |
Keras also allows you to specify a separate validation dataset while fitting your model that can also be evaluated using the same loss and metrics.
This can be done by setting the validation_split argument on fit() to use a portion of the training data as a validation dataset.
|
1 2 |
... history = model.fit(X, Y, epochs=100, validation_split=0.33) |
This can also be done by setting the validation_data argument and passing a tuple of X and y datasets.
|
1 2 |
... history = model.fit(X, Y, epochs=100, validation_data=(valX, valY)) |
The metrics evaluated on the validation dataset are keyed using the same names, with a “val_” prefix.
|
1 2 3 4 5 6 7 |
... model.compile(loss='binary_crossentropy', optimizer='adam', metrics=['accuracy']) history = model.fit(X, Y, epochs=100, validation_split=0.33) print(history.history['loss']) print(history.history['accuracy']) print(history.history['val_loss']) print(history.history['val_accuracy']) |
2. Diagnostic Plots
The training history of your LSTM models can be used to diagnose the behavior of your model.
You can plot the performance of your model using the Matplotlib library. For example, you can plot training loss vs test loss as follows:
|
1 2 3 4 5 6 7 8 9 10 |
from matplotlib import pyplot ... history = model.fit(X, Y, epochs=100, validation_data=(valX, valY)) pyplot.plot(history.history['loss']) pyplot.plot(history.history['val_loss']) pyplot.title('model train vs validation loss') pyplot.ylabel('loss') pyplot.xlabel('epoch') pyplot.legend(['train', 'validation'], loc='upper right') pyplot.show() |
Creating and reviewing these plots can help to inform you about possible new configurations to try in order to get better performance from your model.
Next, we will look at some examples. We will consider model skill on the train and validation sets in terms of loss that is minimized. You can use any metric that is meaningful on your problem.
3. Underfit Example
An underfit model is one that is demonstrated to perform well on the training dataset and poor on the test dataset.
This can be diagnosed from a plot where the training loss is lower than the validation loss, and the validation loss has a trend that suggests further improvements are possible.
A small contrived example of an underfit LSTM model is provided below.
|
1 2 3 4 5 6 7 8 9 10 11 12 13 14 15 16 17 18 19 20 21 22 23 24 25 26 27 28 29 30 31 32 33 34 35 36 37 38 39 40 |
from keras.models import Sequential from keras.layers import Dense from keras.layers import LSTM from matplotlib import pyplot from numpy import array # return training data def get_train(): seq = [[0.0, 0.1], [0.1, 0.2], [0.2, 0.3], [0.3, 0.4], [0.4, 0.5]] seq = array(seq) X, y = seq[:, 0], seq[:, 1] X = X.reshape((len(X), 1, 1)) return X, y # return validation data def get_val(): seq = [[0.5, 0.6], [0.6, 0.7], [0.7, 0.8], [0.8, 0.9], [0.9, 1.0]] seq = array(seq) X, y = seq[:, 0], seq[:, 1] X = X.reshape((len(X), 1, 1)) return X, y # define model model = Sequential() model.add(LSTM(10, input_shape=(1,1))) model.add(Dense(1, activation='linear')) # compile model model.compile(loss='mse', optimizer='adam') # fit model X,y = get_train() valX, valY = get_val() history = model.fit(X, y, epochs=100, validation_data=(valX, valY), shuffle=False) # plot train and validation loss pyplot.plot(history.history['loss']) pyplot.plot(history.history['val_loss']) pyplot.title('model train vs validation loss') pyplot.ylabel('loss') pyplot.xlabel('epoch') pyplot.legend(['train', 'validation'], loc='upper right') pyplot.show() |
Running this example produces a plot of train and validation loss showing the characteristic of an underfit model. In this case, performance may be improved by increasing the number of training epochs.
In this case, performance may be improved by increasing the number of training epochs.
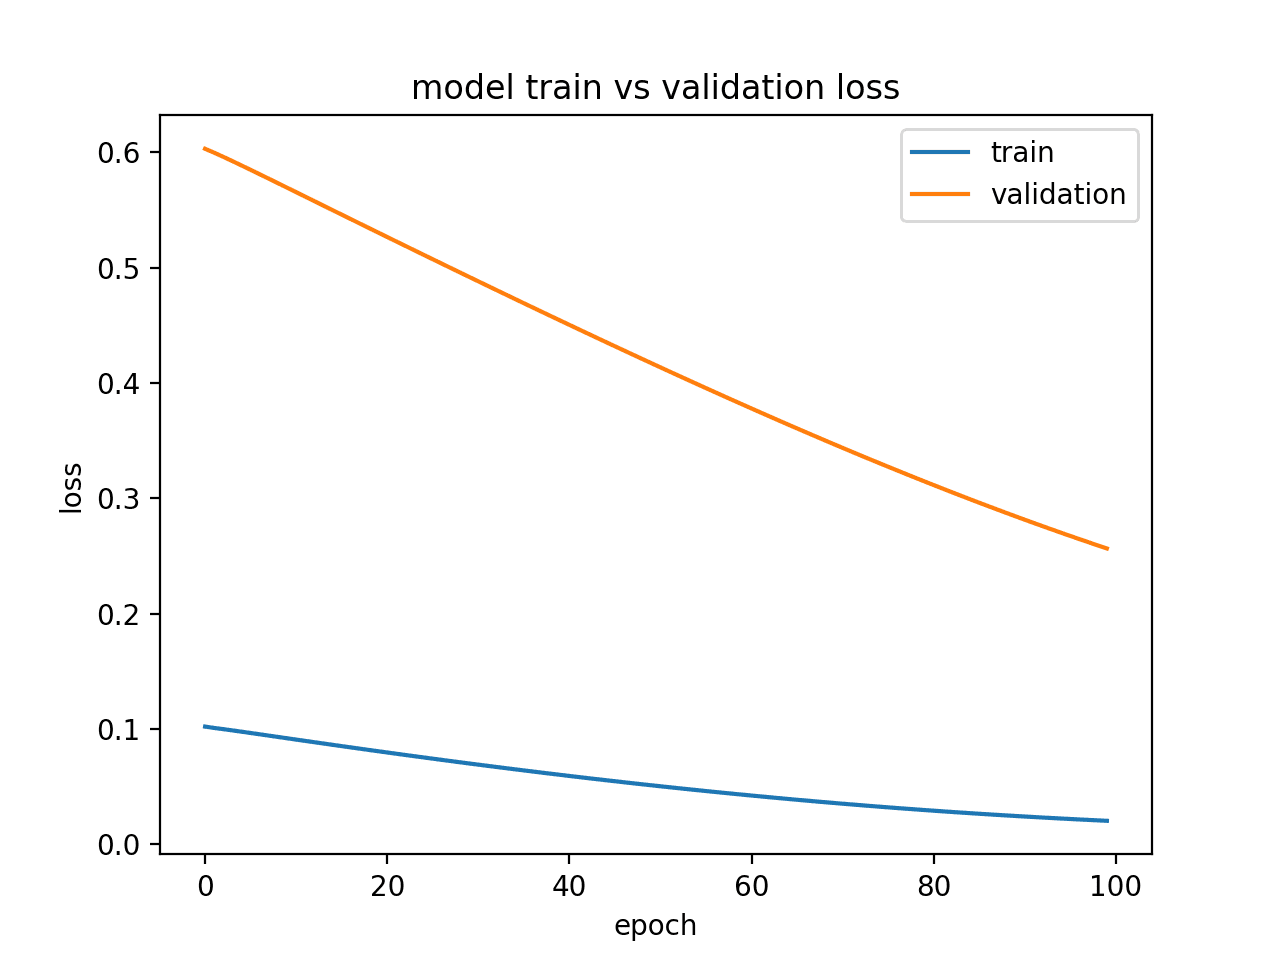
Diagnostic Line Plot Showing an Underfit Model
Alternately, a model may be underfit if performance on the training set is better than the validation set and performance has leveled off. Below is an example of an
Below is an example of an an underfit model with insufficient memory cells.
|
1 2 3 4 5 6 7 8 9 10 11 12 13 14 15 16 17 18 19 20 21 22 23 24 25 26 27 28 29 30 31 32 33 34 35 36 37 38 39 40 |
from keras.models import Sequential from keras.layers import Dense from keras.layers import LSTM from matplotlib import pyplot from numpy import array # return training data def get_train(): seq = [[0.0, 0.1], [0.1, 0.2], [0.2, 0.3], [0.3, 0.4], [0.4, 0.5]] seq = array(seq) X, y = seq[:, 0], seq[:, 1] X = X.reshape((5, 1, 1)) return X, y # return validation data def get_val(): seq = [[0.5, 0.6], [0.6, 0.7], [0.7, 0.8], [0.8, 0.9], [0.9, 1.0]] seq = array(seq) X, y = seq[:, 0], seq[:, 1] X = X.reshape((len(X), 1, 1)) return X, y # define model model = Sequential() model.add(LSTM(1, input_shape=(1,1))) model.add(Dense(1, activation='linear')) # compile model model.compile(loss='mae', optimizer='sgd') # fit model X,y = get_train() valX, valY = get_val() history = model.fit(X, y, epochs=300, validation_data=(valX, valY), shuffle=False) # plot train and validation loss pyplot.plot(history.history['loss']) pyplot.plot(history.history['val_loss']) pyplot.title('model train vs validation loss') pyplot.ylabel('loss') pyplot.xlabel('epoch') pyplot.legend(['train', 'validation'], loc='upper right') pyplot.show() |
Running this example shows the characteristic of an underfit model that appears under-provisioned.
In this case, performance may be improved by increasing the capacity of the model, such as the number of memory cells in a hidden layer or number of hidden layers.
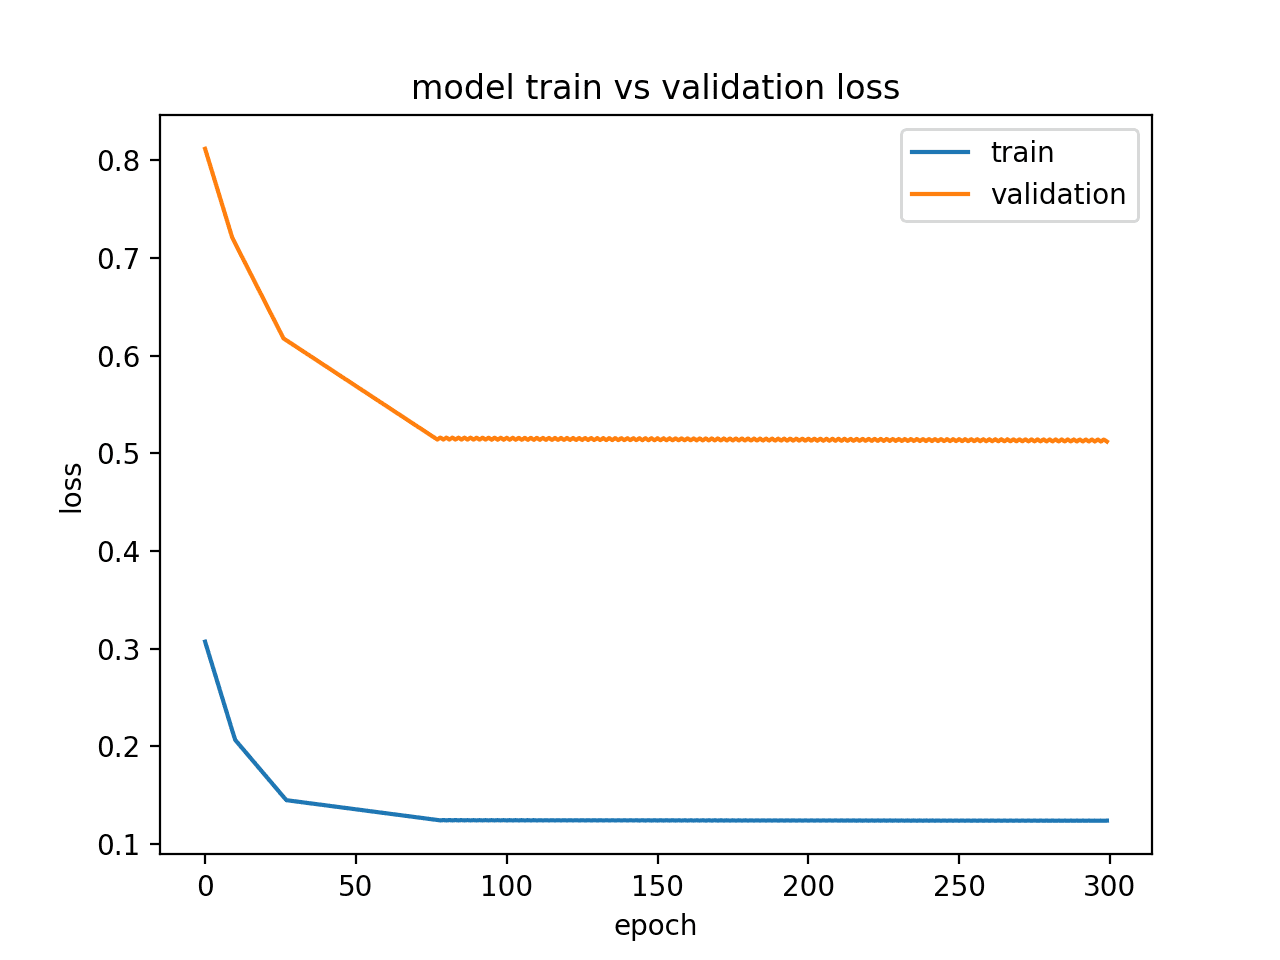
Diagnostic Line Plot Showing an Underfit Model via Status
4. Good Fit Example
A good fit is a case where the performance of the model is good on both the train and validation sets.
This can be diagnosed from a plot where the train and validation loss decrease and stabilize around the same point.
The small example below demonstrates an LSTM model with a good fit.
|
1 2 3 4 5 6 7 8 9 10 11 12 13 14 15 16 17 18 19 20 21 22 23 24 25 26 27 28 29 30 31 32 33 34 35 36 37 38 39 40 |
from keras.models import Sequential from keras.layers import Dense from keras.layers import LSTM from matplotlib import pyplot from numpy import array # return training data def get_train(): seq = [[0.0, 0.1], [0.1, 0.2], [0.2, 0.3], [0.3, 0.4], [0.4, 0.5]] seq = array(seq) X, y = seq[:, 0], seq[:, 1] X = X.reshape((5, 1, 1)) return X, y # return validation data def get_val(): seq = [[0.5, 0.6], [0.6, 0.7], [0.7, 0.8], [0.8, 0.9], [0.9, 1.0]] seq = array(seq) X, y = seq[:, 0], seq[:, 1] X = X.reshape((len(X), 1, 1)) return X, y # define model model = Sequential() model.add(LSTM(10, input_shape=(1,1))) model.add(Dense(1, activation='linear')) # compile model model.compile(loss='mse', optimizer='adam') # fit model X,y = get_train() valX, valY = get_val() history = model.fit(X, y, epochs=800, validation_data=(valX, valY), shuffle=False) # plot train and validation loss pyplot.plot(history.history['loss']) pyplot.plot(history.history['val_loss']) pyplot.title('model train vs validation loss') pyplot.ylabel('loss') pyplot.xlabel('epoch') pyplot.legend(['train', 'validation'], loc='upper right') pyplot.show() |
Running the example creates a line plot showing the train and validation loss meeting.
Ideally, we would like to see model performance like this if possible, although this may not be possible on challenging problems with a lot of data.

Diagnostic Line Plot Showing a Good Fit for a Model
5. Overfit Example
An overfit model is one where performance on the train set is good and continues to improve, whereas performance on the validation set improves to a point and then begins to degrade.
This can be diagnosed from a plot where the train loss slopes down and the validation loss slopes down, hits an inflection point, and starts to slope up again.
The example below demonstrates an overfit LSTM model.
|
1 2 3 4 5 6 7 8 9 10 11 12 13 14 15 16 17 18 19 20 21 22 23 24 25 26 27 28 29 30 31 32 33 34 35 36 37 38 39 40 |
from keras.models import Sequential from keras.layers import Dense from keras.layers import LSTM from matplotlib import pyplot from numpy import array # return training data def get_train(): seq = [[0.0, 0.1], [0.1, 0.2], [0.2, 0.3], [0.3, 0.4], [0.4, 0.5]] seq = array(seq) X, y = seq[:, 0], seq[:, 1] X = X.reshape((5, 1, 1)) return X, y # return validation data def get_val(): seq = [[0.5, 0.6], [0.6, 0.7], [0.7, 0.8], [0.8, 0.9], [0.9, 1.0]] seq = array(seq) X, y = seq[:, 0], seq[:, 1] X = X.reshape((len(X), 1, 1)) return X, y # define model model = Sequential() model.add(LSTM(10, input_shape=(1,1))) model.add(Dense(1, activation='linear')) # compile model model.compile(loss='mse', optimizer='adam') # fit model X,y = get_train() valX, valY = get_val() history = model.fit(X, y, epochs=1200, validation_data=(valX, valY), shuffle=False) # plot train and validation loss pyplot.plot(history.history['loss'][500:]) pyplot.plot(history.history['val_loss'][500:]) pyplot.title('model train vs validation loss') pyplot.ylabel('loss') pyplot.xlabel('epoch') pyplot.legend(['train', 'validation'], loc='upper right') pyplot.show() |
Running this example creates a plot showing the characteristic inflection point in validation loss of an overfit model.
This may be a sign of too many training epochs.
In this case, the model training could be stopped at the inflection point. Alternately, the number of training examples could be increased.
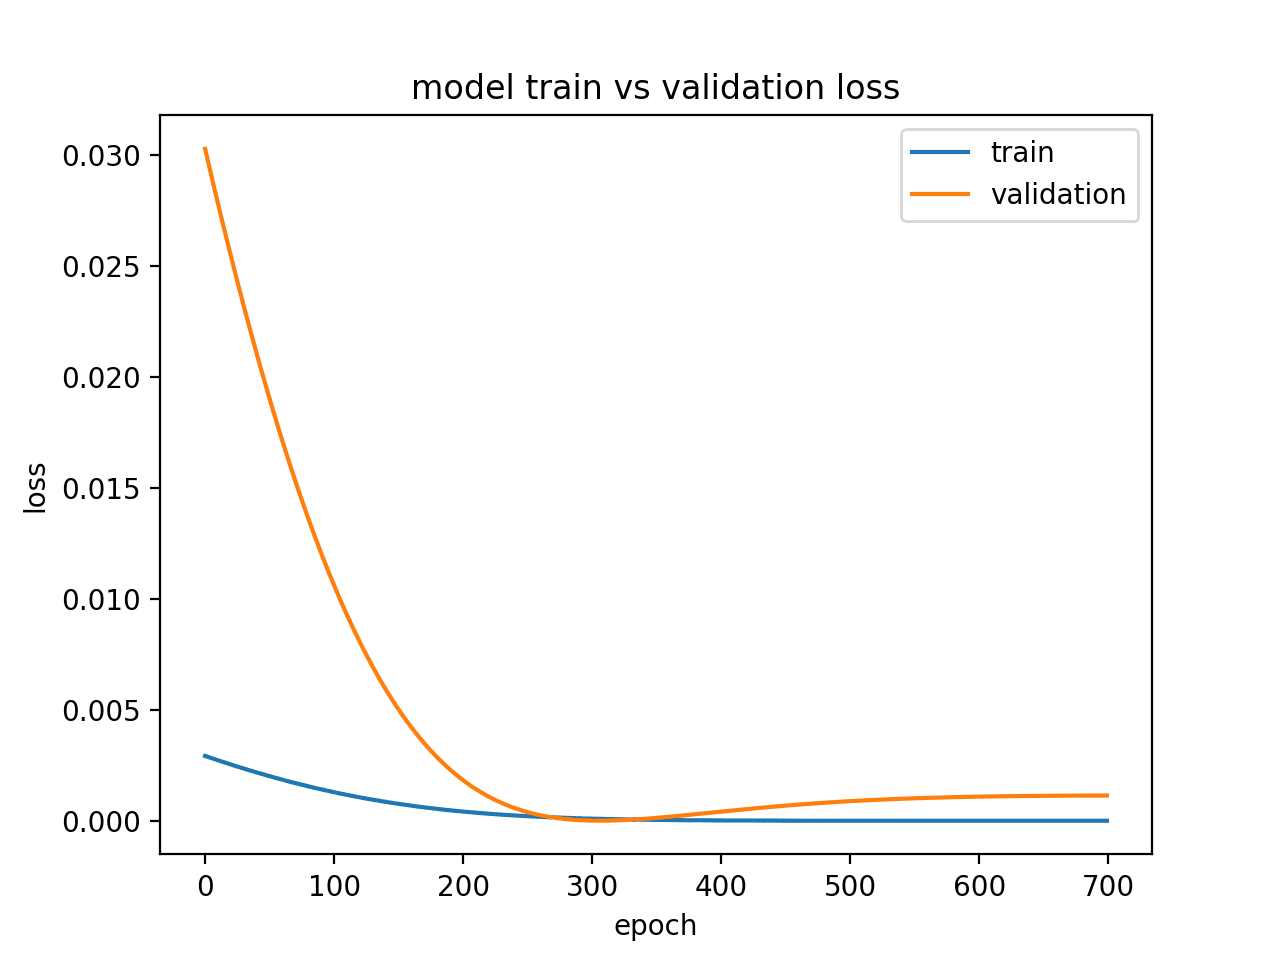
Diagnostic Line Plot Showing an Overfit Model
6. Multiple Runs Example
LSTMs are stochastic, meaning that you will get a different diagnostic plot each run.
It can be useful to repeat the diagnostic run multiple times (e.g. 5, 10, or 30). The train and validation traces from each run can then be plotted to give a more robust idea of the behavior of the model over time.
The example below runs the same experiment a number of times before plotting the trace of train and validation loss for each run.
|
1 2 3 4 5 6 7 8 9 10 11 12 13 14 15 16 17 18 19 20 21 22 23 24 25 26 27 28 29 30 31 32 33 34 35 36 37 38 39 40 41 42 43 44 45 46 47 48 |
from keras.models import Sequential from keras.layers import Dense from keras.layers import LSTM from matplotlib import pyplot from numpy import array from pandas import DataFrame # return training data def get_train(): seq = [[0.0, 0.1], [0.1, 0.2], [0.2, 0.3], [0.3, 0.4], [0.4, 0.5]] seq = array(seq) X, y = seq[:, 0], seq[:, 1] X = X.reshape((5, 1, 1)) return X, y # return validation data def get_val(): seq = [[0.5, 0.6], [0.6, 0.7], [0.7, 0.8], [0.8, 0.9], [0.9, 1.0]] seq = array(seq) X, y = seq[:, 0], seq[:, 1] X = X.reshape((len(X), 1, 1)) return X, y # collect data across multiple repeats train = DataFrame() val = DataFrame() for i in range(5): # define model model = Sequential() model.add(LSTM(10, input_shape=(1,1))) model.add(Dense(1, activation='linear')) # compile model model.compile(loss='mse', optimizer='adam') X,y = get_train() valX, valY = get_val() # fit model history = model.fit(X, y, epochs=300, validation_data=(valX, valY), shuffle=False) # story history train[str(i)] = history.history['loss'] val[str(i)] = history.history['val_loss'] # plot train and validation loss across multiple runs pyplot.plot(train, color='blue', label='train') pyplot.plot(val, color='orange', label='validation') pyplot.title('model train vs validation loss') pyplot.ylabel('loss') pyplot.xlabel('epoch') pyplot.show() |
In the resulting plot, we can see that the general trend of underfitting holds across 5 runs and is a stronger case for perhaps increasing the number of training epochs.
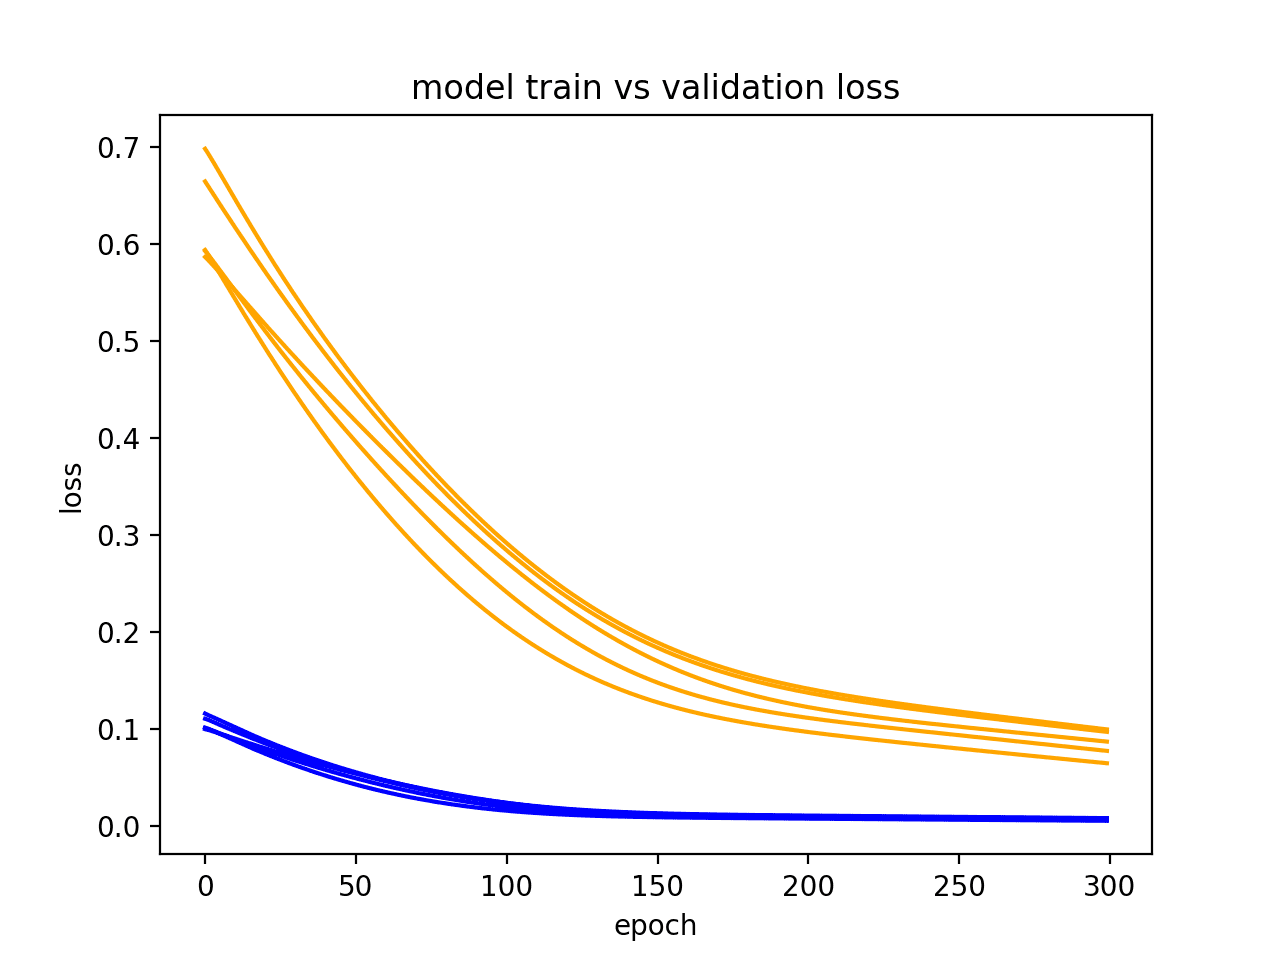
Diagnostic Line Plot Showing Multiple Runs for a Model
Further Reading
This section provides more resources on the topic if you are looking go deeper.
Summary
In this tutorial, you discovered how to diagnose the fit of your LSTM model on your sequence prediction problem.
Specifically, you learned:
- How to gather and plot training history of LSTM models.
- How to diagnose an underfit, good fit, and overfit model.
- How to develop more robust diagnostics by averaging multiple model runs.
Do you have any questions?
Ask your questions in the comments below and I will do my best to answer.
Develop LSTMs for Sequence Prediction Today!

Develop Your Own LSTM models in Minutes
...with just a few lines of python code
Discover how in my new Ebook:
Long Short-Term Memory Networks with Python
It provides self-study tutorials on topics like:
CNN LSTMs, Encoder-Decoder LSTMs, generative models, data preparation, making predictions and much more...
Finally Bring LSTM Recurrent Neural Networks to
Your Sequence Predictions Projects
Skip the Academics. Just Results.


Very useful insight. Thanks for sharing!
Thanks Shiraz
Some good info thanks. Are you sure your x axis units are correct though?
Yes, in one case (Overfit Example) I truncated the data for readability.
Hi Jason!
And what if the loss fluctuates? I get up and down peaks after the second epoch and even with 25 epochs the loss in the validation set is greater than 0.5
Could you give me some clue of what is happening?
Thanks!
Good question.
I would recommend looking at the trends in loss over 10s to 100s of epochs, not over very short periods.
Thank you for posting this informative blog on how to diagnose LSTM models. i will definitely try this nifty trick. Please keep on sharing more helpful tips and suggestions in the upcoming posts.
Thanks. I hope it helps.
What other types of tips would you like me to write about?
Hi, James! Any tips how to detect overfitting without validation set (when I have Dropout layers) ?
(I am beginner at deep learning)
The idea of overfitting the training set only has meaning in the context of another dataset, such as a test or validation set.
Also, my name is Jason, not James.
Hi Jason,
Could a test dataset be used to detect overfitting or underfitting to a training dataset without validation dataset? How to do? Is it different to the method using validation dataset?
Thanks a lot. BTW, your lessons are quite benefit, helpful to study machine learning.
Perhaps, but one data point (as opposed to an evaluation each epoch) might not be sufficient to make claims/diagnose model behavior.
Hi Jason,
Hyper-parameter tuning for LSTMS is something really useful – especially in the context of time-series. Looking forward for a blog-post on this topic..
Best,
Andrei
What would you like to see exactly? What parameters?
I have a few posts on tuning LSTMs.
Thank you for your post Jason.
There is also another case, when val loss goes below training loss! This case indicates a highly non-stationary time series with growing mean (or var), wherein the network focuses on the meaty part of the signal which happenes to fall in the val set.
Great tip, thanks.
Hi Jason!
Thank you for this very useful way of diagnosis of LSTM. I’m working on human activity recognition. Now my plot looks like this https://imgur.com/a/55p9b. What can you advise?
I’m trying to classify fitness exercises.
Great work!
Maybe try early stopping around epoch 10?
In this case my accuracy will be:
Train on 21608 samples, validate on 5403 samples
…
21608/21608 [==============================] – 802s – loss: 0.2115 – acc: 0.9304 – val_loss: 0.1949 – val_acc: 0.9337
Epoch 7/50
21608/21608 [==============================] – 849s – loss: 0.1803 – acc: 0.9424 – val_loss: 0.2132 – val_acc: 0.9249
Epoch 8/50
21608/21608 [==============================] – 786s – loss: 0.1632 – acc: 0.9473 – val_loss: 0.2222 – val_acc: 0.9297
Epoch 9/50
21608/21608 [==============================] – 852s – loss: 0.1405 – acc: 0.9558 – val_loss: 0.1563 – val_acc: 0.9460
Epoch 10/50
21608/21608 [==============================] – 799s – loss: 0.1267 – acc: 0.9590 – val_loss: 0.1453 – val_acc: 0.9606
Epoch 11/50
21608/21608 [==============================] – 805s – loss: 0.1147 – acc: 0.9632 – val_loss: 0.1490 – val_acc: 0.9567
Epoch 12/50
21608/21608 [==============================] – 788s – loss: 0.1069 – acc: 0.9645 – val_loss: 0.1176 – val_acc: 0.9626
Epoch 13/50
21608/21608 [==============================] – 838s – loss: 0.1028 – acc: 0.9667 – val_loss: 0.1279 – val_acc: 0.9578
Epoch 14/50
21608/21608 [==============================] – 808s – loss: 0.0889 – acc: 0.9707 – val_loss: 0.1183 – val_acc: 0.9648
Epoch 15/50
21608/21608 [==============================] – 785s – loss: 0.0843 – acc: 0.9729 – val_loss: 0.1000 – val_acc: 0.9706
After 50 epochs accuracy:
Epoch 50/50
21608/21608 [==============================] – 793s – loss: 0.0177 – acc: 0.9950 – val_loss: 0.0772 – val_acc: 0.9832
Also I didn’t use dropout and regularization.
One of my class (rest) have much more samples than other (exercises) https://imgur.com/a/UxEPr.
Confusion matrix – https://imgur.com/a/LYxUu.
I use next model:
model = Sequential()
model.add(Bidirectional(LSTM(128), input_shape = (None,3)))
model.add(Dense(9, activation=’softmax’))
model.compile(loss=’categorical_crossentropy’, optimizer=’rmsprop’, metrics=[‘accuracy’])
mcp = ModelCheckpoint(‘best_model_50_epochs.hd5’, monitor=”val_acc”,
save_best_only=True, save_weights_only=False)
history = model.fit(X_train,
y_train,
batch_size=32,
epochs=50,
validation_split=0.2,
callbacks=[mcp])
And I tried dropout:
model.add(Bidirectional(LSTM(128, dropout=0.5, recurrent_dropout=0.5), input_shape = (None,3)))
train_loss vs val_loss – https://imgur.com/a/k5TVU
accuracy on 50 epochs:
loss: 0.2269 – acc: 0.9244 – val_loss: 0.1574 – val_acc: 0.9558
Hi Jason! What can you advise to increase accuracy, when I have multi classes and one class takes 50% of samples?
(I showed my model above)
Thank you!
I have ideas here:
https://machinelearningmastery.com/improve-deep-learning-performance/
Activation, batch_size (I noticed it correlates with the test size but not always), loss function, number of hidden layers, number of memory cells, optimizer type, input series history length (https://machinelearningmastery.com/multivariate-time-series-forecasting-lstms-keras/)
For all of these parameters I do trial/error testing. Would be nice to know if there is a more systematic way to find the best parameters.
I do much the same myself Andrei. I design a few days worth of runs in a spreadsheet then kick them off to see “what the problem looks like”:
https://machinelearningmastery.com/plan-run-machine-learning-experiments-systematically/
There are some non-LSTM specific ideas for systematically tuning mini-batch gradient descent algorithms here and in the referred paper (e.g. what to test first, second, third, etc.):
https://machinelearningmastery.com/gentle-introduction-mini-batch-gradient-descent-configure-batch-size/
Thank you, Jason! Great work with your blog!
Thanks Andrei!
Hi Jason,
Great post to for us to know how to diagnose our program! I have been playing with RNNs for a while now. And i started by reading your previous posts. They were great for beginners to start off with!
Now as i want to go into more advanced level, i hope i could get your insights/summary on more interesting recent/state-of-the-art models like WaveNet, Deep Speech, using Attention with keras, etc.
Thanks!
Sure, what do you want to know?
Hi Jason,
thank you for this very useful and clear post.
I have a question.
When we set validation_data in fit(), is it just to see the behaviour of the model when fit() is done (this is what i gues!), or does Keras use this validation_data somehow while optimizing from epoch to another to best fit such validation_data? (This is what I hope :-))
I usually prepare three disjoint data sets: training data to train, validation data to optimize the hyper-parameters, and at the end testing data, as out-of-sample data, to test the model. Thus, if Keras optimizes the model based on validation_data, then I don’t have to optimize by myself!
Validation data is only used to give insight into the skill of the model on unseen data during training.
Hi Jason,
Why accuracy value always are 0s when I regress? Loss values decreased. What is the reason for this? Thank you.
model.compile(optimizer=’adam’, loss=’mse’, metrics=[‘mean_squared_error’, ‘accuracy’])
We cannot measure accuracy for regression. It is a measure of correct label predictions and there are no labels in regression.
Hello,
Thank you for your helpful posts.
Is overfitting always solvable?
In other words, what are the necessary and sufficient conditions for a data to be trainable?
Maybe we have enough data, but because data is not trainable, we have overfit.
This is an open problem and specific to each dataset.
I list a ton of empirical tricks to try for a given problem here:
https://machinelearningmastery.com/machine-learning-performance-improvement-cheat-sheet/
Hi Jason,
Thanks for your great and useful post.
I have a kind of weird problem in my LSTM train/validation loss plot. As you can see here [1], the validation loss starts increasing right after the first (or few) epoch(s) while the training loss decreases constantly and finally becomes zero. I used drop-out to deal with this severe overfitting problem, however, at the best case, the validation error remains the same value as it was in the first epoch. I’ve also tried changing various parameters of the model but in all configuration, I have such a increasing trend in validation loss. Is this really an overfitting problem or something is wrong with my implementation or problem phrasing?
[1] https://imgur.com/mZXh4lh
You could explore models with more representational capacity, perhaps more neurons or more layers?
I tested several layers and also a different number of neurons in each layer but again in many tests I see the same increasing trend for validation loss after few epochs.
Perhaps try changing more other aspects like optimization algorithm, learning rate, batch size, and so on, see here:
https://machinelearningmastery.com/improve-deep-learning-performance/
Hi, Jason.I’m quite shocked by your posts. I’m facing a hard situation where validation loss >>
training loss when using LSTM so I googled it . Here https://github.com/karpathy/char-rnn/issues/160 and here https://www.reddit.com/r/MachineLearning/comments/3rmqxd/determing_if_rnn_model_is_underfitting_vs/ they suggested that this can be overfitting. But in your posts, this should be underfitting. I’m confused, can you explained it ?
Hi Cliff : I think that Jason made a mistake with the titles. In the title od Underfitting he is explaining Overfitting.
I think this is a better tutorial on the topic:
https://machinelearningmastery.com/learning-curves-for-diagnosing-machine-learning-model-performance/
Thanks for the good article i want to compare it with other tip and trick to make sure there is no conflict.
– Here you say:
Underfit: Training perform well, testing dataset perform poor.
– In other tip and trick it say:
Overfit: Training loss is much lower than validation loss
Is both tips are the same with different diagnostic ? since perform well should mean loss is low
Hi Jason,
There is something that I did not understand from ‘3. underfit’ example. The graph of the first example in this section shows the validation loss decreasing and you also vouch for loss to decrease even further if the network is trained even more with more epochs. How is it possible that the network will give correct prediction on data sequences that it has never seen before. Specifically how can learning on sequences from 0.0 to 0.5 (data from get_train() function) improve prediction on 0.5 to 0.9 (data from get_val() fucntion)
And other thing i want to mention is i have been reading posts on your blog for a month now though commenting for the first time and I would like to tha k you for the persistent content you’ve put here and making machine learning more accessible.
Good question, in the ideal case the model will generalize from examples.
Thanks for your support!
I did not get that Jason, could you please elaborate a bit. Thanks!
Hi Jason,
I tested the underfit example for 500 epochs, and I mentioned the ” metrics = [‘accuracy’] ” in the model.compile functions but when I fit the model , the accuracy metrics was 0 for all 500 epochs. Why accuracy is 0% in this case ?
Perhaps your model has very poor skill?
What do you mean by poor skill ? I tested this blog example (underfit first example for 500 epochs , rest code is the same as in underfit first example ) and checked the accuracy which gives me 0% accuracy but I was expecting a very good accuracy because on 500 epochs Training Loss and Validation loss meets and that is an example of fit model as mentioned in this blog also.
Sorry for the confusion, model skill refers to the model’s ability to make high-quality predictions.
I tested the good fit example of this blog and its also giving me 0 % accuracy. If a good fit model gives 0% accuracy, we have nothing to tune its accuracy because it is already good fit. However, good fit model should give very high quality predictions. I think you should check yourself accuracy of good fit example of this blog and please give some comments on it to clear the confusion.
There is no accuracy in the examples we are working with a contrived regression problem (not classification) and evaluating loss only.
You can learn more about why you cannot evaluate regression using accuracy here:
https://machinelearningmastery.com/classification-versus-regression-in-machine-learning/
Hi,
great article, thank you!
Two short question:
1) The way you designed the code, the states will not be reseted after every epoch which is a problem. Is there a way to include model.state_reset without training the model.fit for only one epoch in a for loop? So basically:
model.fit(X,y, epochs = 100, validation_data = (valx, valy), shuffle = FALSE, stateful = TRUE, state_reset= TRUE) or something like that?
2) If that is not possible, how can I imitate the same behavior? Would it be something like?
for i in range(epos):
model.fit(X,y, epos=1, stateful=true)
yhat_t = model.predict(train, …)
yhat_val = model.predict(val, …)
train_error = msqrt_error(y, yhat_t)
val_error = msqrt_error(y, yhat_val)
model.state_reset()
I just want to plot the error and accuracy development over the epochs
Thanks!
To manage state you must execute the epochs manually one at a time in a loop.
Is it available also for DecisionTreeClasfier ?
Perhaps.
Hi Dr Brownlee,
I’m working on a classification problem using CNN layers, however I’m getting strange loss curves for training and validation. Training loss decreases very rapidly to convergence at a low level with high accuracy. My validation curve eventually converges as well but at a far slower pace and after a lot more epochs. Thus there is a huge gap between the training and validation loss that suddenly closes in after a number of epochs.
I am using Keras/ Tensorflow Architecture is Conv + Batch Normalization + Convo + Batch Normalization + MaxPooling2D repeated 4 times, my CNN is meant to classify an image as one out of around 30 categories. I have more details posted on the following stack exchange
https://stats.stackexchange.com/questions/335890/how-do-i-interpret-my-validation-and-training-loss-curve-if-there-is-a-large-dif
Do you have any insights into what the problem may be for this situation?
Perhaps the model is underspecified? Explore larger models to see if it makes any difference.
Hello Jason.
Thank you for this. I’m working on machine translation using LSTM. Now my plot looks like this https://imgur.com/a/i2dOB87 . What can you advise?
I’m trying to improve acc.
I’m using 4 Layer in encoder and decoder.
Here , the basic implementation.
………………………….
Encoder:
encoder1 = LSTM(lstm_units, return_state=True , return_sequences = True , name = ‘LSTM1’)
encoder2 = LSTM(lstm_units, return_sequences=True, return_state=True , name = ‘LSTM2’)
encoder3 = LSTM(lstm_units, return_sequences=True, return_state=True , name = ‘LSTM3’)
encoder4 = LSTM(lstm_units, return_state=True , name = ‘LSTM4’)
encoder_outputs4 , state_h4 , state_c4 = encoder4(encoder3(encoder2(encoder1(embedded_output))))
………………………………
Decoder:
decoder_lstm1 = LSTM(lstm_units, return_sequences=True, return_state=True , name = ‘Dec_LSTM1’)
decoder_lstm2 = LSTM(lstm_units, return_sequences=True, return_state=True , name = ‘Dec_LSTM2’)
decoder_lstm3 = LSTM(lstm_units, return_sequences=True, return_state=True , name = ‘Dec_LSTM3’)
decoder_lstm4 = LSTM(lstm_units, return_sequences=True, return_state=True , name = ‘Dec_LSTM4′)
decoder_outputs4 , _, _ = decoder_lstm4(decoder_lstm3(decoder_lstm2(decoder_lstm1(embedded_Ar_output,
initial_state=encoder_states4))))
decoder_dense = Dense(output_vector_length, activation=’softmax’)
decoder_outputs = decoder_dense(decoder_outputs4)
*lstm_units : 500
*epochs : 200
………………………..
fit model part:
#Compile Model
model.compile(loss=’mse’, optimizer=’adam’ , metrics=[‘acc’] )
#Train and fit model # Learning!
history = model.fit([dataset_encoder_input, dataset_decoder_input], target ,
batch_size=batch_size,
epochs=epochs,
validation_split=0.2)
*batch_size = 512
Nice work, here are some general ideas to try:
https://machinelearningmastery.com/improve-deep-learning-performance/
Hi, Jason, thanks for your website, it’s amazing …
A question, exists in python (I am new in python) a “package” like a Caret in R, where I can with a few steps train an LSTM model (or other deep learning algorithms), that find parameters or hyperparameters (I give it a vector ), scale (or preprocess the data) and validation or cross validation simultaneously?
the objective is not to make so many lines of command and to combine the search for optimal parameters or hyperparameters.
Are you asking about grid searching LSTMs?
If so, here is an example of grid searching with a Keras model that you could adapt:
https://machinelearningmastery.com/grid-search-hyperparameters-deep-learning-models-python-keras/
Hi Jason!
Awesome post with great plots. Do these methods of evaluating overfitting vs. underfitting generalize to models other than LSTM, e.g. feedforward neural network or CNN?
Yes.
Thank you!
Hey Jason, first of all thanks for the post, all your posts are extremely useful. Anyway I am slightly confused by the second plot in section 3: underfit model. Is this not over fitting here? The model has low loss on the training error but high loss on the validation set i.e. not generalizing well? The recommendation you have in this case is to increase the capacity of the model, but would this not just improve the fit on the training set and hence widen this gap between val and training loss? Cheers, Mike
Note the lines start and remain far apart. This is the signal we are looking for when underfitting.
Dear Jason,
I am using a LSTM to predict some timeseries data.
Here is my model with early stopping.
https://photos.app.goo.gl/WuPELturhc8Z4JbP9
And here it is running for 100 epochs.
https://photos.app.goo.gl/p1h4PQdC1CE6wJHq8
Is this looking okay, am I overfitting? I am wondering why the validation loss is smaller than training loss in the beginning?
Many thanks for your help, and giving us this all this great work.
Does not really look like overfitting to me.
Hi Jason,
It is a very useful article. In the example, only one value is forecasts. For time series prediction, it may need to forecast several values: t, t+1 … t+n. Do you know how history[‘loss’] and history[‘val_loss’] are calculated please? Or if there are other metric which we can refer to please?
Thanks in advance.
I recommend this tutorial:
https://machinelearningmastery.com/multi-step-time-series-forecasting-long-short-term-memory-networks-python/
Thanks a lot for reply.
I have read this tutorial you mentioned before. Do you mean to create own function such as evaluate_forecasts(…) to calculate t+i rmse for each epoch, and then plot the rmse vs epoch?
Did the tutorial not help?
Hi Jason,
Yes, the tutorial you mentioned helps, but I want to make sure if I understand you correctly.
My question was how to plot train loss and validation loss for time series prediction t+1 … t+n. I just wonder if history[‘loss’] and history[‘val_loss’] are only for t+1, or they are the mean of t+1 … t+n. Is there other metric for this purpose?
If there is no metric in history to measure train loss and validation loss for t+1 … t+n. Do I need to create an own function such as evaluate_forecasts(…) to calculate t+i rmse for each epoch?
Thanks in advance.
Sorry, now I understand.
There is no concept of loss at different time steps during training, the model calculates loss based on the output vector given an input.
If you want to know error of each future time step during training, you can step through training epochs manually one by one, calculate the error and plot all errors at the end of the run.
Hello Mr. Jason, glad to read your article, it helps me a lot. After read posts between Mr. MLT and you. I got another question, if “There is no concept of loss at different time steps during training, the model calculates loss based on the output vector given an input.” what is the point of “loss: 0.0662” in every training Epoch. Sorry I want to understand you properly.
Loss is the model score being minimized, it is specific to the type of problem, such as MSE for regression or cross-entropy for classification.
Hi Jason,
I’m trying to make LSTM model.
Below is my model code and the result.
The model is over-fitting but I’m not sure how to converge this model. I changed my variable scaling with the help of this post still I am getting the same result :
https://machinelearningmastery.com/improve-deep-learning-performance/
Code:
model = Sequential()
model.add(LSTM(66, input_shape=(train_X.shape[1], train_X.shape[2])))
model.add(Dropout(.5))
model.add(Dense(1))
model.compile(loss=’mae’, optimizer=’Adam’)
# fit network
history = model.fit(train_X, train_y, epochs=30, batch_size=66, validation_data=(test_X, test_y), verbose=2, shuffle=False)
Result.
https://drive.google.com/file/d/1Byos8d1wVAopqGydYLnpUDgkRqUCbPxS/view?usp=sharing
Could you Please help me understand what I am missing.
I’m happy to answer technical questions, but I cannot review your code for you, sorry.
Hi Jason
what should I thing If I have a good training loss and accuracy line and a divergent line in test?
as for loss think of an X:
from up left, to down right for training
from down left, to up right for test
thanks,
g
I’m not sure I follow, perhaps link to a picture of your graph?
Hello Jason,
Thank you for your great tutorials and books (my friend and I have purchased the NLP bundle and it has been a great help).
I understand that a Good fit means that Validation error is low, but could be equal or slightly higher than the training error.
My confusion is: how much difference would be considered okay and not mean overfitting?
e.g if in the last epoch train loss = .08 and val_loss= .11 is this an indication of overfitting or not?
It really depends on the problem. There is no general rule.
Overfitting is clear if performance continues to get better on the training set and starts to get worse on the test or validation sets.
Hello! First of all, thank you for explaining this overfitting and underfitting concept. This is very helpful, considering how thoroughly explained the steps are. But, if I may ask, do you have any concrete sources (or online journals will do) regarding to how you decided which model’s deemed as the underfitted/overfitted one? If you may, will you please include it in the post? Thank you so much, I’ll be looking forward to your response!
Not off hand, what are you looking for exactly?
Oh! I’m sorry if it sounds confusing. But I’m looking for any journals/books/papers I can use to decide if a model’s considered overfitted, undefitted, or fitted. If you know any, can you please let me know? Thank you.
Perhaps search here:
http://scholar.google.com
Hi Jason,
I am trying to build a model with my own time series data using your tutorial
https://machinelearningmastery.com/multivariate-time-series-forecasting-lstms-keras/
I can’t even get the train curve to go below 0.05. So its not an overfitting or underfitting problem. What should I look for?
Generally, LSTMs are terrible at time series forecasting. Perhaps start with a linear model, then try an MLP, then CNN, then eventually an LSTM.
I recommend this process:
https://machinelearningmastery.com/how-to-develop-a-skilful-time-series-forecasting-model/
Hello Jason!
I am working on EEG dataset for classification purposes. The dataset consists of raw EEG signals of 65000x14x320 (sample X eegchannels X timesteps) as input data and labeled with 11 classes. The timesteps are not fixed but vary from 130-320. So I chose to zeropad them all to 320.
Since data is sequential I opt to train them with LSTM in keras. Tried to play with various hyperparameters but all in vain. The model is not learning at all. The accuracy always hovers along 1/11, i.e no better than random.
Any advice for handling EEG data in deep learning?
Generally, I recommend this process when getting started:
https://machinelearningmastery.com/how-to-develop-a-skilful-time-series-forecasting-model/
I have one example of working with EEG data here:
https://machinelearningmastery.com/how-to-predict-whether-eyes-are-open-or-closed-using-brain-waves/
Also, some of these tutorials will help:
https://machinelearningmastery.com/start-here/#deep_learning_time_series
Hello, Jason!
First off, your tutorials have always been a great help!
Secondly, I’m currently working with an ANN for which my validation loss is better then my training loss (my metric is mae). I’ve concluded that its an under-fit. However, no amount of hyper parameter tuning is fixing this. I’v tweaked everything from epochs to hidden layers and number of neurons per layer. Any advice on how to possibly handle this?
Thanks!
It may also be the case that the validation dataset is too small or not representative?
Try changing it, using a large validation set?
Hi Jason
Thanks for the article.
We have a seemingly unusual problem with a prototype model we’re developing for comment analysis. Im using a Keras (Tensorflow layers) LSTM Model.
We’re using the tensorflow.js framework in production. And have developed a deployment and training platform with a UI.
The UI includes plots of the training summary coming back from the model.
We recently trained a model which is supposed to infer on quite a simple (but specific) semantic rubric which may explain what’s coming next.
We trained a model which is showing 99% accuracy (!) on unseen test data. This percentage is based on us programmatically counting the binary classifiers predictions as a response to new predictions. We are not reading back the validation accuracy or accuracy from the model.
For all intensive purposes the model IS 99% accurate compared to our human labels on this new test data. We are then measuring precision for both 0 and 1 scores and are getting close to this aggregate average on each (99 precision on 0, 98 precision on 1)
A) this seems wierd .. even though as i said we are testing the results independantly
B) The plot of the summary shows the validation error rising above the training error significantly at about epoch 30, we are training up to epoch 100 with 81 LSTM units.
When we train to training and validation error convergance we end up with a markedly less accurate model
Wondering about your thoughts on this?
Thanks
Dan
Wow, tensorflow.js in production? Why not the Python version?
Perhaps the validation dataset is small or not representative of the training dataset and in turn the results are misleading?
Also, loss is the best measure of overfitting, accuracy often remains flat with an overfit model in my experience.
Hi Jason!
I’m trying to apply this to a code similar the one in your electric power prediction tutorial.
But when I try to use the validation_split I get nothing in the history, it contains nothing. history.keys is empty.
the shape of my training data is (1.10.3), can this be the reason for my problems? That “the first shape” is 1 so it cannot be split?
Thank you for awesome tutorials!
It is challenging to use a validation dataset with time series because we often use walk-forward validation.
You might need to run the validation evaluation manually and build your own graph.
Hello, Thanks for sharing. Can I ask you how to detect overfitting on Logistic regression and Knn ? There is much information about how to avoid overfitting but I couldn’t find any proper information which explains how to detect overfitting?
Yes, you could calculate model performance on a validation dataset, e.g. a learning point instead of a learning curve.
Perhaps average results over multiple folds.
Is there any numerical metric to do the same rather than looking at the plots ?
There may be, not that I’m aware.
Hi Jason,
I was just wondering if the graphs described in the website (to diagnose under fitting and over fitting) also apply to other ML models such as multilayer perceptrons … Thanks !
The sure do!
See this post:
https://machinelearningmastery.com/learning-curves-for-diagnosing-machine-learning-model-performance/
Hi Jason,
I have trained my LSTM model (Single time) and observed some good results during prediction.
please see the link below related to Loss & Accuracy
Link 1 :
https://i.imgur.com/YHzJGdl.png
After that based on your post I have tried my LSTM model for Multiple Runs up to 5 iteration. (lstm’s are Stochastic)
please see the link for multiple run
https://i.imgur.com/r4YAgtu.jpg
Questions :
What can i understand from the multiple run image ?
Whether my model is not good ?
If not, how can i improve it kindly share some blog to improve the model in such cases ?
Looks a little overfit, perhaps try regularization.
See here for ideas:
https://machinelearningmastery.com/start-here/#better
Hello Jason,
I have used 2 Drop out layers of 10%, just to regularize my model. Since I have only 2200 parameters in my model, the usage of drop outs results only limited amount of data to be learnt.
So on avoiding the drop out, i can get my loss & val_loss follows a pattern.
please see the image in below link…
https://imgur.com/I2JxyXD
Kindly comment whether the process i have followed is correct
I recommend testing a suite of interventions to see what works best for your specific problem.
Also your link does not work.
hi can you text me i have plot dont like this when i try to train my model can you help me
Perhaps this tutorial will help:
https://machinelearningmastery.com/learning-curves-for-diagnosing-machine-learning-model-performance/
I created one model for predicting the CPU usage using RNN. I used the dataset from Materna, My validation and training loss is 0.0095 and 0.0057, This is the plot, Is my model good enough or it is indicating High Variance or Bias
Good performance is relative.
Perhaps compare the results to a naive or linear model.
hey Jason, first of all thanks for the post, all your posts are extremely useful.
i created my LSTM model about students interaction with videos, I used l2,droupout to reduce overfitting, but when i plot val and tain loss, i have confuse about the plot.
Please, can you help me to Distinguish the plot.
this link of plot photo…
thankyou so much
https://imgur.com/Vj5fGrW
Thanks.
Looks like the model has “good” fit. Perhaps try other configs to confirm it is not underfit.
Thanks for the post Jason.
I have some questions about LSTM:
1. Currently, I am using Tensorboard to visualize each epochs acc and loss (both train and validation). Does Tensorboard produce the same plot as your code? I am beginning to think whether to keep using Tensorboard or not
2. My dataset is pretty big (around 4.7 millions of data) and I intend to empirically test which one will have better performance between 3, 5, 7, 9, and 11 sequence length (I will refer to them as windows). The label 0 or 1 will be applied to each window, and most likely will cause imbalanced dataset because the label 1 most of the time is assigned to small amount of windows. I have undersampled and intended to use class weighting to balance them.
When I tested a window with 7 sequence length, I couldn’t achieve good accuracy without sacrificing recall (I’m guessing this is due to the imbalanced dataset nature and the weights associated). The accuracy seem to stuck in +-60% and the recall is almost always lower (whenever recall is more than 60%, the accuracy is lower).
I checked the Tensorboard and there seems to be some funky fluctuation in val accuracy and val loss in each epoch (some posts on the internet said that this is because of the mini batch size I used in Keras, I am using batch_size=2000). Then I checked the confusion matrix and showed even more sadder results, my model predicted class 0 for 53% of the time and label 1 for 47% of the time, thus creating a recall that is more than 50% (I think this means my model undervalued class 0 and overvalued class 1).
Naturally, this leads to these questions:
2a. What is the size of an ideal batch_size? Will this impact my model?
2b. I learnt that to create a deep learning model, one should start simple. I started with pretty simple architecture LSTM(32)-FC(16)-FC(2) with the last layer using softmax. How do I know when to increase the neuron or when to increase the layer? And more importantly, how do I know that my model won’t be getting better even if I increased the capacity?
2c. In my last experiment, I tried using dropout to make my model perform better (even though I am not sure when should I say my model is good). One thing I noticed is that the placement of dropout (and the rate to drop) affects my model pretty hard. It may cause my model to only predict class 0 (resulting 94% accuracy with 0% recall). Sometimes, this also happens when I tried combination with L2 regularization. Do you have any gist or guide to fine tune this case?
I am very sorry if these questions are long and took a lot of your time. I am looking forward for your response. Thank you very much Jason.
Hi Omar, well done on your progress!
Perhaps move away from accuracy, and given your interest in precision/recall, consider optimizing F-measure (F1).
Sorry, I don’t know about tensorboard.
Test different batch sizes to discover what works best for your model + data.
More on configuring networks here (ie. there are no reliable rules):
https://machinelearningmastery.com/faq/single-faq/how-many-layers-and-nodes-do-i-need-in-my-neural-network
Not off the cuff, sorry.
Thanks for your response.
Given the circumstances to use F1, does Keras support backpropagation by evaluating F1 score of each epoch?
and also, I read in your post (https://machinelearningmastery.com/use-dropout-lstm-networks-time-series-forecasting/) to use dropout in LSTM. What is the difference between:
model.add(LSTM(n_neurons, batch_input_shape=(n_batch, X.shape[1], X.shape[2]), stateful=True, dropout=dropout))
and
model.add(LSTM(n_neurons, batch_input_shape=(n_batch, X.shape[1], X.shape[2]), stateful=True))
model.add(Dropout(dropout))
Thanks.
No, you would fit with cross entropy loss, probably with a class weighting, but perform model selection via F-measure scores.
Great question. Dropout within the timesteps vs dropout after the end of the sequence.
Great, thanks Jason!
You’re welcome.
Dear Jason, sorry to ask you more question. Could you take a look at this image?
https://imgur.com/JLMyYgD
Some of my LSTM models show this kind of graph for val_loss per epoch (I tried 50 epochs, with Keras early stopping using patience=15). From what I understand, this image shows my overall validation loss is decreasing (with decreasing trend). Do you think I need more epochs?
Many thanks Jason.
It does look like learning could continue. Perhaps try it and compare the model at early stop time (save via a checkpoint) vs the model after more learning?
I will try it then. Currently, I tried combinations of LSTM units, FC neurons, L2 values, and Dropout values, ran each combination 5 times and produced 100 different models from using Keras EarlyStopping and Restore Best Weight (50 epochs and 15 patience). Should I re-run every model using more epochs (e.g. 100 epochs) and more patience? I intend to try them with 7 different sequence length so that I will have 700 models.
Thank you Jason.
Perhaps test and compare the results?
Hi Jason
thanks for this post.
I have a question.
My training accuracy is increasing but the validation accuracy decreases eventually.
same way, the training loss is decreasing eventually but validation loss is increasing.
can you tell the reason .And how to make it better.
I have text data . i am using bilstm layer in model.
It sounds like you are overfitting.
Perhaps one of these methods will help:
https://machinelearningmastery.com/introduction-to-regularization-to-reduce-overfitting-and-improve-generalization-error/
Hi Jason, I am working on classifying human activity with features extracted from videos.
It is a multiclass problem. Basically I organized the train_data by video segments where each segment has a label and I split the data into train and validation data 75-25%.
I am using LSTM to train with dropout. So far my training accuracy can go up to 90% with epoch=60 but validation accuracy remains at 38%.
Observations: Training accuracy continues to improve but validation accuracy stops improving and seems to level from epoch 18 to end of the training, ie. epoch 60. This does not seem to me is an underfit since training accurate can continue to improve. But I cannot decide that it is an overfit too, as the validation accuracy remains at 38%.
I think the way forward is to add dropout to regularise the overfit so that the weights learnt better to reduce the validation loss. Am I in the right direction?
Any suggestions that can help to improve the validation accuracy and what else can I try to better narrow down the problem?
Well done on your progress!
Perhaps try some of the suggestions here:
https://machinelearningmastery.com/improve-deep-learning-performance/
Hi!
So, I split my dataset into three parts: train, validation, and test.
On fit, I used to use the train data, then call model.evaluate with train data and after that I call model.evaluate(to get the score) on validation data. Finally, after that, I train the model with all data and then I call model.evaluate on test data with the model all fitted.
My question is where should I use validation_data? Should I use model.evaluate after with the same data that I use for validation_data? Or should I only use model.evaluate on the test data and not on validation data?
Another question that I have is when I fit the model for all data, I should not use the validation_data right? My doubt basically is if is enough to rely on the validation data since after the improvements made on the validation set can still lead to overfitting or underfitting on the test set.
Thanks in advance!
Typically validation data is used to monitor the performance during training and stop training as soon as the model starts to overfit.
This can be done using early stopping callback:
https://machinelearningmastery.com/how-to-stop-training-deep-neural-networks-at-the-right-time-using-early-stopping/
Very useful !! Thank you
Thanks, I’m happy to hear that.
what’s kind of problem if train test it’s higher than validation test? thank you. your blog it’s very useful
Train loss > Test loss, in that case the test set might be too small and not representative of the problem.
Hi Dr.
In case we fit an LSTM model multiple times with different sets of data (in a cycle), how you suggest identifying if the model is overfitting?
Should we analyze each plot from each fit or is reliable in that case if we calculate the mean of each loss and val_loss ?
Case 1:
for x,y in dataset:
history = model.fit(x, y, epochs=nrEpochs, validation_split=0.33, …)
#make the plot inside the cycle
Case 2:
loss = []
val_loss = []
for x,y in data
history = model.fit(x, y, epochs=nrEpochs, validation_split=0.33, …)
loss.append(history.history[‘loss’])
val_loss.append(history.history[‘val_loss’])
#make the plot outside the cycle.
Thanks, your blog is amazing!
Try to construct learning curves, and if you cannot, then look at train vs val/test performance as a point value.
Awesome Jason
Thanks!
Hi Dr.
Sorry to bother. I have a LSTM that quickly gets a high accuracy (99%). However, i think is too good to be true.
I don’t think that the model is overfitting that much. Can I ask for your opinion?
It is normal that “good” results ?
https://ibb.co/bNtGmr0
Thanks in advance!
Good question, I think this will help:
https://machinelearningmastery.com/faq/single-faq/what-does-it-mean-if-i-have-0-error-or-100-accuracy
Hi Jason,
I have multiple scenarios of 500 samples each. I would like to split them up into training and test. All of this samples should stay toguether. Only the order should be mixed and splitted.
I thought that by doing train_test_split would work but it mixes them.
#Import dataset
dataset_train = pd.read_csv(‘Labeled_data.csv’)
#D array
n_samples = 500
init = 0
data = []
for i in range(n_samples,len(dataset_train),n_samples):
scenario = np.array(dataset_train)
padded_array = scenario[init:i,:]
data.append(padded_array)
init = i
data = np.stack(data)
dataset = np.load(‘dataset.npy’)
X_train, X_test, y_train, y_test = train_test_split(dataset[:,:,0:12], dataset[:,:,12:13],test_size = 0.2)
train_data = np.zeros((1,13))
for i in range (0,X_train.shape[0]):
scenario = np.array(X_train[i,:,:])
label = np.array(y_train[i,:,:])
scen =np.concatenate((scenario, label), axis=1)
train_data = np.concatenate((train_data,scen),axis=0)
Sorry, I don’t have the capacity to review/debug your code.
Perhaps split the samples randomly? Perhaps by their order? You know your data best.
Hi Sir,
In all of these examples, the loss of the train and validation set starts from different values and then converges (or not). However, what means if the loss of train and validation start from then the same value, then diverge, but after that converge.
I have an example in here: https://ibb.co/phzKTLm
Thanks, and sorry to bother.
Looks great to me! A good fit.
Hello Dr. Brownlee,
I’ve enjoyed your blog writings and your books. I’ve learned a lot thanks to you. You are very diligent in responding to your members.
I’m still learning and I was told in a StackOverflow blog that accuracy makes no sense in a regression problem. I’ve noticed you used accuracy as a measure in your LSTM above and LSTMs are a type of RNN. Can you clarify this for me because I’m experiencing cognitive dissonance as it relates to this now. Thanks in advance and keep up the good work.
Thanks!
Correct, accuracy is invalid for regression:
https://machinelearningmastery.com/faq/single-faq/how-do-i-calculate-accuracy-for-regression
The above model is a regression and does not use accuracy. We are plotting loss.
The example that does use accuracy (at the start of the post) is for a classification model.
Hi Jason, thanks for the tutorial. Could you please further explain me the difference in using validation_split(0.33) and validation_data=(valX, valY) ?
I understand that when using split, a % for validation is taken from the training data. However, I do not fully understand using validation_data=(valX, valY).
Thank you!
Yes, the former will automatically select a validation set from the training set, the latter uses the set specified that you have already extracted or prepared.
Thank you for your valuable help.
I have also seen examples where validation_data=(x_test, y_test). Is this a correct implementation for validation and how do you interpret?
Sometimes I do that, and it’s to keep examples simple rather than a good practice:
https://machinelearningmastery.com/faq/single-faq/why-do-you-use-the-test-dataset-as-the-validation-dataset
Amazing tutorial, thank you! My question is, what does it mean if I have validation and test loss looking like waves (i.e., going down together like small waves) ?
Thanks!
Luke
Thanks.
It can be a good idea to remove cycles/seasonality from the data prior to modeling:
https://machinelearningmastery.com/remove-trends-seasonality-difference-transform-python/
Hi Jason, when you show an example of UNDERFITTING model, your graphs clearly shows that the training loss < than validation.
However, I have made additional research and it seems that when the training loss < validation loss is OVERFITTING.
I am confused could you please clarify on this?
Thanks,
Matthew
You are correct in the general case.
In this specific case, we can clearly see that the model is capable of more improvement. The fit process has not converged, it is underfit.
This method is so useful for determining overfitting and underfitting.
It is used for LSTM models in this tutorial.
Can it be used for determining overfitting and underfitting in other neural network model like linear regression ANN models?
Yes.
see this:
https://machinelearningmastery.com/learning-curves-for-diagnosing-machine-learning-model-performance/
Some of your conclusions/advices are not correct, and you need to rewrite this post. For example, as someone has pointed it out, when val loss is greater than train loss, it’s likely a sign of overfitting. And it is *definitely* not underfitting.
I’ve seen cases where the val loss comes consistently *below* train loss over a wide range of epochs, but the model is terrible predicting a test set. Well, after painstakingly going thru thousands of data rows, I finally found the culprit.
It turns out the train set has a few outliers, which force the model to learn from these outliers. Remember, if your loss is MSE it exaggerates the few bad apples in your trainset. And the val set turns out to have none of these outliers.
So, even when val loss falls below train loss, it doesn’t mean a shit.
I disagree – but we may be talking past each other and a small test/val dataset can paint a conflicting picture.
See this updated post on learning curves:
https://machinelearningmastery.com/learning-curves-for-diagnosing-machine-learning-model-performance/
Hello Mr. Brownlee, thank u a lot for your valuable article it was very useful.
I just have a note, you said “An underfit model is one that is demonstrated to perform well on the training dataset and poor on the test dataset. ” I think is the opposite, an underfit model performs poorly on the training dataset, no!
Agreed. Underfit often means poor performance on the training set:
https://machinelearningmastery.com/learning-curves-for-diagnosing-machine-learning-model-performance/
Hi Jason,
Thanks for all your amazing tutorials, i’m new in machine learning, but through your cours, i am progressing realy fast.
I need your help to build my validation dataset to compare with my train dataset. Here in your example, you have a predefined validation dataset, no?
But in general, may i have a link or source to how to provide the validation dataset, please?
I am using your LSTM model on the airport passengers, and now i need to optimize my model and predictions.
Thank you in advance,
Ronak.
You’re welcome!
Validation data for sequence dataset is hard. Often it is the last n sequences in the training set are held back for validation.
How to develop lstm model for one-class classification method?