
A change in the variance or volatility over time can cause problems when modeling time series with classical methods like ARIMA.
The ARCH or Autoregressive Conditional Heteroskedasticity method provides a way to model a change in variance in a time series that is time dependent, such as increasing or decreasing volatility. An extension of this approach named GARCH or Generalized Autoregressive Conditional Heteroskedasticity allows the method to support changes in the time dependent volatility, such as increasing and decreasing volatility in the same series.
In this tutorial, you will discover the ARCH and GARCH models for predicting the variance of a time series.
After completing this tutorial, you will know:
- The problem with variance in a time series and the need for ARCH and GARCH models.
- How to configure ARCH and GARCH models.
- How to implement ARCH and GARCH models in Python.
Kick-start your project with my new book Time Series Forecasting With Python, including step-by-step tutorials and the Python source code files for all examples.
Let’s get started.

How to Develop ARCH and GARCH Models for Time Series Forecasting in Python
Photo by Murray Foubister, some rights reserved.
Tutorial Overview
This tutorial is divided into five parts; they are:
- Problem with Variance
- What Is an ARCH Model?
- What Is a GARCH Model?
- How to Configure ARCH and GARCH Models
- ARCH and GARCH Models in Python
Problem with Variance
Autoregressive models can be developed for univariate time series data that is stationary (AR), has a trend (ARIMA), and has a seasonal component (SARIMA).
One aspect of a univariate time series that these autoregressive models do not model is a change in the variance over time.
Classically, a time series with modest changes in variance can sometimes be adjusted using a power transform, such as by taking the Log or using a Box-Cox transform.
There are some time series where the variance changes consistently over time. In the context of a time series in the financial domain, this would be called increasing and decreasing volatility.
In time series where the variance is increasing in a systematic way, such as an increasing trend, this property of the series is called heteroskedasticity. It’s a fancy word from statistics that means changing or unequal variance across the series.
If the change in variance can be correlated over time, then it can be modeled using an autoregressive process, such as ARCH.
What Is an ARCH Model?
Autoregressive Conditional Heteroskedasticity, or ARCH, is a method that explicitly models the change in variance over time in a time series.
Specifically, an ARCH method models the variance at a time step as a function of the residual errors from a mean process (e.g. a zero mean).
The ARCH process introduced by Engle (1982) explicitly recognizes the difference between the unconditional and the conditional variance allowing the latter to change over time as a function of past errors.
— Generalized autoregressive conditional heteroskedasticity, 1986.
A lag parameter must be specified to define the number of prior residual errors to include in the model. Using the notation of the GARCH model (discussed later), we can refer to this parameter as “q“. Originally, this parameter was called “p“, and is also called “p” in the arch Python package used later in this tutorial.
- q: The number of lag squared residual errors to include in the ARCH model.
A generally accepted notation for an ARCH model is to specify the ARCH() function with the q parameter ARCH(q); for example, ARCH(1) would be a first order ARCH model.
The approach expects the series is stationary, other than the change in variance, meaning it does not have a trend or seasonal component. An ARCH model is used to predict the variance at future time steps.
[ARCH] are mean zero, serially uncorrelated processes with nonconstant variances conditional on the past, but constant unconditional variances. For such processes, the recent past gives information about the one-period forecast variance.
In practice, this can be used to model the expected variance on the residuals after another autoregressive model has been used, such as an ARMA or similar.
The model should only be applied to a prewhitened residual series {e_t} that is uncorrelated and contains no trends or seasonal changes, such as might be obtained after fitting a satisfactory SARIMA model.
— Page 148, Introductory Time Series with R, 2009.
What Is a GARCH Model?
Generalized Autoregressive Conditional Heteroskedasticity, or GARCH, is an extension of the ARCH model that incorporates a moving average component together with the autoregressive component.
Specifically, the model includes lag variance terms (e.g. the observations if modeling the white noise residual errors of another process), together with lag residual errors from a mean process.
The introduction of a moving average component allows the model to both model the conditional change in variance over time as well as changes in the time-dependent variance. Examples include conditional increases and decreases in variance.
As such, the model introduces a new parameter “p” that describes the number of lag variance terms:
- p: The number of lag variances to include in the GARCH model.
- q: The number of lag residual errors to include in the GARCH model.
A generally accepted notation for a GARCH model is to specify the GARCH() function with the p and q parameters GARCH(p, q); for example GARCH(1, 1) would be a first order GARCH model.
A GARCH model subsumes ARCH models, where a GARCH(0, q) is equivalent to an ARCH(q) model.
For p = 0 the process reduces to the ARCH(q) process, and for p = q = 0 E(t) is simply white noise. In the ARCH(q) process the conditional variance is specified as a linear function of past sample variances only, whereas the GARCH(p, q) process allows lagged conditional variances to enter as well. This corresponds to some sort of adaptive learning mechanism.
— Generalized autoregressive conditional heteroskedasticity, 1986.
As with ARCH, GARCH predicts the future variance and expects that the series is stationary, other than the change in variance, meaning it does not have a trend or seasonal component.
How to Configure ARCH and GARCH Models
The configuration for an ARCH model is best understood in the context of ACF and PACF plots of the variance of the time series.
This can be achieved by subtracting the mean from each observation in the series and squaring the result, or just squaring the observation if you’re already working with white noise residuals from another model.
If a correlogram appears to be white noise […], then volatility ca be detected by looking at the correlogram of the squared values since the squared values are equivalent to the variance (provided the series is adjusted to have a mean of zero).
— Pages 146-147, Introductory Time Series with R, 2009.
The ACF and PACF plots can then be interpreted to estimate values for p and q, in a similar way as is done for the ARMA model.
For more information on how to do this, see the post:
ARCH and GARCH Models in Python
In this section, we will look at how we can develop ARCH and GARCH models in Python using the arch library.
First, let’s prepare a dataset we can use for these examples.
Test Dataset
We can create a dataset with a controlled model of variance.
The simplest case would be a series of random noise where the mean is zero and the variance starts at 0.0 and steadily increases.
We can achieve this in Python using the gauss() function that generates a Gaussian random number with the specified mean and standard deviation.
|
1 2 |
# create dataset data = [gauss(0, i*0.01) for i in range(1,100+1)] |
We can plot the dataset to get an idea of how the linear change in variance looks. The complete example is listed below.
|
1 2 3 4 5 6 7 8 9 10 11 |
# create a simple white noise with increasing variance from random import gauss from random import seed from matplotlib import pyplot # seed pseudorandom number generator seed(1) # create dataset data = [gauss(0, i*0.01) for i in range(0,100)] # plot pyplot.plot(data) pyplot.show() |
Running the example creates and plots the dataset. We can see the clear change in variance over the course of the series.
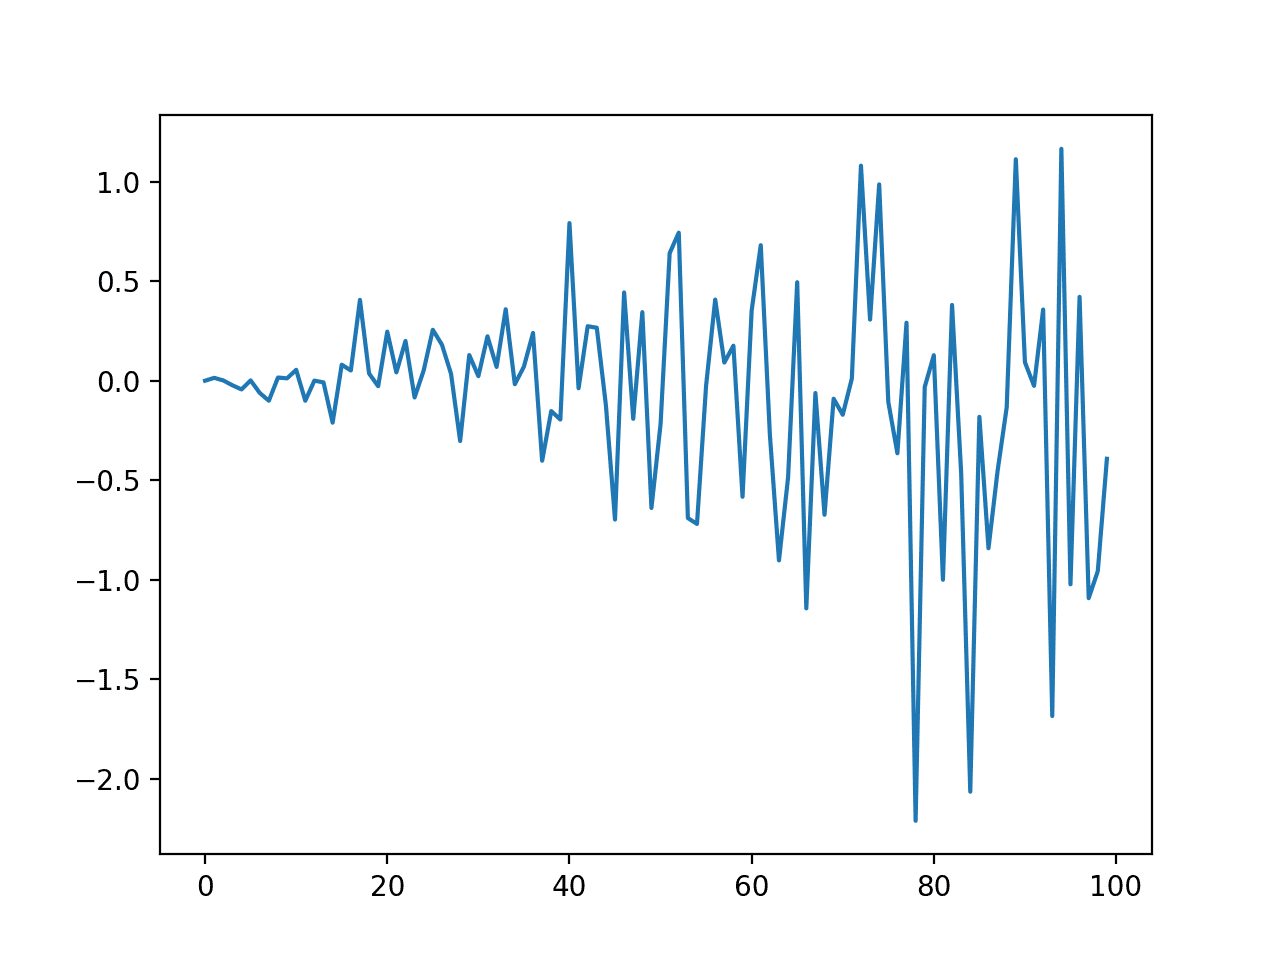
Line Plot of Dataset with Increasing Variance
Autocorrelation
We know there is an autocorrelation in the variance of the contrived dataset.
Nevertheless, we can look at an autocorrelation plot to confirm this expectation. The complete example is listed below.
|
1 2 3 4 5 6 7 8 9 10 11 12 13 14 |
# check correlations of squared observations from random import gauss from random import seed from matplotlib import pyplot from statsmodels.graphics.tsaplots import plot_acf # seed pseudorandom number generator seed(1) # create dataset data = [gauss(0, i*0.01) for i in range(0,100)] # square the dataset squared_data = [x**2 for x in data] # create acf plot plot_acf(squared_data) pyplot.show() |
Running the example creates an autocorrelation plot of the squared observations. We see significant positive correlation in variance out to perhaps 15 lag time steps.
This might make a reasonable value for the parameter in the ARCH model.
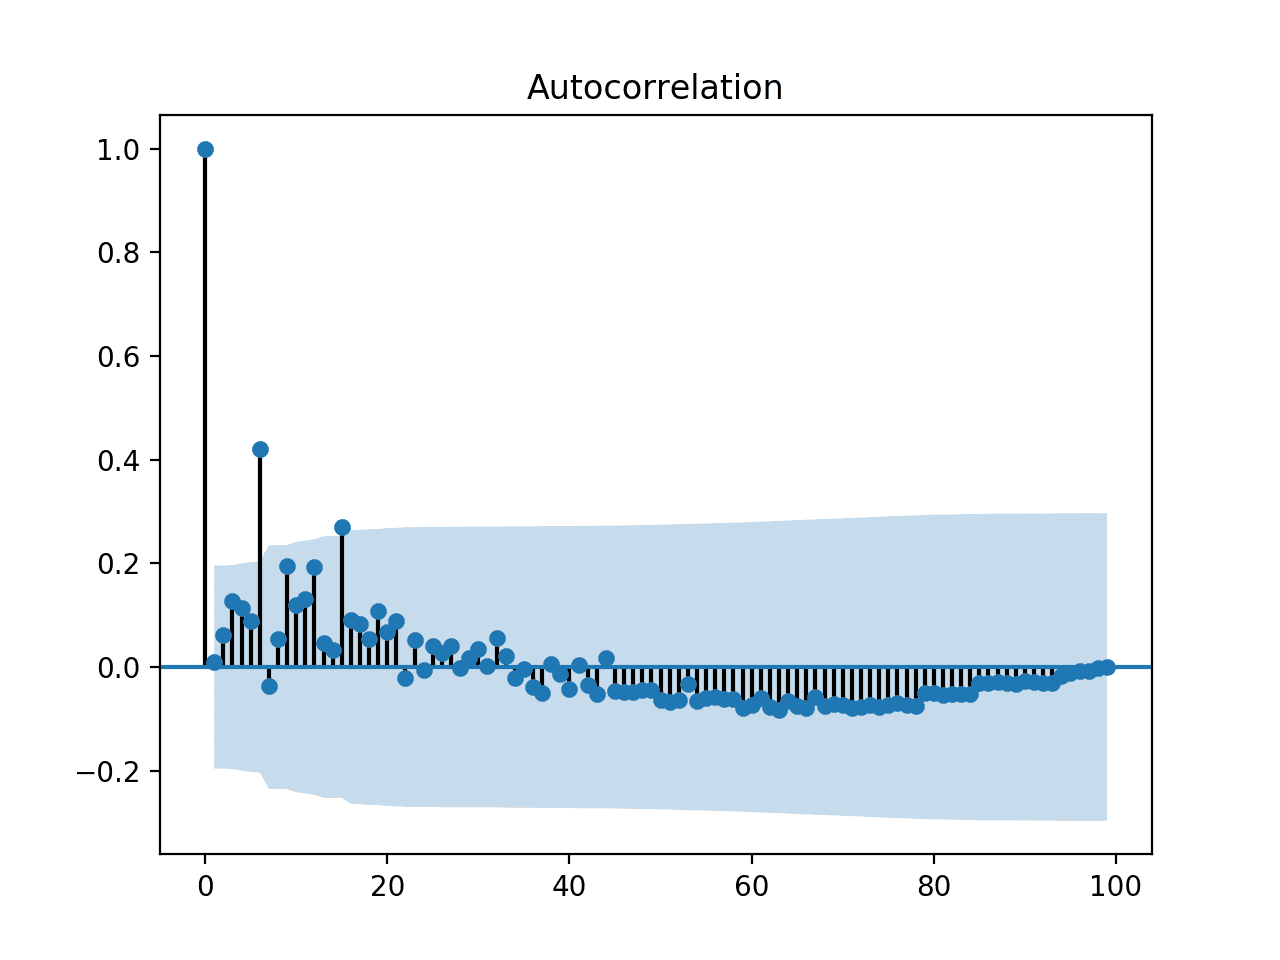
Autocorrelation Plot of Data with Increasing Variance
ARCH Model
Developing an ARCH model involves three steps:
- Define the model
- Fit the model
- Make a forecast.
Before fitting and forecasting, we can split the dataset into a train and test set so that we can fit the model on the train and evaluate its performance on the test set.
|
1 2 3 |
# split into train/test n_test = 10 train, test = data[:-n_test], data[-n_test:] |
A model can be defined by calling the arch_model() function. We can specify a model for the mean of the series: in this case mean=’Zero’ is an appropriate model. We can then specify the model for the variance: in this case vol=’ARCH’. We can also specify the lag parameter for the ARCH model: in this case p=15.
Note, in the arch library, the names of p and q parameters for ARCH/GARCH have been reversed.
|
1 2 |
# define model model = arch_model(train, mean='Zero', vol='ARCH', p=15) |
The model can be fit on the data by calling the fit() function. There are many options on this function, although the defaults are good enough for getting started. This will return a fit model.
|
1 2 |
# fit model model_fit = model.fit() |
Finally, we can make a prediction by calling the forecast() function on the fit model. We can specify the horizon for the forecast.
In this case, we will predict the variance for the last 10 time steps of the dataset, and withhold them from the training of the model.
|
1 2 |
# forecast the test set yhat = model_fit.forecast(horizon=n_test) |
We can tie all of this together; the complete example is listed below.
|
1 2 3 4 5 6 7 8 9 10 11 12 13 14 15 16 17 18 19 20 21 22 23 24 |
# example of ARCH model from random import gauss from random import seed from matplotlib import pyplot from arch import arch_model # seed pseudorandom number generator seed(1) # create dataset data = [gauss(0, i*0.01) for i in range(0,100)] # split into train/test n_test = 10 train, test = data[:-n_test], data[-n_test:] # define model model = arch_model(train, mean='Zero', vol='ARCH', p=15) # fit model model_fit = model.fit() # forecast the test set yhat = model_fit.forecast(horizon=n_test) # plot the actual variance var = [i*0.01 for i in range(0,100)] pyplot.plot(var[-n_test:]) # plot forecast variance pyplot.plot(yhat.variance.values[-1, :]) pyplot.show() |
Running the example defines and fits the model then predicts the variance for the last 10 time steps of the dataset.
A line plot is created comparing the series of expected variance to the predicted variance. Although the model was not tuned, the predicted variance looks reasonable.
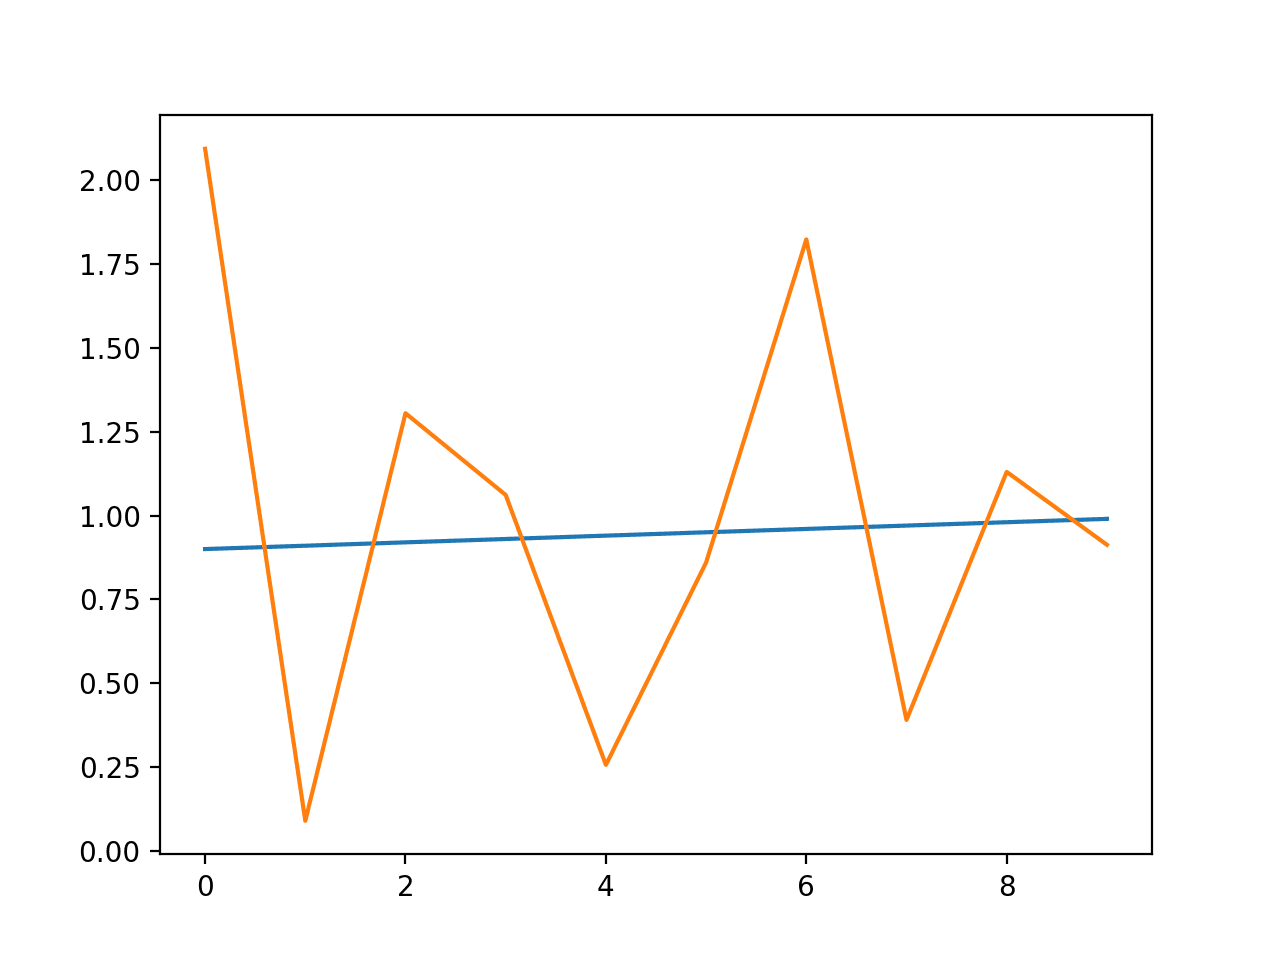
Line Plot of Expected Variance to Predicted Variance using ARCH
GARCH Model
We can fit a GARCH model just as easily using the arch library.
The arch_model() function can specify a GARCH instead of ARCH model vol=’GARCH’ as well as the lag parameters for both.
|
1 2 |
# define model model = arch_model(train, mean='Zero', vol='GARCH', p=15, q=15) |
The dataset may not be a good fit for a GARCH model given the linearly increasing variance, nevertheless, the complete example is listed below.
|
1 2 3 4 5 6 7 8 9 10 11 12 13 14 15 16 17 18 19 20 21 22 23 24 |
# example of ARCH model from random import gauss from random import seed from matplotlib import pyplot from arch import arch_model # seed pseudorandom number generator seed(1) # create dataset data = [gauss(0, i*0.01) for i in range(0,100)] # split into train/test n_test = 10 train, test = data[:-n_test], data[-n_test:] # define model model = arch_model(train, mean='Zero', vol='GARCH', p=15, q=15) # fit model model_fit = model.fit() # forecast the test set yhat = model_fit.forecast(horizon=n_test) # plot the actual variance var = [i*0.01 for i in range(0,100)] pyplot.plot(var[-n_test:]) # plot forecast variance pyplot.plot(yhat.variance.values[-1, :]) pyplot.show() |
A plot of the expected and predicted variance is listed below.
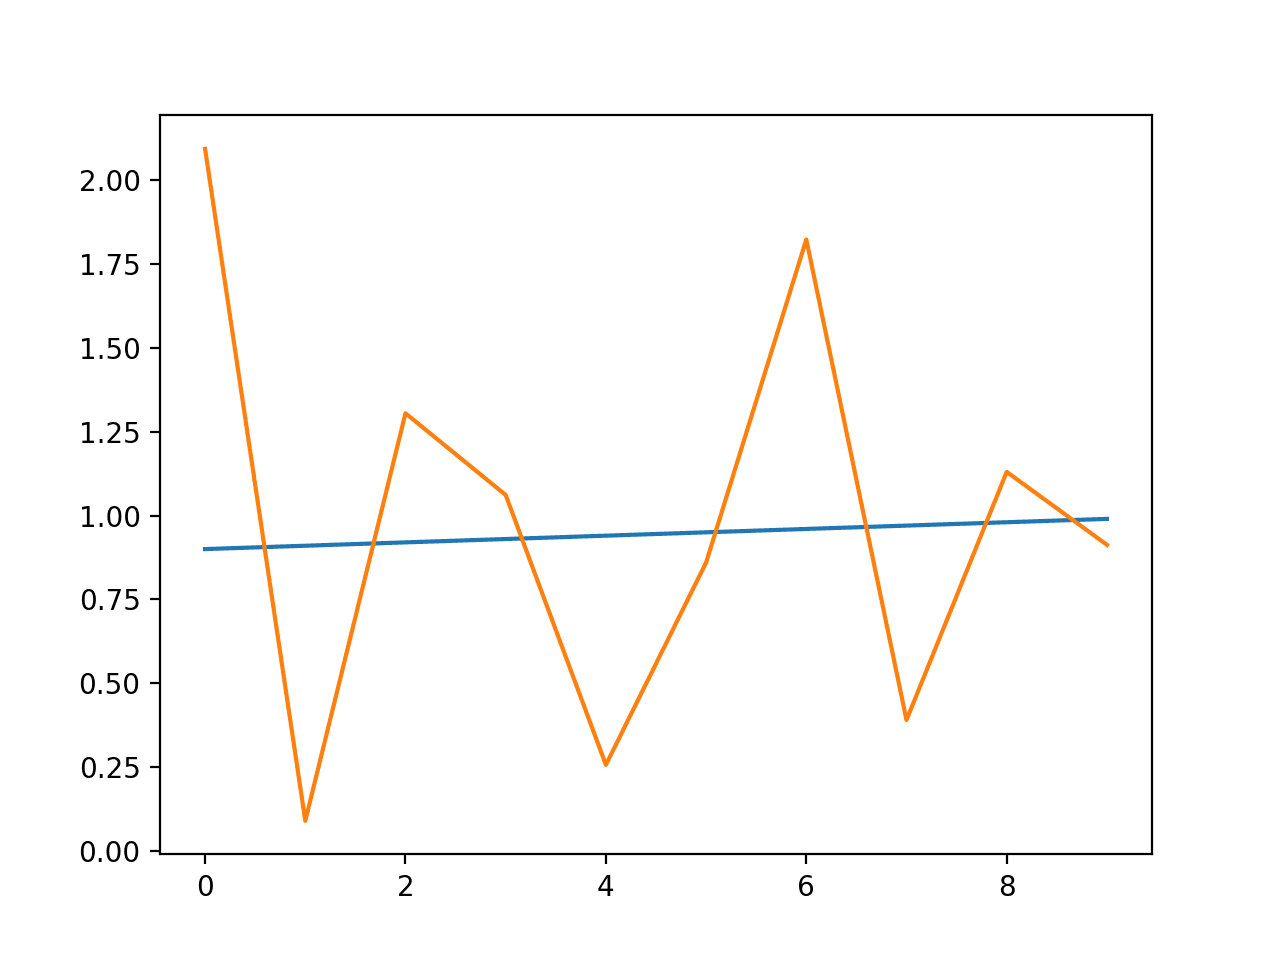
Line Plot of Expected Variance to Predicted Variance using GARCH
Further Reading
This section provides more resources on the topic if you are looking to go deeper.
Papers and Books
- Autoregressive Conditional Heteroscedasticity with Estimates of the Variance of United Kingdom Inflation, 1982.
- Generalized autoregressive conditional heteroskedasticity, 1986.
- Chapter 7, Non-stationary Models, Introductory Time Series with R, 2009.
API
Articles
- Autoregressive conditional heteroskedasticity on Wikipedia
- Heteroscedasticity on Wikipedia
- What is the difference between GARCH and ARCH?
Summary
In this tutorial, you discovered the ARCH and GARCH models for predicting the variance of a time series.
Specifically, you learned:
- The problem with variance in a time series and the need for ARCH and GARCH models.
- How to configure ARCH and GARCH models.
- How to implement ARCH and GARCH models in Python.
Do you have any questions?
Ask your questions in the comments below and I will do my best to answer.
Want to Develop Time Series Forecasts with Python?

Develop Your Own Forecasts in Minutes
...with just a few lines of python codeDiscover how in my new Ebook:
Introduction to Time Series Forecasting With Python
It covers self-study tutorials and end-to-end projects on topics like: Loading data, visualization, modeling, algorithm tuning, and much more...
Finally Bring Time Series Forecasting to
Your Own Projects
Skip the Academics. Just Results.


Hi Jason,
You mentioned the need for PACF but you haven’t plotted it, isn’t PACF needed to determine q?
Best,
Elie K
Yes, you can use ACF and PACF, learn more here:
https://machinelearningmastery.com/gentle-introduction-autocorrelation-partial-autocorrelation/
hi Eile ,i think that pacf is used to determine the value of “p” not “q”
When you talk about the predicting the variance of the model, isn’t the variance the square of std deviation? But in line 9 of your code either ARCH or GARCH models, you generated gaussian numbers with a mean and std dev, not a mean and std dev**2.
Could you please elaborate on std dev, std dev**2 and variance in the context of this page.
Thank you
Anthony of Sydney
The contrived sample problem is just a context for the code demo. Don’t read too much into it.
Hi, Jason.
I think your work with this blog is great!
I have a conceptual question. So ARCH and GARCH are not useful in order to predict or forecast the following data values in a time series, but to forecast the variance that future data might have instead? i.e. in stock pricing forecasting, these methods wouldn’t show the future prices, but instead they would show the variance those future prices might have implied?
Thanks a lot,
Sebastián from Colombia.
Think of them more of a model of the variability of the series.
Hi Jason,
Thanks for this great blog again.
It would be helpful if you could tell me as to why we find ACF of Squared residuals and not the ACF of just residuals?
Thanks.
It is mentioned in the post.
The squared residuals are equivalent to the variance (e.g. the thing we are modeling).
Trying to follow the tutorial but can’t get the past the step of importing the arch_model module.
I get the error “No module named ‘arch'” and I can’t find a solution online to fix it. Any help?
You must install the package first:
More help here:
https://github.com/bashtage/arch
Hi Jason, i wonder if this is not used for predicting or forecasting future value why would anyone use for variance ?
i am quite confused please clear me.
ARCH models are only useful when you want to forecast volatility, not a value.
ok thanks, but is there any chance we can use those variance to predict value in any way ?
You should use a different model to predict a value
hello sir ! which model we use for long term prediction
I would encourage you to test and evaluate a suite of models in order to discover what works best for your specific dataset.
This might help as a starting point:
https://machinelearningmastery.com/how-to-develop-a-skilful-time-series-forecasting-model/
Hi Jason, how did you come with p=15. isnt it supposed to be the same way you look into ACF and PACF plots and then decide p and q. In that case, typically, p and q should be less than 5 right?
From the post:
Awesome work man !
Thanks, I’m glad it helped.
This is a very helpful post! I am trying to figure out a few things:
1. Taking a time series of, say, daily volatility measures and forecasting that directly via a standard ARIMA method. Here one could take differences until arriving at a stationary series.
2. Using an ARCH model to forecast volatility.
In 1, wouldn’t differencing take care of non-constant variance? Also, if using ARCH, must one first fit an AR-type model, and then subsequently use ARCH? Or can the series of volatility measures be forecasting directly via ARCH?
I am confused on these points, so any clarification would be helpful. Thanks!
Differencing does not account for changing variance. It accounts for changing level (trend).
So a series of volatility measures could not be forecasted via a standard ARIMA model?
Also, is an ARCH model used to forecast the volatility series directly? Or is the stock price first modeled via an AR model and then ARCH used subsequently on the errors?
ARIMA could be used, but it is not designed for that problem.
I don’t know about predicting stock prices, sorry:
https://machinelearningmastery.com/faq/single-faq/can-you-help-me-with-machine-learning-for-finance-or-the-stock-market
Hi Jason! Thanks a lot for elegant solution. Can we use GARCH models to solve a classification problem, the classes of dependent variable corresponding to conditions on the implied volatility?
No.
good day Dr….. am working on GARCH Modeling in the presence of sudden change of a particular commercial bank in Nigeria can please get referral of book from you?
Perhaps start here: https://scholar.google.com
Hi, Dr. I am an Economics student in Canada. If through some diagnostic test, I found that my ARMA model has heteroskedasticity, can I then use the ARCH or GARCH model instead to get rid of the problem of heteroskedasticity?
Perhaps, but not that I’m aware.
so the blue line (last 2 plots) is the variance estimate over residuals from an ARMA process, isn t it? (DATA variable -that you artificially created here- are the residuals of a AR process?) Thanx for your work
Marco
It is a model and forecast of the variance.
Hi.
thanks for the example.
I have an exercise and wondered if you could help me.
I want to run GARCH test on a stocks index on CSV file.
The file contains 2 columns: date and daily return.
What do I need to change from the example above in order to apply it to my data?
thx again.
You can learn how to load your data here:
https://machinelearningmastery.com/load-machine-learning-data-python/
I’ve successfully uploaded my CSV with no problem but I’m getting an error when I’m trying to run:
“model_fit = model.fit()”
I will appreciate if you could help me.
My full script attached below:
#Dataste:
import numpy as np
import matplotlib.pyplot as plt
import pandas as pd
from matplotlib import pyplot
mydataset= pd.read_csv(‘TLV 35.csv’)
x= pd.to_datetime(mydataset[‘Date’])
y= mydataset[‘R’]
mydataset.head()
plt.plot(x,y)
pyplot.show()
plt.xlabel(‘Date’)
plt.ylabel(‘R’)
from statsmodels.graphics.tsaplots import plot_acf
y= mydataset[‘R’]
data= mydataset
#Autocorellation
from pandas import Series
from matplotlib import pyplot
from statsmodels.graphics.tsaplots import plot_acf
series = Series.from_csv(‘TLV 35.csv’, header=1)
plot_acf(series)
pyplot.show()
import numpy as np
import matplotlib.pyplot as plt
import pandas as pd
from matplotlib import pyplot
import statsmodels.api as sm
import matplotlib
%matplotlib inline
df=pd.read_csv(‘TLV 35 with graph.csv’)
df.head()
df.columns=[‘date’,’R’]
df.head()
df[‘date’]= pd.to_datetime(df[‘date’])
df.head()
df.set_index(‘date’,inplace=True)
df.head()
df.index
df.describe().transpose()
df.plot()
time_series=df[‘R’]
type(time_series)
time_series.rolling(365).mean().plot(label=’moving av’)
time_series.rolling(365).std().plot(label=’moving std’)
time_series.plot()
from arch import arch_model
# split into train/test
n_test = 10
train, test = df.index[:-n_test], df.index[-n_test:]
model=arch_model(train, mean=’zero’, vol=’ARCH’, p=1)
model_fit = model.fit()
What error are you getting?
How many parameters would you need to estimate in a AR(4)+GARCH(9,6) model?
Good question, I believe that is knowable, I can’t calculate it for you off hand sorry.
I have estimated model using ARDL Bound test and now looking for applying ARCH and GARCH to 5 macro-variable model. Please guide if it is possible. My data ranges from 1970-2018.How ???
What is ARDL?
I’ve successfully uploaded my excel file with no problem but I’m getting an error when I’m trying to run:
# define model
model = arch_model(train, mean=’Zero’, vol=’GARCH’, p=10, q=10)
—————————————————————————
NameError Traceback (most recent call last)
in
1 # define model
—-> 2 model = arch_model(train, mean=’Zero’, vol=’GARCH’, p=15, q=15)
NameError: name ‘arch_model’ is not defined
You may have skipped some lines of code from the example that import functions.
Excellent tutorial Jason
Just some updates for Python version 3.7
The sample codes requires previous installation of packages
sudo pip3 install arch
sudo pip3 install statsmodels
and using numpy in autocorrelation sample code, here the new code already tested
With these steps all the samples run as a charm.
Thank you for all your posts Jason, really thanks!
E. Bonilla
Thanks for sharing.
Hey thanks Jason for this great tutorial and Enrique for the update.
I actually rewrote this myself using the same approach EB took before seeing this – however I came to the comments to try to find an explanation for a difference in output to your screen capture in the post.
*Problem: My output acf plot shows a range of the same y, with x as 0-20*
Whereas your post shows an x range of 0-100.
Wondering if you or anyone else can share the some insight on this?
I believe the API changed.
You can vary the number of lags with a parameter to the function I believe.
Thanks for your blog!
Can I retrieve values of coefficients (omega, alpha, beta) from the table that arch_model function returns?
Thanks
You’re welcome.
I believe the coefficients are within the model, you can use the API to retrieve them.
You might need to dig into the code for the ARCHModel class.
https://arch.readthedocs.io/en/latest/univariate/mean.html#arch.univariate.base.ARCHModel
it is a nice and simple article for variance modeling, do you have an example on how to use it with other models like ARIMA or VAR to enhance predictions.
Thanks.
Not yet.
Great site, and post! Let’s say I wanted to model HMM-GARCH (RV=realized vol) using a proprietary state-dependent variable (X) as an external input. The HMM state being driven by X … RV would be conditional to prior RV and to current X level. Could this be easily implemented using the above model..i.e, replacing the random data and using real hist vol and X?
Again, thanks for the post…very helpful 😉
Thanks.
I don’t know, sorry.
Great explanations, thanks.
Why do you take squared data for the acf plot here and non squared data in your arima tutorial ? https://machinelearningmastery.com/arima-for-time-series-forecasting-with-python/
I never know which to use to determine AM and AR orders
The best approach in my experience is to grid search the hyperparameters:
https://machinelearningmastery.com/grid-search-arima-hyperparameters-with-python/
Hi Jason,
I keep hearing that “variance or volatility over time can cause problems when modeling time series with classical methods like ARIMA,” and so GARCH is used to address this problem. But it seems GARCH is only to forecast volatility, and therefore the original ARMA model is not necessarily “fixed,” its just that at least we can say something about volatility? So does the need of GARCH say about the usefulness of the time series modeling done by ARMA?
Good question, I don’t have good experience on combining the two methods, sorry.
Hi Jason,
On your Autocorrelation code section, you missed a line of code, you cant just use plot_acf using data that is stored in a list. You must give it a shape first in order to do it.
To name a few ways, you can convert it using numpy.array or pandas.DataFrame
Fixed code below :
import numpy as np

squared_data = np.array([x**2 for x in data])
Feel free to correct me if im wrong
Thanks for sharing.
Hi Jason,
As always, great article and I can say this with no doubt that this is one of the best machine learning resources available online. I have learned so many things from your blogs.
I have one request from you. Can you please do a demand/sales forecasting case study for retail business (or any line of business) which covers the impact of corona pandemic on the sales in the coming future (1-2 years).
Thanks
Thanks.
Great suggestion, thanks.
Hi Jason how shall I plot the GARCH values for the training data set? Actually I need that in a table format.
Perhaps save your array to CSV:
https://machinelearningmastery.com/how-to-save-a-numpy-array-to-file-for-machine-learning/
Hi Jason,
Thank you for this article. It is really helpful.
I have a question on how to deal with the seasonal effect in the time series prior to fitting the GARCH model. In particular, I’m trying to study the impact of different variables on the prices. However, the dependent and some of the independent variables contain the seasonality. I plan to conduct a two-stage process and remove the seasonality (separately using the OLS framework by adding the seasonal dummies) in both the independent and dependent variables. And then fit the ARX-GARCHX models. Is this an ideal way of dealing with seasonality?
You’re welcome.
Perhaps try seasonal differencing prior to fitting/evaluating the model?
There may be varieties of the model that support seasonality, I’m not across this sorry.
Thank you for your response, Jason,
Yes, I meant something like that.
Good luck with your project!
Excellent info,but i have a doubt , using arch we are trying to estimate volatility (t) but why are converting it into error term then doing AR (of error terms) instead why cant we directly convert into variances and do ARMA on it
If you can apply AR directly to the series if you like, but you are solving a different problem, e.g. forecasting the observation not the volatility.
Hi Jason,
this is a great post.
I have a few questions,
can I apply GARCH to multivariate data somehow in order to consider correlation between different variables?
As an example, assume I want to estimate the volatility of the currency exchange rate EUR/USD, I apply GARCH on those data and get a prediction of the volatility.
However, such index will also depend on the volatility of the currency exchange rate EUR/GBP or GBP/USD. they are correlated each other, so how can I make a volatility forecast that can count the correlation of the volatility with other variables?
I have heard of the dynamic conditional correlation method but I cannot find many resources python related.
Any other suggestions? Maybe GARCH can be modified to do that?
Thanks again
Luigi
Perhaps, but I don’t have a tutorial on the topic.
1)when we use arch and garch models? does it forecast future values? or only remove variance and volatility from series.
2)any specifics data-set are there for arch and garch models and what kind of domain will use this approach
No, they forecast expected volatility.
Hi Jason,
Indeed a nice tutorial for ARCH and GARCH models. Could you please let me know how to write code in Python for finding the Root Mean Squared Error, Mean Absolute Error, Median Absolute Error and Mean Absolute Percentage Error for both the above mentioned models ?
Regards
Tarun
Thanks.
Yes, see this:
https://machinelearningmastery.com/regression-metrics-for-machine-learning/
Hi Jason,
In this tutorial, how to find the order of the ARCH model.
You can use ACF/PACF plots to estimate the order or grid search order values.
Hi Jason,
I am almost done with ARCH. Struggling to find out the RMSE of the ARCH model. Please let me know how to fix it.
CODE –
# to find the RMSE
from sklearn.metrics import mean_squared_error
np.sqrt(mean_squared_error(test, X_model_forecast))
where
test = X[240:]
X_model_forecast = X_model_fit.forecast(horizon = 61)
X_model_fit = X_model.fit()
X_model = arch_model(train, mean=’Zero’, vol=’ARCH’, p=15)
ERROR-
TypeError: Expected sequence or array-like, got
Perhaps these tips will help:
https://machinelearningmastery.com/faq/single-faq/can-you-read-review-or-debug-my-code
Hi Jason,
For the parameter in the ARCH model, do we need to plot the ACF or the PACF ? Since in one of the You tube videos on ARCH, someone used the PACF to do so. Kindly clarify.
You can and it can be helpful.
On real projects, I prefer a quick grid search.
Hi Jason,
For the ARCH model, you created a dataset like
# create dataset
data = [gauss(0, i*0.01) for i in range(0,100)]
What if someone has a different dataset like Closing Indices of the NASDAQ or something like that which is not stationary? In that case what one should do ?
Please let me know.
Perhaps make your series stationary first?
Also, stock prices are not predictable:
https://machinelearningmastery.com/ufaqs/can-you-help-me-with-machine-learning-for-finance-or-the-stock-market/
Hi Jason,
I have a query. How will you implement GARCH-M and TARCH / GJR – GARCH in Python code?
Please lemme know.
I don’t know off the cuff sorry.
Hi Jason,
Thank you for this helpful tutorial. I was wondering if you knew if Python had any packages for GARCH models with additional covariates. I was hoping to implement a GARCHX model in python to analyze the impact of wind and solar generation on electricity price volatility.
Thank you!
I don’t know offhand, sorry.
Hi Jason, Great post. Thanx for your committed efforts in making learning easy.
I have a doubt. By incorporating GARCH model along with my ARIMA model for price forecasting, can I improve the forecast accuracy?
It depends on your data and your model, perhaps develop a prototype and evaluate it on your data.
Hi there!
Can you explain to me, the elements of the prediction matrix: in particular the mean and variance.
From the documentation, I understood that the first is the conditional mean and the second the conditional variance.
Can you show me these two elements to what correspond in math? Or better having the formulas of a GARCH process which part of those formulas are they?
Because in another tutorial, I saw that it is possible to predict future values of a stationary series (in mean), but with conditional heteroskedasticity, by fitting an ARMA(p,q) model on the series and a GARCH(p,q) model on the residuals. Then the dued summed the ARMA forecast with the GARCH “mean” forecast. But this last step is not clear to me.
Hi Dario…the following resource may be of interest:
https://towardsdatascience.com/deep-understanding-of-the-arima-model-d3f0751fc709
Hello, may i ask why var = [i*0.01 for i in range(0,100)]?
Hi Jason,
great tutorial for the use of the arch package in python.
I have a few questions regarding the application of the tutorial to real data.
If I have a vector of values, where I don’t know the actual mean and variance of the data, how do I proceed?
In your example you know your variance for each single data-point and you can compare it to the predicted values by the model. If I expect a changing variance in my data, how can I compare the prediction to the real value?
I am trying to adapt your tutorial to the prediction of volatitlies in options.
Hi, great job done.
Very informative blog. Keep up the good work.
I have a further question:
I your example you knew your mean and variance, since you generated the data. But how do I proceed, when working with real data? Could you extend the example with real data (maybe stock price) to predict the volatility?
Thanks
You are very welcome Leo! We appreciate your feedback and suggestions! It is certainly recommended that exploratory data analysis be performed to gather and understand key characteristics.
https://machinelearningmastery.com/understand-problem-get-better-results-using-exploratory-data-analysis/