A confusion matrix is a technique for summarizing the performance of a classification algorithm.
Classification accuracy alone can be misleading if you have an unequal number of observations in each class or if you have more than two classes in your dataset.
Calculating a confusion matrix can give you a better idea of what your classification model is getting right and what types of errors it is making.
In this post, you will discover the confusion matrix for use in machine learning.
After reading this post you will know:
What the confusion matrix is and why you need to use it.
How to calculate a confusion matrix for a 2-class classification problem from scratch.
How create a confusion matrix in Weka, Python and R.
Kick-start your project with my new book Machine Learning Algorithms From Scratch, including step-by-step tutorials and the Python source code files for all examples.
Let’s get started.
Update Oct/2017: Fixed a small bug in the worked example (thanks Raktim).
Update Dec/2017: Fixed a small bug in accuracy calculation (thanks Robson Pastor Alexandre)
What is a Confusion Matrix in Machine Learning Photo by Maximiliano Kolus, some rights reserved
Classification Accuracy and its Limitations
Classification accuracy is the ratio of correct predictions to total predictions made.
1
classification accuracy = correct predictions / total predictions
It is often presented as a percentage by multiplying the result by 100.
1
classification accuracy = correct predictions / total predictions * 100
Classification accuracy can also easily be turned into a misclassification rate or error rate by inverting the value, such as:
Classification accuracy is a great place to start, but often encounters problems in practice.
The main problem with classification accuracy is that it hides the detail you need to better understand the performance of your classification model. There are two examples where you are most likely to encounter this problem:
When your data has more than 2 classes. With 3 or more classes you may get a classification accuracy of 80%, but you don’t know if that is because all classes are being predicted equally well or whether one or two classes are being neglected by the model.
When your data does not have an even number of classes. You may achieve accuracy of 90% or more, but this is not a good score if 90 records for every 100 belong to one class and you can achieve this score by always predicting the most common class value.
Classification accuracy can hide the detail you need to diagnose the performance of your model. But thankfully we can tease apart this detail by using a confusion matrix.
What is a Confusion Matrix?
A confusion matrix is a summary of prediction results on a classification problem.
The number of correct and incorrect predictions are summarized with count values and broken down by each class. This is the key to the confusion matrix.
The confusion matrix shows the ways in which your classification model
is confused when it makes predictions.
It gives you insight not only into the errors being made by your classifier but more importantly the types of errors that are being made.
It is this breakdown that overcomes the limitation of using classification accuracy alone.
How to Calculate a Confusion Matrix
Below is the process for calculating a confusion Matrix.
You need a test dataset or a validation dataset with expected outcome values.
Make a prediction for each row in your test dataset.
From the expected outcomes and predictions count:
The number of correct predictions for each class.
The number of incorrect predictions for each class, organized by the class that was predicted.
These numbers are then organized into a table, or a matrix as follows:
Expected down the side: Each row of the matrix corresponds to a predicted class.
Predicted across the top: Each column of the matrix corresponds to an actual class.
The counts of correct and incorrect classification are then filled into the table.
The total number of correct predictions for a class go into the expected row for that class value and the predicted column for that class value.
In the same way, the total number of incorrect predictions for a class go into the expected row for that class value and the predicted column for that class value.
In practice, a binary classifier such as this one can make two types of errors: it can incorrectly assign an individual who defaults to the no default category, or it can incorrectly assign an individual who does not default to the default category. It is often of interest to determine which of these two types of errors are being made. A confusion matrix […] is a convenient way to display this information.
This matrix can be used for 2-class problems where it is very easy to understand, but can easily be applied to problems with 3 or more class values, by adding more rows and columns to the confusion matrix.
Let’s make this explanation of creating a confusion matrix concrete with an example.
2-Class Confusion Matrix Case Study
Let’s pretend we have a two-class classification problem of predicting whether a photograph contains a man or a woman.
We have a test dataset of 10 records with expected outcomes and a set of predictions from our classification algorithm.
1
2
3
4
5
6
7
8
9
10
11
Expected, Predicted
man, woman
man, man
woman, woman
man, man
woman, man
woman, woman
woman, woman
man, man
man, woman
woman, woman
Let’s start off and calculate the classification accuracy for this set of predictions.
The algorithm made 7 of the 10 predictions correct with an accuracy of 70%.
1
2
accuracy = total correct predictions / total predictions made * 100
accuracy = 7 / 10 * 100
But what type of errors were made?
Let’s turn our results into a confusion matrix.
First, we must calculate the number of correct predictions for each class.
1
2
men classified as men: 3
women classified as women: 4
Now, we can calculate the number of incorrect predictions for each class, organized by the predicted value.
1
2
men classified as women: 2
woman classified as men: 1
We can now arrange these values into the 2-class confusion matrix:
1
2
3
men women
men 3 1
women 2 4
We can learn a lot from this table.
The total actual men in the dataset is the sum of the values on the men column (3 + 2)
The total actual women in the dataset is the sum of values in the women column (1 +4).
The correct values are organized in a diagonal line from top left to bottom-right of the matrix (3 + 4).
More errors were made by predicting men as women than predicting women as men.
Two-Class Problems Are Special
In a two-class problem, we are often looking to discriminate between observations with a specific outcome, from normal observations.
Such as a disease state or event from no disease state or no event.
In this way, we can assign the event row as “positive” and the no-event row as “negative“. We can then assign the event column of predictions as “true” and the no-event as “false“.
This gives us:
“true positive” for correctly predicted event values.
“false positive” for incorrectly predicted event values.
“true negative” for correctly predicted no-event values.
“false negative” for incorrectly predicted no-event values.
We can summarize this in the confusion matrix as follows:
1
2
3
event no-event
event true positive false positive
no-event false negative true negative
This can help in calculating more advanced classification metrics such as precision, recall, specificity and sensitivity of our classifier.
For example, classification accuracy is calculated as true positives + true negatives.
Consider the case where there are two classes. […] The top row of the table corresponds to samples predicted to be events. Some are predicted correctly (the true positives, or TP) while others are inaccurately classified (false positives or FP). Similarly, the second row contains the predicted negatives with true negatives (TN) and false negatives (FN).
Now that we have worked through a simple 2-class confusion matrix case study, let’s see how we might calculate a confusion matrix in modern machine learning tools.
Code Examples of the Confusion Matrix
This section provides some example of confusion matrices using top machine learning platforms.
These examples will give you a context for what you have learned about the confusion matrix for when you use them in practice with real data and tools.
Example Confusion Matrix in Weka
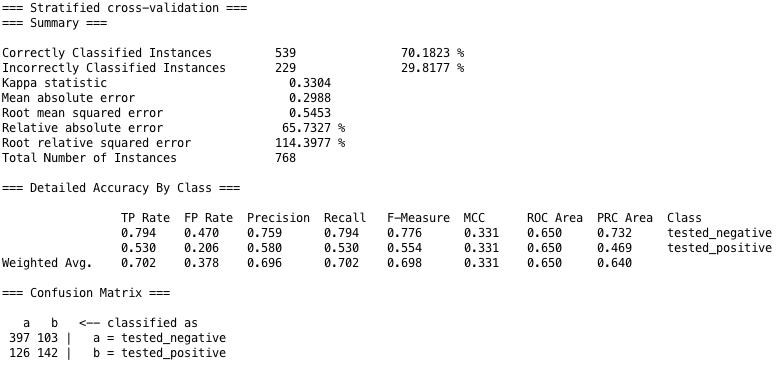
The Weka machine learning workbench will display a confusion matrix automatically when estimating the skill of a model in the Explorer interface.
Below is a screenshot from the Weka Explorer interface after training a k-nearest neighbor algorithm on the Pima Indians Diabetes dataset.
The confusion matrix is listed at the bottom, and you can see that a wealth of classification statistics are also presented.
The confusion matrix assigns letters a and b to the class values and provides expected class values in rows and predicted class values (“classified as”) for each column.
Weka Confusion Matrix and Classification Statistics
Example Confusion Matrix in Python with scikit-learn
The scikit-learn library for machine learning in Python can calculate a confusion matrix.
Given an array or list of expected values and a list of predictions from your machine learning model, the confusion_matrix() function will calculate a confusion matrix and return the result as an array. You can then print this array and interpret the results.
1
2
3
4
5
6
7
# Example of a confusion matrix in Python
from sklearn.metrics import confusion_matrix
expected=[1,1,0,1,0,0,1,0,0,0]
predicted=[1,0,0,1,0,0,1,1,1,0]
results=confusion_matrix(expected,predicted)
print(results)
Running this example prints the confusion matrix array summarizing the results for the contrived 2 class problem.
The caret library for machine learning in R can calculate a confusion matrix.
Given a list of expected values and a list of predictions from your machine learning model, the confusionMatrix() function will calculate a confusion matrix and return the result as a detailed report. You can then print this report and interpret the results.
It covers 18 tutorials with all the code for 12 top algorithms, like:
Linear Regression, k-Nearest Neighbors, Stochastic Gradient Descent and much more...
Finally, Pull Back the Curtain on
Machine Learning Algorithms
Nice example. I have two single dimensional array:one is predicted and other is expected. It is not a binary classification. It is a five class classification problem. How to compute confusion matrix and true positive, true negative, false positive, false negative.
Using Weka and Tanagra, naive Bayes classification leads to a confusion matrix, How I can show the classification results in the form of image instead of confusion matrix?
Guide please
“Lena” noisy image taken as base on which noise detection feature applied after that matrix of features passed as training set. Now I want to take output in the form of image (Lena) but Tanagra and weka shows confusion matrix or ROC curve (can show scatter plot) through naive Bayes classification. Help plz
Hello Jason, I have a 3 and a 4 class problem, and I have made their confusion matrix but I cant understand which of the cells represents the true positive,false positive,false negative, in the binary class problem its more easy to understand it, can you help me?
Dear Dr Jason,
I fully agree with you. These resources on this website are like ‘bare bones’. It is up to you to apply the model. The general concept of a confusion matrix is summarized in “2 class confusion matrix case study”, particularly the table at the end of the section. Follow from the beginning of the section.
Since this is a 2 class confusion matrix, you have “fraud”/ “non-fraud” rows and columns instead of “men”/”women” rows and columns.
Hi! Thank you for the great post!
I have one doubt though……….For the 2 class problem, where you discussed about false positives etc should’nt false positive be the entry below true positive in the matrix?
Hi,
I hope to get a reply soon. How do we compute confusion matrix for the multilabel multiclass classification case? Please give an example.
As far as I understand:
If
y_pred = [1,1,0,0] and y_true = [0,0,1,1]; the confusion matrix is:
Is that right? If so, why is this a correct way to compute it (since we don’t know if class-4 is confused with class 1 or class 2, Same goes with the case of class-3)?
Hi Dr. Brownlee,
In your given confusion matrix, False Positive and False Negative has become opposite. I got really confused by seeing that confusion matrix. Event that incorrectly predicted as no event should be False Negative on the other hand no-event that incorrectly predicted as event should be False Positive. Thats what I have learnt from the following reference.
Do you have example of source code (java) for multi-class to calculate confusion matrix?
Let say i have 4 class(dos, normal,worms,shellcode) then i want to make a confusion matrix where usually diagonal is true positive value. Accuracy by class(dos)= predicted dos/actual dos and so on then later on accuracy= all the diagonal (tp value)/ total number of instances
hi! i am working on a binary classification problem but the confusion matrix i am getting is something like
[12, 0, 0],
[ 1, 16, 0],
[ 0, 7, 0]
I don’t understand what does the 7 mean? can you please explain?
N.B. It should be
[13, 0],
[0, 23]
Actually there is no bug in the code. The code works fine with other datasets.
So I changed the target vector of the dataset from 2 to 3 and it works better now but the problem remains the same.
Now it looks like this:
[[17, 0, 0, 0],
[ 0, 12, 0, 0],
[ 0, 0, 8, 0],
[ 0, 0, 0, 2]]
Is it because the ANN could not link the 2 values (4th row) with any of the other classes?
Weka seems to do the opposite. if you do a simple J48 classification on the Iris tutorial data, you get the following
a b c <– classified as
49 1 0 | a = Iris-setosa
0 47 3 | b = Iris-versicolor
0 2 48 | c = Iris-virginica
where we know that there are actually 50 of each type. So for Weka's confusion matrix, the actual count is the sum of entries in a row, not a column. So I'm still confused!
Yes that helps, thanks. Confirms that for the Weka confusion matrix, columns are predicted and rows are actual – the transpose of the definition you are using, as you point out. I hadn’t realised that both formats are in common use.
Thank you for these website, i am an intern my superiors gave me some tasks about machine learning and a.ı and your web site helped me very well thanks a lot Jason
Hi there, I need help.. I’m using weka and the spam base data set from UCI, and the used one of the meta classifiers which is the stacking classifier; which gave 60.59 % accuracy, but the essiue is the true positive TP and the false positive were 0.
What does it mean?
please i have a question i run a code for classification problem
i found good accuracy in training and testing data
i use the confusion matrix but the clasification i found in confusion matrix for classification the number is few than the number of my dataset
m question why? i should find the number of my sample in the confusion matrix by then determine the acual ad predicted value please respond me im confuse
to know the your classification what we us e
The total count in the confusion matrix will match the total number of rows in the test set. If this is not the case, ensure you counted correctly in both cases.
Hi,
If the dataset containing as positive and negative reviews. Can we identify Fake Positive Reviews Rate, Fake Negative Reviews Rate, Real Positive Reviews Rate and Real Negative Reviews Rate using a confusion matrix after applying sentiment classification algorithms on a dataset?
It seems that there is no standard on how the predicted vs. reference values are represented in the rows and columns in the matrix. The carat docs and wikipedia have reference in the columns whereas many blogs show the opposite. I guess it doesn’t matter as long as you know what the library is doing. In your article though, you state:
Expected down the side: Each row of the matrix corresponds to a predicted class.
Predicted across the top: Each column of the matrix corresponds to an actual class.
Is that correct? Shouldn’t it say:
Expected down the side: Each row of the matrix corresponds to an actual class.
Predicted across the top: Each column of the matrix corresponds to a predicted class.
hi sir, thank you for such a wonderful explanation.
but I have one doubt in between precision and recall.
can you please explain me in any general example
In the Python confusion matrix example, you pass in the expected array followed by the predictions array:
results = confusion_matrix(expected, predicted)
When I was reviewing the results in the matrix, it seemed wrong, as I was expecting the following based on manually calculating each bucket in my head as follows:
[TP , FP]
[FN, TN]
[[3 2]
[1 4]]
But, I ran your code as-is and go the same result as you did:
[[4 2]
[1 3]]
This didn’t make sense to me because looking at the data set, there are clearly 3 TPs, 2 FPs; 1 FN and 4 TNs.
So, I tried flipping the parameters to:
results = confusion_matrix(predicted, expected)
And now I have the results I expect.
Are there different conventions for presenting a confusion matrix? Thanks.
what I noticed is that the model tends to classify the bias label good, otherwise It does not classify well. is this a good thing there is something wrong?
Ok I have the first dataset who has unbalanced labels (0 for neutral,1 for hate) the number of 0 labels is much larger than 1 label, the confusion matrix is in the first link, the darker color is in the section of 0 is classified as 0, which means the model performs well on the label who has the bias (more) in the dataset, when I test on dataset with 1 is more than zero label the darker color also in the 1 label in second link.
the third link for the balanced dataset
NOW the model performance is acceptable or there is something wrong?
To know if the model is acceptable for your project, you must choose a performance metric by which it can be evaluated that matches the goals of your project and project stakeholders.
A confusion matrix is not a metric, it is an analysis tool.
Confusion Matrix Very nicely explained. I have a query, your expert help is required. I did binary prediction through XGboost model and when I obtain the confusion matrix, I get MacNemar Test with p<0.05. How should I interpret it? Is it showing a significant difference between the 1st model when the algorithm started and the last model when the algorithm stopped? If it is not so, then what is it actually telling or if yes, please share academic reference. I obtained the confusion matrix from the caret package in R.
Thanks for the wonderful post.
Please clarify my doubt. I have plotted the confusion matrix for the test data belonging to two classes of an individual subject. I would like to know if there are multiple subjects, do I have to plot the confusion matrices for all of them individually?
In a journal paper, If I have to project a single confusion matrix representing all the subjects (n=15), how should I go about?
Kindly help me in this regard.
Thanks in advance.
Thanks for your swift reply!
I mean an individual/a participant of a research study by ‘subject’. I have two classes.
My question is how do I have to plot a single confusion matrix representing all the participants?
Hope I have made my question clearer now.
Thanks in advance.
I have one question related to TP, FP, FN, TN. it can only define with the binary classification( true or false) or it also can define in multi-class classification.
Hello sir,
what a problem if i do not obtain a total number of confusion mat. ( i used 1000 images for classification) but in confusion matrix result i only get about 300 for (TP, TN, FP AND FN).
what is the reason of that?
thanks
I have a multi-class problem of 9 classes, when I use logistic regression the accuracy score is 0.3. The predictor classifies apparently well when looking at the confusion matrix, but it has trouble defining which neighbor to choose (For example when actual value is class #3 it predicts classes 2 , 3 or 4) , same for the rest of the 9 classes. I think the accuracy score is too rigid for my problem, and that is why I am getting it too low . Do you think I should use other metric, which does not penalize so heavily or what would you recommend???
Can you please help me? I have generated a confusion matrix of a satellite image where the number of misclassified pixels are exactly the same in some other classes…Can it be happen
Dear Dr. Jason, after performing a 10-fold stratified cross-validation for a binary classification, we will usually proceed to generate the confusion matrix. So, is it a best practice to combine all the 10 confusion matrices as a single confusion matrix for reporting, rather than just generating a single confusion matrix independently that I have seen widely in those Kaggle Notebooks?
If it is best to combine all the 10 confusion matrix, should we calculate the average of these four metrics,True Negative, True positive, False Negative and False Positive, rather than summing them up? What is the notion behind the combination? Also, can you provide a hint on the Python coding for getting the average from the confusion_matrix() method for these 10 confusion matrix? Thank you.
Hello Sir, fist of all thank you very much for this great explanation. I would like to ask you that is there the caret library in python? Because I need to calculate specificity and sensitivity. Please help me
Hello Sir.
I have an image class consisting of 7 categories. (37000 train and 2800 test images) How can I get information about which images were incorrectly predicted as a result of the confusion matrix? For example
image id – — predicted class —- real class
1.jpg———– Class A—————Class B.
Hi, regarding @feereshteh’s question – is it better to create a confusion matrix in the last epoch of training in which we call the validation part (and to have one “if statement” in validation to check if that is the last epoch and then save predicted and expected values) or to save the final model of training and again push all dataset through it? Do you have a link about that regarding neural network training for multiclass classification in TensorFlow or Pytorch?
thx
Hello.
I am using Weka to build my model but i keep getting a large confusion matrix (41×41) and i just want a 2×2 matrix. is there a way to reduce the matrix using weka to a 2×2 matrix ?
kindly help if you can.
I have a classifier where I coded in an “unclassified” category for predictions that fall below a certain probability value. There reference data, however, does not have any instances in that category. When calculating the confusion matrix should I only calculate it based on the predictions that returned a value (i.e. that were NOT labeled as unclassified), or should I be including the unclassified category in the confusion matrix?
I read the recommended files regarding the initial stage of Machine learning which is really very helpful to understanding the initial concepts.
I have a question regarding the PLS-DA model. In the PLS-DA model, which information we get from the ROC curve. I really didn’t get the concept of the ROC curve exactly, please tell me about it,


Nice example. I have two single dimensional array:one is predicted and other is expected. It is not a binary classification. It is a five class classification problem. How to compute confusion matrix and true positive, true negative, false positive, false negative.
Hi Vinay, you can extrapolate from the examples above.
Hey Vinay did you got the solution for the problem ?? I’m facing the similar problem right now.
hi it is very helpful explanation for me.my question is the confusion matrix predicted and actual value placement different for WEKA and python?
Nice , very good explanation.
Thanks Shai.
hello sir,
Can we implement confusion matrix in multi-class neural network program using K-fold cross validation??
Yes, but you would have one matrix for each fold of your cross validation.
It would be better method for a train/test split.
Using classification Learner app of MATLAB and I obtained the confusion matrix, Can I show the classification results in image? how? Please guide
Sorry, I don’t have matlab examples.
Using Weka and Tanagra, naive Bayes classification leads to a confusion matrix, How I can show the classification results in the form of image instead of confusion matrix?
Guide please
What would the image show?
“Lena” noisy image taken as base on which noise detection feature applied after that matrix of features passed as training set. Now I want to take output in the form of image (Lena) but Tanagra and weka shows confusion matrix or ROC curve (can show scatter plot) through naive Bayes classification. Help plz
how to write confusion matrix for n image in one table
You have one row/column for each class, not each input (e.g. each image).
Hello Jason, I have a 3 and a 4 class problem, and I have made their confusion matrix but I cant understand which of the cells represents the true positive,false positive,false negative, in the binary class problem its more easy to understand it, can you help me?
See this table that will make it clear:
https://en.wikipedia.org/wiki/Confusion_matrix#Table_of_confusion
I need a mathematical model for fraud detection.
Sorry, I cannot help you.
Jason Brownlee. very poor answer
Which answer and how so Nathan?
Dear Dr Jason,
I fully agree with you. These resources on this website are like ‘bare bones’. It is up to you to apply the model. The general concept of a confusion matrix is summarized in “2 class confusion matrix case study”, particularly the table at the end of the section. Follow from the beginning of the section.
Since this is a 2 class confusion matrix, you have “fraud”/ “non-fraud” rows and columns instead of “men”/”women” rows and columns.
There is a page at http://web.stanford.edu/~rjohari/teaching/notes/226_lecture8_prediction.pdf which talks about fraud detection and spam detection. Is it the bees-knees of study? I cannot comment but suffice to say don’t expect a fully exhaustive discussion of all the minutiae on webpages/blogs
In addition, even though I have Dr Jason’s book “Machine Learning from Scratch”, I always seek ideas from this webpage.
Anthony from exciting Belfield
Thanks.
nice explanation
Thanks.
Hi! Thank you for the great post!
I have one doubt though……….For the 2 class problem, where you discussed about false positives etc should’nt false positive be the entry below true positive in the matrix?
hi
Is the confusion matrix defined only for nominal variables?
Yes.
Thanks. Mr jason
You’re welcome.
Is there anything like a confusion matrix also available for regression.
There are deviations there too.
No. You could look at the variance of the predictions.
Hi,
I hope to get a reply soon. How do we compute confusion matrix for the multilabel multiclass classification case? Please give an example.
As far as I understand:
If
y_pred = [1,1,0,0] and y_true = [0,0,1,1]; the confusion matrix is:
C1 C2 C3 C4
C1 0 0 0 0
C2 0 0 0 0
C3 1 1 0 0
C4 1 1 0 0
Is that right? If so, why is this a correct way to compute it (since we don’t know if class-4 is confused with class 1 or class 2, Same goes with the case of class-3)?
Hi Dr. Brownlee,
In your given confusion matrix, False Positive and False Negative has become opposite. I got really confused by seeing that confusion matrix. Event that incorrectly predicted as no event should be False Negative on the other hand no-event that incorrectly predicted as event should be False Positive. Thats what I have learnt from the following reference.
Waiting for your explanation.
Reference: http://www.dataschool.io/simple-guide-to-confusion-matrix-terminology/
Youtube Video: https://www.youtube.com/watch?v=4Xw19NpQCGA
Wikipedia: https://en.wikipedia.org/wiki/Confusion_matrix
Thanks Raktim, fixed!
Hi Dr Brownlee,
“We can summarize this in the confusion matrix as follows:”
After the above line the table is still there and showing the FP and FN in opposite way.
Regards,
Raktim
Yes, the table matches Wikipedia exactly:
https://en.wikipedia.org/wiki/Confusion_matrix
What is the problem?
Dear Sir,
Will you please look at this because wiki has written opposite way? Therefore your table does not match.
https://drive.google.com/open?id=0B8RkeH8XSyArWldzdjFGYW1teTA
There’s an error in the accuracy’s formula.
It’s:
accuracy = 7 / 10 * 100
Instead of:
accuracy = 7 / 100 * 100
Fixed, thanks Robson!
Hello!Could you please explain how to find parameters for multiclass confusion matrix like 3*3 order or more?
Sorry, what do you mean find parameters for a confusion matrix?
Could you please explain why confusion matrix is better than other for the evaluation model classification, especially for Naive Bayes. thankyou
It may be no better or worse, just another way to review model skill.
Could you please explain why confusion matrix is good or recommended for evalution model ?
It can help you see the types of errors made by the model when making predictions. E.g. Class A is mostly predicted as class B instead of class C.
Hi Sir Jason Brownlee
Do you have example of source code (java) for multi-class to calculate confusion matrix?
Let say i have 4 class(dos, normal,worms,shellcode) then i want to make a confusion matrix where usually diagonal is true positive value. Accuracy by class(dos)= predicted dos/actual dos and so on then later on accuracy= all the diagonal (tp value)/ total number of instances
Sorry, I don’t have java code.
Concepts explained well but in the example, it is wrongly computed:
Sensitivity should be = TPR = TP/(TP+FN) = 3/(3+2) = 0.6 and
Specificity should be = TNR = TN/(TN+FP) = 4/(4+1) = 0.8.
However Sensitivity is wrongly computed as 0.06667 and Specificity is wrongly computed as 0.75.
I do not believe there is a bug in the R implementation.
If the ‘event’ is 1, then it should be:
Sensitivity = TPR = TP/(TP+FN) = 3/(3+1) = 0.75 and
Specificity = TNR = TN/(TN+FP) = 4/(4+2) = 0.06667
The confusion comes because the ”Positive’ Class : 0′ in the R code. The ‘event’ should be specified in the command:
results <- confusionMatrix(data=predicted, reference=expected, positive='1')
In Python, you can use this code to find the values to put in the above formulas:
tn, fp, fn, tp = confusion_matrix(expected, predicted).ravel()
(tn, fp, fn, tp)
Very nice, thanks for sharing!
hi! i am working on a binary classification problem but the confusion matrix i am getting is something like
[12, 0, 0],
[ 1, 16, 0],
[ 0, 7, 0]
I don’t understand what does the 7 mean? can you please explain?
N.B. It should be
[13, 0],
[0, 23]
Perhaps there is a bug in your code?
Actually there is no bug in the code. The code works fine with other datasets.
So I changed the target vector of the dataset from 2 to 3 and it works better now but the problem remains the same.
Now it looks like this:
[[17, 0, 0, 0],
[ 0, 12, 0, 0],
[ 0, 0, 8, 0],
[ 0, 0, 0, 2]]
Is it because the ANN could not link the 2 values (4th row) with any of the other classes?
There is a typo mistake:
If
men classified as women: 2
woman classified as men: 1
How can confusion matrix be:
men women
men 3 1
women 2 4
The correction:
men classified as women: 1
woman classified as men: 2
I believe it is correct, remember that columns are actual and rows are predicted.
Weka seems to do the opposite. if you do a simple J48 classification on the Iris tutorial data, you get the following
a b c <– classified as
49 1 0 | a = Iris-setosa
0 47 3 | b = Iris-versicolor
0 2 48 | c = Iris-virginica
where we know that there are actually 50 of each type. So for Weka's confusion matrix, the actual count is the sum of entries in a row, not a column. So I'm still confused!
The meaning is the same if the matrix is transposed. It is all about explaining what types of errors were made.
Does that help?
Yes that helps, thanks. Confirms that for the Weka confusion matrix, columns are predicted and rows are actual – the transpose of the definition you are using, as you point out. I hadn’t realised that both formats are in common use.
thank you man! simple explanation
I’m glad it helped.
hy Jason Brownlee
please comment me your email address
You can context me directly here:
https://machinelearningmastery.com/contact
hy
i am using Weka tool and apply DecisionTable model and get following confusion matrix
any one Label it as a TP, TN, FP and FN
Please help me
Thank you for these website, i am an intern my superiors gave me some tasks about machine learning and a.ı and your web site helped me very well thanks a lot Jason
I’m happy to hear that.
Hi, can confusion matrix be used for a large dataset of images?
A confusion matrix summarizes the class outputs, not the images.
It can be used for binary or multi-class classification problems.
hi Sir
Amazing information
Sir is there any machine learning method with which I can do analysis of Survey results.
Yes, s with a question you have about the data, then use the data and models to answer it.
Very nice document , really useful for creating the test case.
Thanks, I’m glad to hear it was useful.
Hi there, I need help.. I’m using weka and the spam base data set from UCI, and the used one of the meta classifiers which is the stacking classifier; which gave 60.59 % accuracy, but the essiue is the true positive TP and the false positive were 0.
What does it mean?
Perhaps try other methods?
Perhaps try transforming the data prior to modeling?
Perhaps try alternate configurations of your algorithm?
Dear Jason, Thanks for an informative article.I have a query that in the given confusion matrix 0 value in FP cell is acceptable or not?
[[ 8 9]
[ 0 15]]
Thanks in advance.
It depends on the goals of your project.
please i have a question i run a code for classification problem
i found good accuracy in training and testing data
i use the confusion matrix but the clasification i found in confusion matrix for classification the number is few than the number of my dataset
m question why? i should find the number of my sample in the confusion matrix by then determine the acual ad predicted value please respond me im confuse
to know the your classification what we us e
Well done!
The total count in the confusion matrix will match the total number of rows in the test set. If this is not the case, ensure you counted correctly in both cases.
Hi Jason,
It will be great if you could interpret the confusionMatrix() i.e.the below parameters.
Accuracy : 0.7
95% CI : (0.3475, 0.9333)
No Information Rate : 0.6
P-Value [Acc > NIR] : 0.3823
Kappa : 0.4
Mcnemar’s Test P-Value : 1.0000
Sensitivity : 0.6667
Specificity : 0.7500
Pos Pred Value : 0.8000
Neg Pred Value : 0.6000
Prevalence : 0.6000
Detection Rate : 0.4000
Detection Prevalence : 0.5000
Balanced Accuracy : 0.7083
‘Positive’ Class : 0
What problem are you having interpreting it yourself exactly?
hello how can i visualize the confusion matrix info displayed in weka results, is it possible to generate the diagram just like python?
Weka will generate an ASCII confusion matrix that you can copy paste into your document.
Hi,
What are counters in confusion matrix?
They are the count of the number of samples classified as each class.
Does that help?
Hi,
If the dataset containing as positive and negative reviews. Can we identify Fake Positive Reviews Rate, Fake Negative Reviews Rate, Real Positive Reviews Rate and Real Negative Reviews Rate using a confusion matrix after applying sentiment classification algorithms on a dataset?
Yes, you could train a model to classify a given review as real or fake – whatever that means.
can we change the positive class to 1 instead of 0 in confusion matrix
Sure, you can present the data any way you wish.
It seems that there is no standard on how the predicted vs. reference values are represented in the rows and columns in the matrix. The carat docs and wikipedia have reference in the columns whereas many blogs show the opposite. I guess it doesn’t matter as long as you know what the library is doing. In your article though, you state:
Expected down the side: Each row of the matrix corresponds to a predicted class.
Predicted across the top: Each column of the matrix corresponds to an actual class.
Is that correct? Shouldn’t it say:
Expected down the side: Each row of the matrix corresponds to an actual class.
Predicted across the top: Each column of the matrix corresponds to a predicted class.
Yes, I have seen both ways and very angry people argue both sides. As long as it’s labeled, it’s okay by me.
hi sir, thank you for such a wonderful explanation.
but I have one doubt in between precision and recall.
can you please explain me in any general example
You’re welcome.
Yes, I have a number of tutorials on this topic scheduled.
For now, I recommend this:
https://en.wikipedia.org/wiki/Precision_and_recall
Explanation of CONFUSION MATRIX – So simply done !!! Beautiful !!! SUPERB !!!
Thanks a LOT – since this is the basis to understand further MODEL PERFORMANCES.
Please advise if you have similar literature on MODEL PERFORMAMNCES ??
Thanks.
Sure:
https://machinelearningmastery.com/tour-of-evaluation-metrics-for-imbalanced-classification/
Great article, thank you.
In the Python confusion matrix example, you pass in the expected array followed by the predictions array:
results = confusion_matrix(expected, predicted)
When I was reviewing the results in the matrix, it seemed wrong, as I was expecting the following based on manually calculating each bucket in my head as follows:
[TP , FP]
[FN, TN]
[[3 2]
[1 4]]
But, I ran your code as-is and go the same result as you did:
[[4 2]
[1 3]]
This didn’t make sense to me because looking at the data set, there are clearly 3 TPs, 2 FPs; 1 FN and 4 TNs.
So, I tried flipping the parameters to:
results = confusion_matrix(predicted, expected)
And now I have the results I expect.
Are there different conventions for presenting a confusion matrix? Thanks.
Thanks for sharing.
I plot confusion matrix of a classification model on unbalancing dataset the bias is zero labels and I got this plot
https://files.fm/u/nynwed55
then I plot the result of the same model but on dataset unbalanced and the bias label is one and I got this plot
https://files.fm/u/ghqxhkx3
after that, I plot it on the balanced dataset
https://files.fm/u/v26g5mbs
what I noticed is that the model tends to classify the bias label good, otherwise It does not classify well. is this a good thing there is something wrong?
I don’t understand. What do you mean exactly?
Ok I have the first dataset who has unbalanced labels (0 for neutral,1 for hate) the number of 0 labels is much larger than 1 label, the confusion matrix is in the first link, the darker color is in the section of 0 is classified as 0, which means the model performs well on the label who has the bias (more) in the dataset, when I test on dataset with 1 is more than zero label the darker color also in the 1 label in second link.
the third link for the balanced dataset
NOW the model performance is acceptable or there is something wrong?
To know if the model is acceptable for your project, you must choose a performance metric by which it can be evaluated that matches the goals of your project and project stakeholders.
A confusion matrix is not a metric, it is an analysis tool.
This will help you choose a metric:
https://machinelearningmastery.com/tour-of-evaluation-metrics-for-imbalanced-classification/
Confusion Matrix Very nicely explained. I have a query, your expert help is required. I did binary prediction through XGboost model and when I obtain the confusion matrix, I get MacNemar Test with p<0.05. How should I interpret it? Is it showing a significant difference between the 1st model when the algorithm started and the last model when the algorithm stopped? If it is not so, then what is it actually telling or if yes, please share academic reference. I obtained the confusion matrix from the caret package in R.
A p<0.05 suggests the difference in sample means is probably real.
Hi Jason,
Thanks for the wonderful post.
Please clarify my doubt. I have plotted the confusion matrix for the test data belonging to two classes of an individual subject. I would like to know if there are multiple subjects, do I have to plot the confusion matrices for all of them individually?
In a journal paper, If I have to project a single confusion matrix representing all the subjects (n=15), how should I go about?
Kindly help me in this regard.
Thanks in advance.
Thanks!
A confusion matrix is used to compare the frequency of predicted classes to expected classes.
If by “subject” you mean classes, then yes.
Dear Dr.Jason,
Thanks for your swift reply!
I mean an individual/a participant of a research study by ‘subject’. I have two classes.
My question is how do I have to plot a single confusion matrix representing all the participants?
Hope I have made my question clearer now.
Thanks in advance.
Perhaps combine all of the outcomes together regardless of participant.
Thanks so much, Dr.Jason.
You’re welcome.
Hello Jason,
I have one question related to TP, FP, FN, TN. it can only define with the binary classification( true or false) or it also can define in multi-class classification.
Typically, yes, but you can also define multiple classes as “positive” and “negative” in order to generalize the idea.
What does it mean exactly? Can you clarify it a little bit more detail? Thanks
I don’t have a worked example sorry. Perhaps I will write a tutorial on this topic.
Where will I get the code of confusionmatrix() function?? Step by step code in R..??
See the above example for a confusion matrix in R.
Hello sir,
what a problem if i do not obtain a total number of confusion mat. ( i used 1000 images for classification) but in confusion matrix result i only get about 300 for (TP, TN, FP AND FN).
what is the reason of that?
thanks
The total predictions in the confusion matrix must match the total predictions made by the model.
If the numbers do not match, perhaps there is a bug in your code.
if we split our dataset into (train and validation set)
the output of confusion matrix depends on validation set? or what?
thanks sir.
Correct. The confusion matrix is calculated on predictions made for the hold out set not used during training.
Hi, do we take prediction on the validation set for the confusion matrix just from the last epoch?
You can if you want.
is it possible to draw confusion matrix for one class???
No.
Hello Jason,
I hope you can enlighten me with this doubt:
I have a multi-class problem of 9 classes, when I use logistic regression the accuracy score is 0.3. The predictor classifies apparently well when looking at the confusion matrix, but it has trouble defining which neighbor to choose (For example when actual value is class #3 it predicts classes 2 , 3 or 4) , same for the rest of the 9 classes. I think the accuracy score is too rigid for my problem, and that is why I am getting it too low . Do you think I should use other metric, which does not penalize so heavily or what would you recommend???
Please let me know if I am not being clear.
Thankyou for your help!
Perhaps this will help you confirm your choice of metric:
https://machinelearningmastery.com/tour-of-evaluation-metrics-for-imbalanced-classification/
Perhaps this will give you ideas on how to improve performance:
https://machinelearningmastery.com/machine-learning-performance-improvement-cheat-sheet/
Hello Jason,
suppose the case where the predict value is not a man nor a woman but just the silence.
In this case it is a FN (False Negative).
How do you represent this fact in the predictive list (not 1 and not 0).
Thank you!
Yassine
PS: the problem can also occur in the case where there are multiple classes
It would be a three class problem: man, woman, unknown.
Can you please help me? I have generated a confusion matrix of a satellite image where the number of misclassified pixels are exactly the same in some other classes…Can it be happen
Perhaps.
Dear Dr. Jason, after performing a 10-fold stratified cross-validation for a binary classification, we will usually proceed to generate the confusion matrix. So, is it a best practice to combine all the 10 confusion matrices as a single confusion matrix for reporting, rather than just generating a single confusion matrix independently that I have seen widely in those Kaggle Notebooks?
If it is best to combine all the 10 confusion matrix, should we calculate the average of these four metrics,True Negative, True positive, False Negative and False Positive, rather than summing them up? What is the notion behind the combination? Also, can you provide a hint on the Python coding for getting the average from the confusion_matrix() method for these 10 confusion matrix? Thank you.
CV and confusion matrix are not compatible.
You either use CV to estimate model performance on unseen data or use a train/test split with a confusion matrix.
Hello Sir, fist of all thank you very much for this great explanation. I would like to ask you that is there the caret library in python? Because I need to calculate specificity and sensitivity. Please help me
You’re welcome.
Yes, see this:
https://machinelearningmastery.com/pycaret-for-machine-learning/
Hello Sir.
I have an image class consisting of 7 categories. (37000 train and 2800 test images) How can I get information about which images were incorrectly predicted as a result of the confusion matrix? For example
image id – — predicted class —- real class
1.jpg———– Class A—————Class B.
Is there a way to do that?
Make predictions manually and inspect the results that were predicted incorrectly. The confusion matrix won’t help.
tell me to two different scenarios where the confusion matrix works and don’t works
Why?
Sounds like a homework question…
yes I can not find the downside of confusion matric
It cannot be used to summarise multiple runs, such as k-fold cross-validation.
It is unreadable with more than 5-10 classes.
Dear Dr. Jason
Is the confusion matrix formed only when the test data is executed?
You can calculate the confusion matrix on any dataset you like, most commonly it is the test set.
Hi, regarding @feereshteh’s question – is it better to create a confusion matrix in the last epoch of training in which we call the validation part (and to have one “if statement” in validation to check if that is the last epoch and then save predicted and expected values) or to save the final model of training and again push all dataset through it? Do you have a link about that regarding neural network training for multiclass classification in TensorFlow or Pytorch?
thx
Same result, it does not matter.
I prefer to save the model, load it and evaluate later.
Hello.
I am using Weka to build my model but i keep getting a large confusion matrix (41×41) and i just want a 2×2 matrix. is there a way to reduce the matrix using weka to a 2×2 matrix ?
kindly help if you can.
If you have 2 classes in your data, you will get a 2×2 confusion matrix.
so basically the size of a confusion matrix is based on the number of classes in your data ?.
Yes.
thank you so much. You’ve really helped me a lot I was really struggling with this issue.
I’m happy to hear that!
hi sir,
I hope you can answer me as soon as possible. I want to comibine the result of multi-class confusion matrix
my problem :
malin1 malin2 malin3 malin4 benin
53 5 2 3 0
7 38 5 0 1
4 6 54 2 11
0 0 3 42 5
0 3 8 3 444
the resulti want to show is
benin malin
444 17
14 219
Perhaps sum the malin?
Perhaps change your class labels in the dataset?
Hi,
I have a classifier where I coded in an “unclassified” category for predictions that fall below a certain probability value. There reference data, however, does not have any instances in that category. When calculating the confusion matrix should I only calculate it based on the predictions that returned a value (i.e. that were NOT labeled as unclassified), or should I be including the unclassified category in the confusion matrix?
Thank you for your help!
Tough question. I guess it is up to you and how you choose to evaluate the model / present performance to stakeholders.
When I go through the confusion matrix in Weka, what I understood is
Each row of the matrix corresponds to a actual class.
Each column of the matrix corresponds to an predicted class.
Please clarify.
You’re correct.
hello Juson Sir, hope you are doing well.
I read the recommended files regarding the initial stage of Machine learning which is really very helpful to understanding the initial concepts.
I have a question regarding the PLS-DA model. In the PLS-DA model, which information we get from the ROC curve. I really didn’t get the concept of the ROC curve exactly, please tell me about it,
I am looking forward to your kind response.
THANKS IN ADVANCE.
I think this post would help: https://machinelearningmastery.com/roc-curves-and-precision-recall-curves-for-classification-in-python/
Thanks for the article.
What is a possible problem with using confusion matrix to calculate performance of a classification model?
Hi rey…the following may be of interest to you:
https://www.youtube.com/watch?v=-lPfAh462Fg