
Instead of predicting class values directly for a classification problem, it can be convenient to predict the probability of an observation belonging to each possible class.
Predicting probabilities allows some flexibility including deciding how to interpret the probabilities, presenting predictions with uncertainty, and providing more nuanced ways to evaluate the skill of the model.
Predicted probabilities that match the expected distribution of probabilities for each class are referred to as calibrated. The problem is, not all machine learning models are capable of predicting calibrated probabilities.
There are methods to both diagnose how calibrated predicted probabilities are and to better calibrate the predicted probabilities with the observed distribution of each class. Often, this can lead to better quality predictions, depending on how the skill of the model is evaluated.
In this tutorial, you will discover the importance of calibrating predicted probabilities and how to diagnose and improve the calibration of models used for probabilistic classification.
After completing this tutorial, you will know:
- Nonlinear machine learning algorithms often predict uncalibrated class probabilities.
- Reliability diagrams can be used to diagnose the calibration of a model, and methods can be used to better calibrate predictions for a problem.
- How to develop reliability diagrams and calibrate classification models in Python with scikit-learn.
Kick-start your project with my new book Probability for Machine Learning, including step-by-step tutorials and the Python source code files for all examples.
Let’s get started.

How and When to Use a Calibrated Classification Model with scikit-learn
Photo by Nigel Howe, some rights reserved.
Tutorial Overview
This tutorial is divided into four parts; they are:
- Predicting Probabilities
- Calibration of Predictions
- How to Calibrate Probabilities in Python
- Worked Example of Calibrating SVM Probabilities
Predicting Probabilities
A classification predictive modeling problem requires predicting or forecasting a label for a given observation.
An alternative to predicting the label directly, a model may predict the probability of an observation belonging to each possible class label.
This provides some flexibility both in the way predictions are interpreted and presented (choice of threshold and prediction uncertainty) and in the way the model is evaluated.
Although a model may be able to predict probabilities, the distribution and behavior of the probabilities may not match the expected distribution of observed probabilities in the training data.
This is especially common with complex nonlinear machine learning algorithms that do not directly make probabilistic predictions and instead use approximations.
The distribution of the probabilities can be adjusted to better match the expected distribution observed in the data. This adjustment is referred to as calibration, as in the calibration of the model or the calibration of the distribution of class probabilities.
[…] we desire that the estimated class probabilities are reflective of the true underlying probability of the sample. That is, the predicted class probability (or probability-like value) needs to be well-calibrated. To be well-calibrated, the probabilities must effectively reflect the true likelihood of the event of interest.
— Page 249, Applied Predictive Modeling, 2013.
Calibration of Predictions
There are two concerns in calibrating probabilities; they are diagnosing the calibration of predicted probabilities and the calibration process itself.
Reliability Diagrams (Calibration Curves)
A reliability diagram is a line plot of the relative frequency of what was observed (y-axis) versus the predicted probability frequency (x-axis).
Reliability diagrams are common aids for illustrating the properties of probabilistic forecast systems. They consist of a plot of the observed relative frequency against the predicted probability, providing a quick visual intercomparison when tuning probabilistic forecast systems, as well as documenting the performance of the final product
— Increasing the Reliability of Reliability Diagrams, 2007.
Specifically, the predicted probabilities are divided up into a fixed number of buckets along the x-axis. The number of events (class=1) are then counted for each bin (e.g. the relative observed frequency). Finally, the counts are normalized. The results are then plotted as a line plot.
These plots are commonly referred to as ‘reliability‘ diagrams in forecast literature, although may also be called ‘calibration‘ plots or curves as they summarize how well the forecast probabilities are calibrated.
The better calibrated or more reliable a forecast, the closer the points will appear along the main diagonal from the bottom left to the top right of the plot.
The position of the points or the curve relative to the diagonal can help to interpret the probabilities; for example:
- Below the diagonal: The model has over-forecast; the probabilities are too large.
- Above the diagonal: The model has under-forecast; the probabilities are too small.
Probabilities, by definition, are continuous, so we expect some separation from the line, often shown as an S-shaped curve showing pessimistic tendencies over-forecasting low probabilities and under-forecasting high probabilities.
Reliability diagrams provide a diagnostic to check whether the forecast value Xi is reliable. Roughly speaking, a probability forecast is reliable if the event actually happens with an observed relative frequency consistent with the forecast value.
— Increasing the Reliability of Reliability Diagrams, 2007.
The reliability diagram can help to understand the relative calibration of the forecasts from different predictive models.
Want to Learn Probability for Machine Learning
Take my free 7-day email crash course now (with sample code).
Click to sign-up and also get a free PDF Ebook version of the course.
Probability Calibration
The predictions made by a predictive model can be calibrated.
Calibrated predictions may (or may not) result in an improved calibration on a reliability diagram.
Some algorithms are fit in such a way that their predicted probabilities are already calibrated. Without going into details why, logistic regression is one such example.
Other algorithms do not directly produce predictions of probabilities, and instead a prediction of probabilities must be approximated. Some examples include neural networks, support vector machines, and decision trees.
The predicted probabilities from these methods will likely be uncalibrated and may benefit from being modified via calibration.
Calibration of prediction probabilities is a rescaling operation that is applied after the predictions have been made by a predictive model.
There are two popular approaches to calibrating probabilities; they are the Platt Scaling and Isotonic Regression.
Platt Scaling is simpler and is suitable for reliability diagrams with the S-shape. Isotonic Regression is more complex, requires a lot more data (otherwise it may overfit), but can support reliability diagrams with different shapes (is nonparametric).
Platt Scaling is most effective when the distortion in the predicted probabilities is sigmoid-shaped. Isotonic Regression is a more powerful calibration method that can correct any monotonic distortion. Unfortunately, this extra power comes at a price. A learning curve analysis shows that Isotonic Regression is more prone to overfitting, and thus performs worse than Platt Scaling, when data is scarce.
— Predicting Good Probabilities With Supervised Learning, 2005.
Note, and this is really important: better calibrated probabilities may or may not lead to better class-based or probability-based predictions. It really depends on the specific metric used to evaluate predictions.
In fact, some empirical results suggest that the algorithms that can benefit the more from calibrating predicted probabilities include SVMs, bagged decision trees, and random forests.
[…] after calibration the best methods are boosted trees, random forests and SVMs.
— Predicting Good Probabilities With Supervised Learning, 2005.
How to Calibrate Probabilities in Python
The scikit-learn machine learning library allows you to both diagnose the probability calibration of a classifier and calibrate a classifier that can predict probabilities.
Diagnose Calibration
You can diagnose the calibration of a classifier by creating a reliability diagram of the actual probabilities versus the predicted probabilities on a test set.
In scikit-learn, this is called a calibration curve.
This can be implemented by first calculating the calibration_curve() function. This function takes the true class values for a dataset and the predicted probabilities for the main class (class=1). The function returns the true probabilities for each bin and the predicted probabilities for each bin. The number of bins can be specified via the n_bins argument and default to 5.
For example, below is a code snippet showing the API usage:
|
1 2 3 4 5 6 7 8 9 10 |
... # predict probabilities probs = model.predic_proba(testX)[:,1] # reliability diagram fop, mpv = calibration_curve(testy, probs, n_bins=10) # plot perfectly calibrated pyplot.plot([0, 1], [0, 1], linestyle='--') # plot model reliability pyplot.plot(mpv, fop, marker='.') pyplot.show() |
Calibrate Classifier
A classifier can be calibrated in scikit-learn using the CalibratedClassifierCV class.
There are two ways to use this class: prefit and cross-validation.
You can fit a model on a training dataset and calibrate this prefit model using a hold out validation dataset.
For example, below is a code snippet showing the API usage:
|
1 2 3 4 5 6 7 8 9 10 11 12 13 |
... # prepare data trainX, trainy = ... valX, valy = ... testX, testy = ... # fit base model on training dataset model = ... model.fit(trainX, trainy) # calibrate model on validation data calibrator = CalibratedClassifierCV(model, cv='prefit') calibrator.fit(valX, valy) # evaluate the model yhat = calibrator.predict(testX) |
Alternately, the CalibratedClassifierCV can fit multiple copies of the model using k-fold cross-validation and calibrate the probabilities predicted by these models using the hold out set. Predictions are made using each of the trained models.
For example, below is a code snippet showing the API usage:
|
1 2 3 4 5 6 7 8 9 10 11 |
... # prepare data trainX, trainy = ... testX, testy = ... # define base model model = ... # fit and calibrate model on training data calibrator = CalibratedClassifierCV(model, cv=3) calibrator.fit(trainX, trainy) # evaluate the model yhat = calibrator.predict(testX) |
The CalibratedClassifierCV class supports two types of probability calibration; specifically, the parametric ‘sigmoid‘ method (Platt’s method) and the nonparametric ‘isotonic‘ method which can be specified via the ‘method‘ argument.
Worked Example of Calibrating SVM Probabilities
We can make the discussion of calibration concrete with some worked examples.
In these examples, we will fit a support vector machine (SVM) to a noisy binary classification problem and use the model to predict probabilities, then review the calibration using a reliability diagram and calibrate the classifier and review the result.
SVM is a good candidate model to calibrate because it does not natively predict probabilities, meaning the probabilities are often uncalibrated.
A note on SVM: probabilities can be predicted by calling the decision_function() function on the fit model instead of the usual predict_proba() function. The probabilities are not normalized, but can be normalized when calling the calibration_curve() function by setting the ‘normalize‘ argument to ‘True‘.
The example below fits an SVM model on the test problem, predicted probabilities, and plots the calibration of the probabilities as a reliability diagram,
|
1 2 3 4 5 6 7 8 9 10 11 12 13 14 15 16 17 18 19 20 21 22 |
# SVM reliability diagram from sklearn.datasets import make_classification from sklearn.svm import SVC from sklearn.model_selection import train_test_split from sklearn.calibration import calibration_curve from matplotlib import pyplot # generate 2 class dataset X, y = make_classification(n_samples=1000, n_classes=2, weights=[1,1], random_state=1) # split into train/test sets trainX, testX, trainy, testy = train_test_split(X, y, test_size=0.5, random_state=2) # fit a model model = SVC() model.fit(trainX, trainy) # predict probabilities probs = model.decision_function(testX) # reliability diagram fop, mpv = calibration_curve(testy, probs, n_bins=10, normalize=True) # plot perfectly calibrated pyplot.plot([0, 1], [0, 1], linestyle='--') # plot model reliability pyplot.plot(mpv, fop, marker='.') pyplot.show() |
Running the example creates a reliability diagram showing the calibration of the SVMs predicted probabilities (solid line) compared to a perfectly calibrated model along the diagonal of the plot (dashed line.)
We can see the expected S-shaped curve of a conservative forecast.
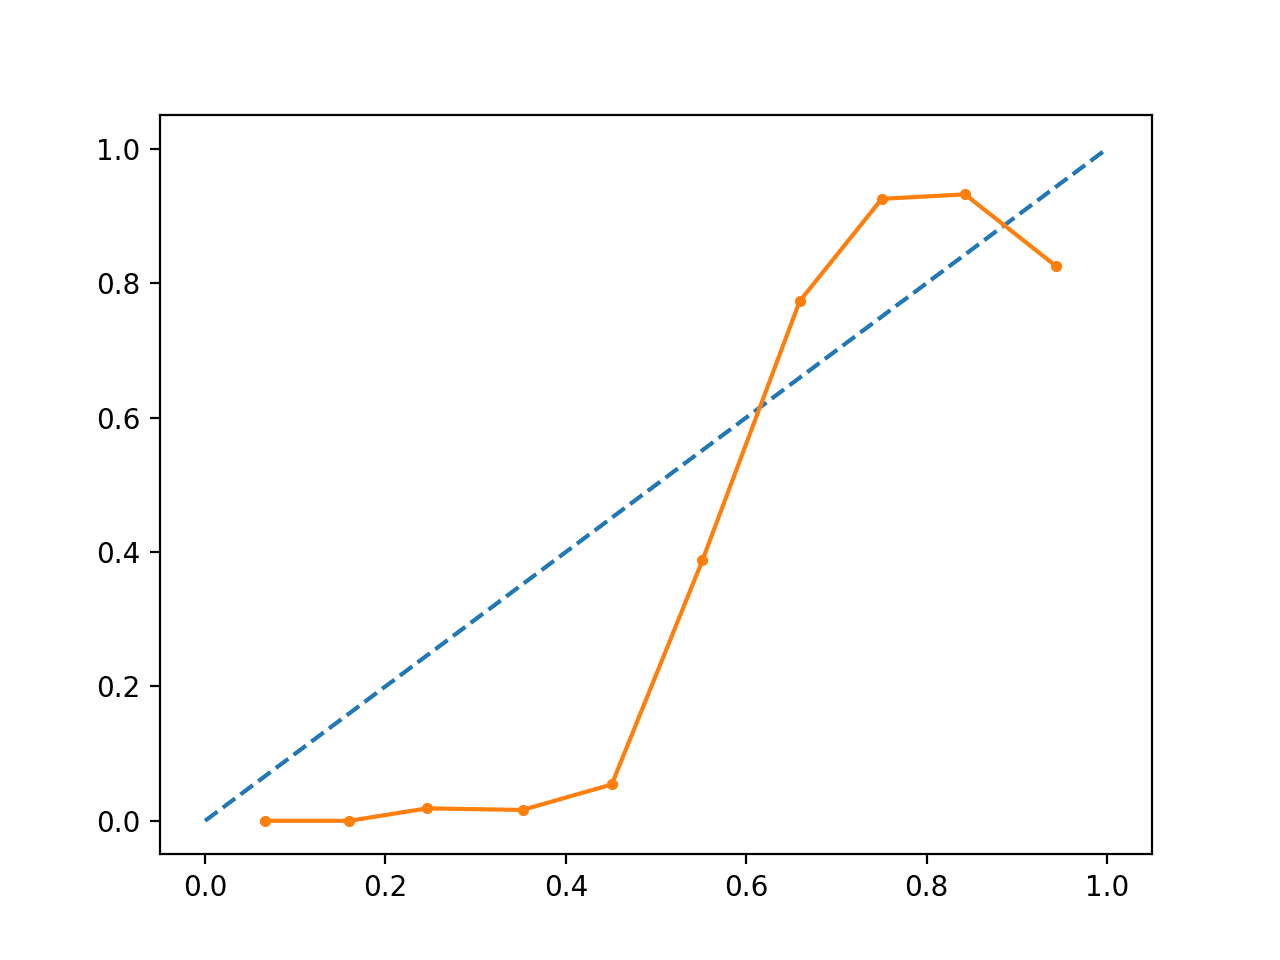
Uncalibrated SVM Reliability Diagram
We can update the example to fit the SVM via the CalibratedClassifierCV class using 5-fold cross-validation, using the holdout sets to calibrate the predicted probabilities.
The complete example is listed below.
|
1 2 3 4 5 6 7 8 9 10 11 12 13 14 15 16 17 18 19 20 21 22 23 24 |
# SVM reliability diagram with calibration from sklearn.datasets import make_classification from sklearn.svm import SVC from sklearn.calibration import CalibratedClassifierCV from sklearn.model_selection import train_test_split from sklearn.calibration import calibration_curve from matplotlib import pyplot # generate 2 class dataset X, y = make_classification(n_samples=1000, n_classes=2, weights=[1,1], random_state=1) # split into train/test sets trainX, testX, trainy, testy = train_test_split(X, y, test_size=0.5, random_state=2) # fit a model model = SVC() calibrated = CalibratedClassifierCV(model, method='sigmoid', cv=5) calibrated.fit(trainX, trainy) # predict probabilities probs = calibrated.predict_proba(testX)[:, 1] # reliability diagram fop, mpv = calibration_curve(testy, probs, n_bins=10, normalize=True) # plot perfectly calibrated pyplot.plot([0, 1], [0, 1], linestyle='--') # plot calibrated reliability pyplot.plot(mpv, fop, marker='.') pyplot.show() |
Running the example creates a reliability diagram for the calibrated probabilities.
The shape of the calibrated probabilities is different, hugging the diagonal line much better, although still under-forecasting in the upper quadrant.
Visually, the plot suggests a better calibrated model.
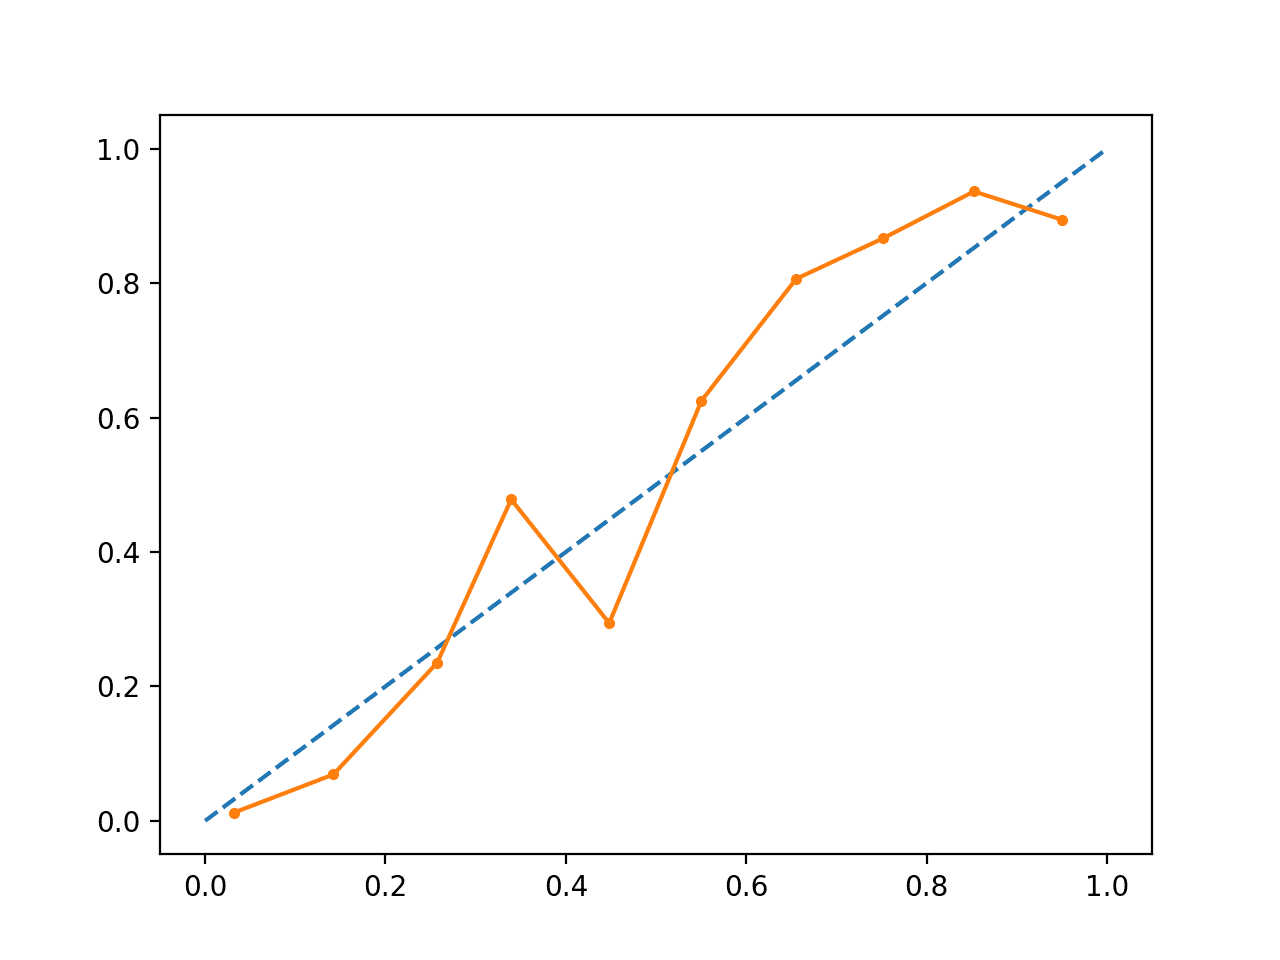
Calibrated SVM Reliability Diagram
We can make the contrast between the two models more obvious by including both reliability diagrams on the same plot.
The complete example is listed below.
|
1 2 3 4 5 6 7 8 9 10 11 12 13 14 15 16 17 18 19 20 21 22 23 24 25 26 27 28 29 30 31 32 33 34 35 36 37 38 39 40 41 42 43 |
# SVM reliability diagrams with uncalibrated and calibrated probabilities from sklearn.datasets import make_classification from sklearn.svm import SVC from sklearn.calibration import CalibratedClassifierCV from sklearn.model_selection import train_test_split from sklearn.calibration import calibration_curve from matplotlib import pyplot # predict uncalibrated probabilities def uncalibrated(trainX, testX, trainy): # fit a model model = SVC() model.fit(trainX, trainy) # predict probabilities return model.decision_function(testX) # predict calibrated probabilities def calibrated(trainX, testX, trainy): # define model model = SVC() # define and fit calibration model calibrated = CalibratedClassifierCV(model, method='sigmoid', cv=5) calibrated.fit(trainX, trainy) # predict probabilities return calibrated.predict_proba(testX)[:, 1] # generate 2 class dataset X, y = make_classification(n_samples=1000, n_classes=2, weights=[1,1], random_state=1) # split into train/test sets trainX, testX, trainy, testy = train_test_split(X, y, test_size=0.5, random_state=2) # uncalibrated predictions yhat_uncalibrated = uncalibrated(trainX, testX, trainy) # calibrated predictions yhat_calibrated = calibrated(trainX, testX, trainy) # reliability diagrams fop_uncalibrated, mpv_uncalibrated = calibration_curve(testy, yhat_uncalibrated, n_bins=10, normalize=True) fop_calibrated, mpv_calibrated = calibration_curve(testy, yhat_calibrated, n_bins=10) # plot perfectly calibrated pyplot.plot([0, 1], [0, 1], linestyle='--', color='black') # plot model reliabilities pyplot.plot(mpv_uncalibrated, fop_uncalibrated, marker='.') pyplot.plot(mpv_calibrated, fop_calibrated, marker='.') pyplot.show() |
Running the example creates a single reliability diagram showing both the calibrated (orange) and uncalibrated (blue) probabilities.
It is not really an apples-to-apples comparison as the predictions made by the calibrated model are in fact a combination of five submodels.
Nevertheless, we do see a marked difference in the reliability of the calibrated probabilities (very likely caused by the calibration process).
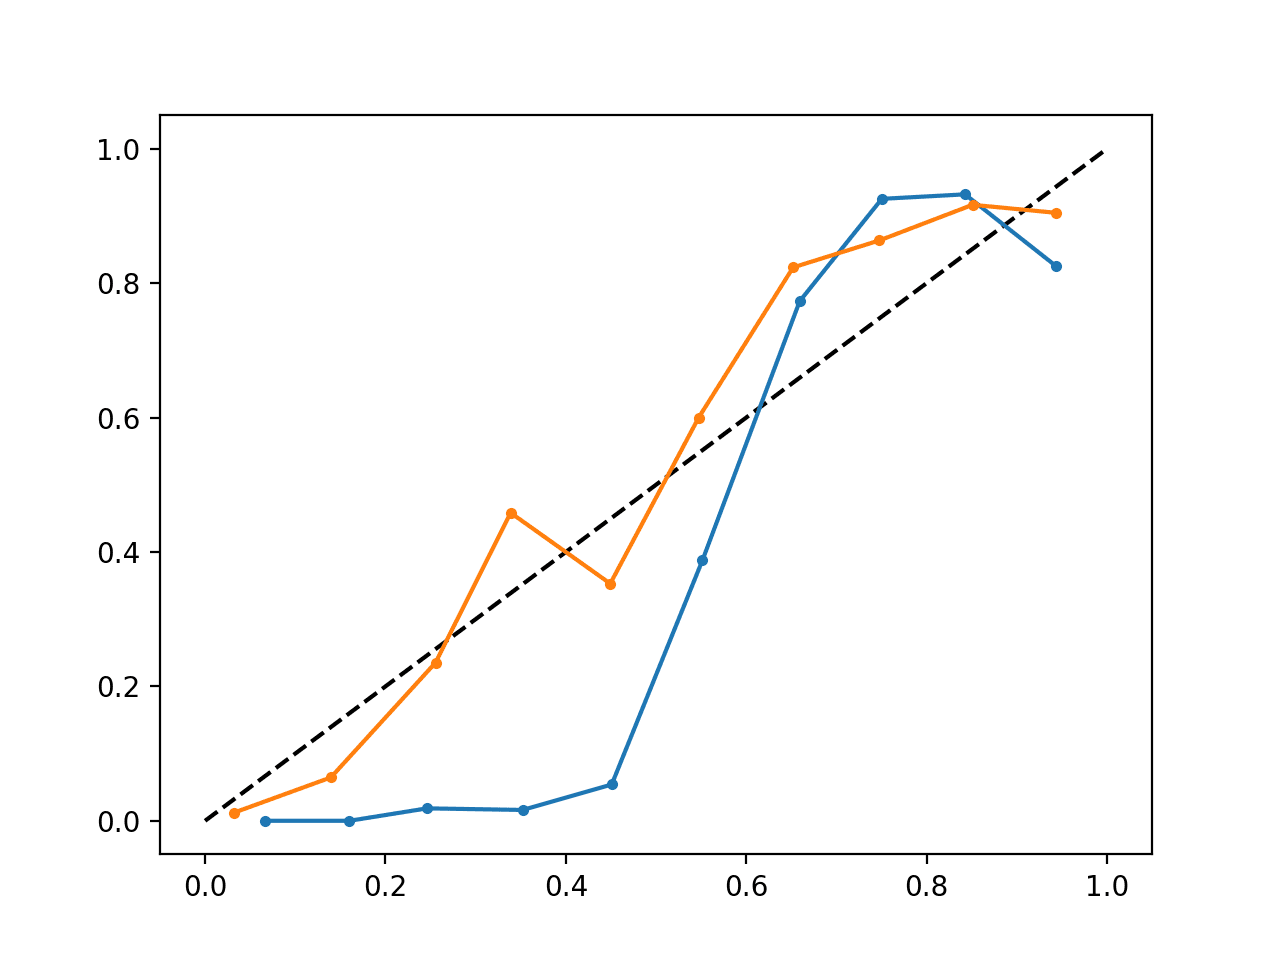
Calibrated and Uncalibrated SVM Reliability Diagram
Further Reading
This section provides more resources on the topic if you are looking to go deeper.
Books and Papers
- Applied Predictive Modeling, 2013.
- Predicting Good Probabilities With Supervised Learning, 2005.
- Obtaining calibrated probability estimates from decision trees and naive Bayesian classifiers, 2001.
- Increasing the Reliability of Reliability Diagrams, 2007.
API
- sklearn.calibration.CalibratedClassifierCV API
- sklearn.calibration.calibration_curve API
- Probability calibration, scikit-learn User Guide
- Probability Calibration curves, scikit-learn
- Comparison of Calibration of Classifiers, scikit-learn
Articles
- CAWCAR Verification Website
- Calibration (statistics) on Wikipedia
- Probabilistic classification on Wikipedia
- Scikit correct way to calibrate classifiers with CalibratedClassifierCV on CrossValidated
Summary
In this tutorial, you discovered the importance of calibrating predicted probabilities and how to diagnose and improve the calibration of models used for probabilistic classification.
Specifically, you learned:
- Nonlinear machine learning algorithms often predict uncalibrated class probabilities.
- Reliability diagrams can be used to diagnose the calibration of a model, and methods can be used to better calibrate predictions for a problem.
- How to develop reliability diagrams and calibrate classification models in Python with scikit-learn.
Do you have any questions?
Ask your questions in the comments below and I will do my best to answer.
Get a Handle on Probability for Machine Learning!
Develop Your Understanding of Probability
...with just a few lines of python codeDiscover how in my new Ebook:
Probability for Machine Learning
It provides self-study tutorials and end-to-end projects on:
Bayes Theorem, Bayesian Optimization, Distributions, Maximum Likelihood, Cross-Entropy, Calibrating Models
and much more...


I wish you include the last 2 tutorials in “Machine learning mastery with Python”.
Thanks. They may be a little advanced for that beginner book.
Thanks for this, very interesting but on my Gradient Descent Boosting UK horse racing ratings it did not improve performance sadly
Thanks, nice one for trying!
Correction actually I was taking the code for creating the calibration plot from another example and I was setting normalize to True. For horse racing you really want to take the probabilities as is and when I did this the probabilities were pretty well calibrated without adjustment
Is there a Python Sklearn function the measures the fit of the calibration curve ie a kind of MSE on the curve
log loss of the predicted probabilities would achieve this:
https://machinelearningmastery.com/how-to-score-probability-predictions-in-python/
Thanks, very useful.
I’m happy to hear that.
In reliability plot, how to plot observed values on y-axis bins. For eg: what can be possible value for a 0.2 bin on y-axis. May be a detailed illustration of the reliability plot will be helpful. Thank you.
Good question, I would expect that the calculated bins will be accessible some how, I don’t have an example.
This is a great article – could you explain a but more about how to calibrate with an oversampled dataset (which will have produced incorrect probabilities) – should you adjust the probabilities to account for the oversampling yourself, before calibration, or after, or should you just use the weights parameter within the fit() function ? Any thoughts?
You could fit with an oversampled dataset, but calibrate with an un-touched validation dataset.
Yet another cool contribution of yours to ML community, as usual!
Could you please indicate how this approach may be used with a random forest as a classifier — as RF doesn’t output a decision function as SVC.
Many thanks.
You can use the calibration method directly.
Perhaps I don’t understand the problem you’re having?
Hi, again.
Please disregard my previous question — it seems that returning predict_proba(testX)[:, 1] in the function uncalibrated (when using a random forest) resolves my issue.
Thanks,
M.
No problem.
Hi Jason,
Would it be possible to use CalibratedClassifierCV to calibrate a non scikit learn model? For example, how would I go about calibrating a classifier written in tensorflow?
Thanks,
Jen
Perhaps, but you may need to wrap the model to look like a sklearn classifier (like we can do in Keras).
Hi Jason , thanks for making such detailed explanation! I’ve been reading about these issues as I am trying to look for the best way of comparing different classifiers performances, and it is very common to use the ROC curve and the AUC. However, as you posted here, “not all machine learning models are capable of predicting calibrated probabilities”, so i guess it only make sense to speak about probabilities and thresholds for some classifiers only. But most of the models in sklearn either have the .predict_prob() method or the .decision_function() one, so i would like to know which specific models are we talking about here. I don’t see what it means to choose the threshole for a model that doesn’t return a decision function (like in a decision tree for example), but it does have a predict_prob() method nevertheless.
In simple words, which classifiers can I compare using the ROC and callibrate the probabilities?
Simple models are built on a probabilistic model, such as logistic regression, whereas many nonlinear methods don’t operate that way.
One approach might be to treat models separately with and without calibration, throw them all in the mix and see what performs best in your comparison. The calibration won’t hurt probabilistic models like logistic regression and will help non-probabilistic models.
Could you please elaborate more on how can this be extended to multi-class problems?
Is there a specific aspect that you’re having trouble with?
Hi Janson, when I try to run on multi-class, the calibration_curve is throwing error as “bad input shape.
“fop_uncalibrated, mpv_uncalibrated = calibration_curve(testy, yhat_uncalibrated, n_bins=10, normalize=True)”
testy size is [59, 8], np_utils categorical data.
yhat_uncalibrated size is [59, 8], which is “model.decision_function(testX)” output.
Yes, the implementation is for binary classification only as far as I recall.
Okay, thank you for the information. If I want to implement it for multi-class how can I do that. Can you suggest a way
Sorry, I don’t have an example. I cannot give you off the cuff advice.
Hi!
Thanks so much for this post, it’s been extremely useful!
I’ve been running a random forest and applying the calibration as you suggest here, but now the size of the dataset is increasing and I might need to shift to Spark. Do you know if there is a way of doing the calibration on Spark?
Thanks!
Sorry, I don’t know about Spark.
Thanks! =)
No problem.
Hello.
Can calibration change relative position of predictions for some objects? I mean, if predicted probability for object1 is greater than that for object2 before calibration, but it is contrariwise after.
If not, does it mean that calibration doesn’t affect ROC-AUC score?
Thank you!
It often does not, but it may, e.g. for probabilities around the threshold.
I would expect the ROC to change after calibration!
Hi, How can I do a gridseach along with CaliberatedClassifierCV to tune my parameters?
I’m not sure, perhaps try using the CalibrateClassifier without the CV as part of a pipeline inside a gridsearchcv?
Hi Jason, I’m wondering if you happen to think about this issue further related to performing a GridSearch for tuning parameters and then calibrating afterwards. It’s an interesting problem and I haven’t come across much discussion related to this.
Ideally, calibration would be part of the modeling pipeline and evalutaed within the test harness.
Awesome 🙂
Thanks!
Very well explained! Thank you!
Thanks!
Is it really necessary to use CalibratedClassifierCV within a SVC?
I think you get a 5 fold CV calibration using sv = SVC(probabilities=True). Right?
It will use cv to estimate the corrected probabilities, not to evaluate the model.
Thank you!
So would you recommend using CalibratedClassifierCV instead or does it depend on the use casw?
I generally use it in practice.
Hi Jason,
Can you please explain me about generating calibration_curve on multi class classifier probabilities.
Sorry, I don’t have an example. It might not make sense, I have only seen it for binary classes (I think).
What you have to do is to use an one-vs-all-approach to transform your multi-class problem into many binary problems (for each class). After that you are able to create a calibration curve for every class seperately. So what I did was to use CalibratedClassifierCV to calibrate my classifier. In the next step you an OneVsRestClassifier with your previously calibrated classifier. After fitting the OneVsRestClassifier provides a field named base_estimators and with each of them you can create a calibration curve, since all of these represent a binary classifier (for each class resprectively). See the explanation at https://scikit-learn.org/stable/modules/calibration.html#multiclass-support and especially https://citeseerx.ist.psu.edu/viewdoc/download?doi=10.1.1.13.7457&rep=rep1&type=pdf
hope this helps
Thanks for sharing. That seems reasonable.
Hi Jason, Thanks for all your help! I am working on a pet project of mine and I have been ranking instances in the positive class in the decreasing order of their probabilities generated by XGBoost. From your article, I can see that calibration is basically rescaling. This was my understanding as well. However, I find that the order of candidates is changing as well once I choose to sort based on calibrated class probabilities. For example:: 0.94 became 0.91 and 0.85 became 0.95 after calibration. This changes the order of instances (ranking). In some cases, the probabilities dropped by 0.2 which is a margin.
If the underlying mechanism for calibration is Logistic regression on probs generated by the model to predict the actual outcome why does it not scale and cause this change in order? Please correct me if I have made any wrong assumptions here. Thanks!
Note: the calibration method I used was sigmoid.
Yes, think of it as a non-linear mapping from uncalibrated probs to calibrated probs.
E.g. one probability distribution function to another.
Hey man, same doubt.
Take a look here:
https://scikit-learn.org/stable/modules/calibration.html#calibration
”
CalibratedClassifierCV uses a cross-validation approach to fit both the classifier and the regressor. For each of the k (trainset, testset) couple, a classifier is trained on the train set, and its predictions on the test set are used to fit a regressor. We end up with k (classifier, regressor) couples where each regressor maps the output of its corresponding classifier into [0, 1]. Each couple is exposed in the calibrated_classifiers_ attribute, where each entry is a calibrated classifier with a predict_proba method that outputs calibrated probabilities.
->>>The output of predict_proba for the main CalibratedClassifierCV instance corresponds to the AVERAGE of the predicted probabilities of the k estimators in the calibrated_classifiers_ list.
The output of predict is the class that has the highest probability.
“
Thanks for sharing.
mmmm it should not be the case as you are averaging monotonically functions. It may occur because some observations, which were close (e.g. 0.0021 and 0.002), may get “squished” together, being rounded. The ranking, the AUC, should be almost the same
Hi Jason!
I’m a bit confused and maybe you can help me.
When I use a different strategy for calibration, the predictions of the model change. I was trying different methods (platt, isotonic, prefit, cv) just to get an idea of what is going on. But I found my predictions change everytime. I am working with text data, classifying 25 classes.
Best,
Vera
Yes. Perhaps pick a metric and optimize it via CV or a hold out validation set.
Hello, I would like to know if it is possible to perform the calibration with more than two classes? If so, how to do it?
Thanks
It may be possible. I don’t have a tutorial on the topic, sorry.
How do we finalize the model? Usually, after we are happy with the a model, we fit it on all of the data. Is that the same with calibration? Thanks!
Yes, but you will need a validation set or a CV procedure for the final model to calibrate.
So if I understand correctly, using the example below, the model is finalized in step 3 and then can be used to predict new data (step 4)?
1) model=RandomForestClassifier()
2) calibrated=CalibratedClassifierCV(model, method=’sigmoid’, cv=5)
3) calibrated.fit(X_train,y_train)
4)calibrated_probs = calibrated.predict_proba(X)[:,1]
Yes.
I’m confused about the datasets splits we choose here. Why do you calibrate on the training data? That is, the same data the classifier trained on? Doesn’t that cause bias?
Let’s say we using xgboost. Can we do the following:
1. Find the best parameters (train) the classifier on the train data
2. Measure the perfomance of our model using the test data
3. Train the calibrator on the test data
4. Mesure the performance of our calibrator using the training data
5. Retrain the classifier on the train+test data
Or maybe:
1. Find the best parameters (train) the classifier on the train data
2. Measure the perfomance of our model using the test data
3. Retrain the classifier on the train+test data
4. Train the calibrator on the separate calibration data
5. Measure the perfomance of our calibrator using the train+test data
Hi Maciej…The following resource provides best practices for train/test splits:
https://machinelearningmastery.com/training-validation-test-split-and-cross-validation-done-right/
Is saving/loading the calibratedclassifiercv the same as any other model? I have tried saving and loading the calibrated and running predictions, but they end up being way off from when the model is originally created, thanks!
Yes, I believe so.
Sorry to hear that you are having trouble. Perhaps try posting your code and error to stackoverflow?
This is great for reading and can be useful for predictions in classifier. I believe i will now always would like to do this exercise to see how my predictions are compared to calibrated ones. Thanks a lot sir.
Thanks!
sorry i don’t get what you mean by : Below the diagonal: The model has over-forecast; the probabilities are too large.
Above the diagonal: The model has under-forecast; the probabilities are too small. surely if the curve is below the line then we are under foreceasting?? e..g given probability of 0.5, a perfect classifier will predict 0.5 of population will be posotives. however if our model is saying given probabliluty 0.5 the proportion is actually 0.4 then we are underestimating the positives?
Sorry, perhaps I did a poor job of explaining.
Perhaps the section “Reliability diagram” in this will help:
https://www.cawcr.gov.au/projects/verification/
hi jason would really appreciate if you could shed some light on the probem i am having here: https://datascience.stackexchange.com/questions/77445/why-does-my-calibration-curve-for-platts-and-isotonic-have-less-points-than-my-u , is this something that can happen? am i using it correcty
Perhaps you can summarize your question in a sentence or two?
ok, say i fit a classifier using my training data (from grid search e.g. xgboost). i then run calibration calling ‘prefit’ variable, and this fit this calibrated classifier on training data – why can i not do this? — apparently you cannot
Why can’t you do it? I have not tried, I’m curious.
Perhaps just fit the model again with the chosen hyperparameters and calibration?
because accoridng to the documentation the data must be disjoint from the one used for training.
Yes, perhaps prepare a hold out dataset, or split some data off from train – e.g. manually.
Dear Jason,
Thank you for the useful tutorial.
I would like to know what the difference is between “confidence calibration” and “joint calibration”?
would you mind please editing this tutorial to add these definitions?
Thank you in advance to consider our requirements.
Best
Maryam
Thanks for the suggestion.
Where did you hear these terms?
Dear Jason,
I am grateful for your quick response.
I would like to search for bayesian deep learning and uncertainty and in these papers I have faced some definition about calibration that I could not understand:
1- Pitfalls of In-Domain Uncertainty Estimation and Ensembling in Deep Learning
2-On Calibration of Modern Neural Networks
would you mind explaining how to apply calibration in detail?
Thank you in advance
Maryam
Thanks for the suggestion, perhaps in the future.
Hi, I would like to have your opinion to a question/idea I just asked on the “Cross Validated” site, about a global measure for calibration. Here is the link https://stats.stackexchange.com/questions/487179/calibration-measure-for-classification-with-linear-slope .
It would gladly help if you have already some papers about it!
Thanks for your great work and advice!
This is a common question I answer here:
https://machinelearningmastery.com/faq/single-faq/can-you-comment-on-my-stackoverflow-question
Perhaps you can summarize your question for me.
Thanks for the tutorial, very helpful! One question: Suppose I first split my data into a test set and a train set. Then I do random search with k-fold cross validation to find the best hyperparameters or algorithm, and then fit the best one with the entire training set. Finally, I would then like to calibrate my model (i.e., using the prefit method). For that I would need another holdout set completely independent of the others, right (what you call valX, valY above, so train to train the classifier, val for calibration, and test as the final test set). Or is there another less data-intensive way? Like using the same data as used for training the classifier for doing the calibration through applying k-fold cross validation to the calibrator?
Yes, you can use CV to determine the calibration for the model as well using the entire dataset. This is the default approach in sklearn.
Thank you Jason, thought so. What shook my confidence is the following sentence in the sklearn user guide:
“It is up to the user make sure that the data used for fitting the classifier is disjoint from the data used for fitting the regressor.” (scikit-learn.org/stable/modules/calibration.html)
which seems to suggest otherwise. Do you know why that is?
Maybe to clarify what I mean: My point is that if I want to *prefit* my classifier and only then apply CalibratedClassifierCV to fit only the regressor, then I need to store my train/test split(s) from training the classifier and hand them over to the cv argument of CalibratedClassifierCV. Because otherwise the splits will be different and the regressor will be fit on data on the classifier has been fit on. (this is independent of using kfold with k>1 or simply k=1)
I came to this conclusion because I understood the sklearn documentation like so:
CalibratedClassifier(my_clf, cv = 5) –> For each train/test split, my_clf is fit on train set and the regressor is fit based on my_clf.predict_proba(test_set). The decisive thing is that within each fold train data is disjoint from test data.
CalibratedClassifier(my_clf, cv = ‘prefit’) –> Does not perform CV. Just fits the regressor based on whatever data is passed.
Phased more succinctly still: I cannot use *all* data to fit one classifier (my_clf), and then use CalibratedClassifierCV(my_clf, cv = ‘prefit), simply because there is no data left that my_clf has not seen.
In other words, CalibratedClassifierCV can use k-fold CV in the way it does only because it later outputs an average of predictions of the k models it has fitted, but never an output of a model that has been fitted on all data at once.
Yes.
Right. Prefit means no cv and you would calibrate using data not seen during training (ideally)
Hmm, not off hand.
Calibrating on a separate dataset would be nice/wise if you have the data to spare. We rarely do.
Hey Jason,
though late I just wanted to say thank you for responding to my extensive posts!
So, thanks! 🙂
You’re welcome.
I am teaching a masters level machine learning class and was looking for a quick way to implement AIC/BIC for linear and logistic regression in Python’s Scikit-learn module. I came across your page. Question: Is there an error in the formulas for the AIC/BIC for linear regression? The mean square error (divided by sigma^2) is already the log-likelihood. Why are you taking its log again? Also, the second term must be multiplied by the estimated sigma. I would rewrite the function as follows:
def calculate_aic(n, mse, num_params, sigma):
aic = n * mse + 2 * num_params * sigma
return aic
Ditto for BIC.
Perhaps this will help:
https://machinelearningmastery.com/probabilistic-model-selection-measures/
Thank you for the post! Perhaps this has been answered already, but more simply:
Can you use the same validation set you use for hyperparameter tuning, for calibration as well (assuming you split into train/val/test)?
Yes, but ideally it would be better to use separate datasets – if you can spare the data.
Hi .I have a question:how can i calibrate and forecast parameters of a fractional epidemiological model using Trust Région Reflective algorithm with matlab or scilab.If possible can i have an example.Thank you.
Sorry, I don’t have any examples of the technique you describe or any examples in matlab.
Thank you for the very useful tutorial, I have a question, according to the following paper I assumed calibration of a model could be post-processing, fit a new model on the result of the uncalibrated model. my question is how we can calibrate BERT for example (actually, I got a bit confused about how a calibration process would be)
Yes, calibration can be a post-hoc processing of predicted probabilities.
Sorry, I don’t have experience in calibrating BERT probabilities, I don’t want to give you misleading off cuff advice.
sorry, I forgot to post the paper
https://arxiv.org/pdf/1706.04599.pdf
Hey Jason,
right now I am struggling with calibrating the probabilities of my XGB Classifier. As I am using the xgb api I have to use xgb.DMatrix objects. So I don’t know how to use the CalibratedClassifier model now. Do you got any ideas or advices? A XGB.Classifier returns poorer results….M
Sorry to hear that.
I would expect XGBClassifier to give identical results to using the XGB API directly.
If this is not the case, perhaps there is a bug in the latest version of the library or a difference in the way you have configured both implementations?
That is the weird part about it. I am using the exact same parameters and even the same seed. This problem was also discussed on stackoverflow with no result so I thought I ask you. Thank you!
Hey Jason!
First of all, you for this tutorial. 😉
Can I use this approach for multiclass classification?Let me do just a quick explanation about my problem.
I have a classification pipeline that the output is the probability of that input be part of a class a, b, c…
Although I have more then 100 classes, I just return the top 3 classes with higher probabilities for each input and based on that I choose the winner.
I would like to calibrate these probabilities in order to give the most realistic value for each input.
So, based on your example, how could i adapt to my problem?
Thank you again for your help!
Good question, I’m not sure off the cuff I’ve not tried.
Perhaps experiment and see if it is directly applicable?
Hum, I got it. I read again the scikit-learn doc and in the end of probability calibration explanation I found something about multiclass using CalibratedClassifierCV calibrates for each class separately in a OneVsRestClassifier. I will try and let you know if worked 😉
Good luck!
Hi Jason, thank you so much for such a great article. I’m applying calibration on a random forest and the calibrated result is worse than the uncalibrated result. I’m taking the log_loss score as well and that also shows the score goes down with calibration. Is that normal?
You’re welcome.
It can happy, perhaps try an alternate calibration method/config, or do not calibrate.
Hi Jason, I really appreciate good job that you are doing.. but i have issue with calibration..i used the below steps but my calibration probabilities are worse than non-calibrated
1. I splited my data into train and test
2. I further split then train data from step 1 into train and validation sets
3. I downsampled the training data from step 2 above
4. I fitted my model with downsampled training data from step3
5. i calibrated my model with untouched validation data from step 2.
Do you have an idea of what the problem might be or did i make mistake from above steps?
Thanks!
The steps look good.
Perhaps repeat the process with k-fold cv and average the results.
Hi sir, thank you for your explanation it’s awesome. i wanna ask about what is the difference of getting probabilities from SVC with calibrated classifier and SVC with additional parameter probability set to true? Is it actually using the same procedure? I get different result by using both way
Good question, I recommend checking the API documentation.
hi Jason, any guidance on the size of the validation hold out set (or, the ratios between the train, validate, test split) if you are using a prefit model?
Not really other than “suitably representative”.
Hi Jason, thank you for a very informative article. Could I please ask if I should only calibrate the model (using cross-validation) after I have already finished tuning the hyper-parameters of the classifier, is that correct? Or should I tune the hyperparameters of the model (e.g. SVM) while having CalibratedClassifierCV() wrapped around it? Thank you so much
Cross validation is to give a score to a model, so we can compare different models using that score as a metric. Therefore, you should have the hyperparameters fixed, then run CV.
Thank you your reply.
I am still quite confused with how to organise my data for tuning the hyperparameters and calibrating the probabilities.
1) Currently, my data is split into training and held-out test set (not used at all).
2) With the training data, I did hyperparameter tuning using random forest & random search with cv=5.
3) After this is done, can I use the same training data, fixed my hyperparameters and calibrate the model using let say cv=3? This would mean the data used to tune hyper-parameters will be used as well.
4)Now if I wish to compare the performance of calibrated vs non-calibrated model, how should I go about it? Using training data again & set a new cv (maybe cv=5) to fit and test these two models?
5) And the final model will be e.g. the calibrated model trained on all training data (with no CV) to then use to make predictions on held-out test set.
Thank you so much!
After step 2, you know what hyperparameters you want to use. Then you can discard the CV data you got before. Now you can (a) train your model, or (b) train and then calibrate the model. You’re comparing (a) and (b). You can run k-fold CV with the same old training data on methods (a) and (b) to compare. You may try to use scikit-learn’s k-fold CV function but for (b) there’s another CV behind the scene to do the calibration, hence the data really used for training is even less.
Calibrate only after you finish the hyperparameters.
I understand that point but I was wondering can I then use all my training data and use cross validation to calibrate the model? or the data that was used to tune the model cannot be used to calibrate the model?
Hi Jason. Thanks for the tutorial. I’m confusing when to apply this calibration to pre-trained classifiers. Here’s what I did regarding my own project.
1) I used tenfold cross-validation (via sklearn kFold) to evaluate the model performances of the RF, SVM, and XGB with fixed, pre-tuned parameters. Performance metrics over the sub-test data during each k was finally averaged to give the final evaluation and comparison.
2) Following tenfold cross-validation. I fit each model with the whole training data and used these models for prediction purposes. SVM, particularly, predicted instances with probabilities < 0.5 as positives.
My question is when should I apply this calibration step to provide prediction results with calibrated probabilities? Should I simply calibrate them after tenfold cross-validation? Which method should I use, prefit or CV? FYI, currently, I only have a training dataset, the one used for tenfold cross-validation, and a dataset only for prediction purpose. The independent dataset is not available. I'm really confused right now and wonder if I need to integrate the calibration step even into the existing tenfold cross-validation step. If so, how to go about it? Thanks for the help in advance.
It should be done after step 2 because at there you have the classifier trained.
Thanks for the reply. I read the code and instructions and have one concern. What If I don’t have a distinct hold-out validation set if I need to calibrate using the method of ‘prefit’? Like mentioned earlier, I fit the model with all the training data I got in step 2. Thanks for the advice in advance.
Sorry to add more information. I guess I can stick to the step 1 for the tenfold cross-validation and evaluation. However, to calibrate the models for prediction purposes, I may use untrained models with fixed parameters and use cv = 10 and then fit all the training data I got. In this case, it fulfills both purposes of training and calibration. I read this in the top-rated answer from the post (https://stats.stackexchange.com/questions/263393/scikit-correct-way-to-calibrate-classifiers-with-calibratedclassifiercv). Hope this will do.
That’s correct. Thanks for the pointer to the StackExchange question.
Hey, if I understand correct; the reason we don’t fit the model when we use like cv = 5 is that the calibratorCV does training model for any training fold then does the calibration on calibration fold. But when cv = prefit, it doesn’t do training, it takes the trained model as input and calibrates that model with our choosen validation set. Do you think that is the mechanism inside, because it was tough for me to grasp which line does what, i rationalized that way. I’d glad if u approve or disprove me, thanks for work.
Hi Dave…You may find this resource beneficial:
https://machinelearningmastery.com/implement-resampling-methods-scratch-python/
Hi Jason,
Will calibration improve the accuracy of a model, for example from 0.68 to 0.75? As I read it only helps to maintain the values.
Hi Vinay…The following may be of interest to you:
https://towardsdatascience.com/classifier-calibration-7d0be1e05452
Hi Jason, thanks for the article!
I’m still trying to wrap my head around the purpose of calibration. Do you have any situation you might want to find the calibration specifically? Is it like a score function?
Also, comparing it to the expected probability, we mean the dataset right? Or some knowledge about the domain
Thanks for the help.
Hi Andrew…The following may be of interest:
https://towardsdatascience.com/classifier-calibration-7d0be1e05452
Could you suggest a way to calibrate a model for time series classification?
I believe the scikit learn calibration method, relying on vanilla cross-validation, would not be proper.
Thanks in advance,
Could you suggest a way to calibrate a model for time series classification?
I believe the scikit learn calibration method, relying on vanilla cross-validation, would not be proper.
Can I make it work by passing a TimeSeriesSplit instance as cv method?
Thanks in advance,
Hi Andrea…You may find the following of interest:
https://towardsdatascience.com/classifier-calibration-7d0be1e05452