
Feature importance refers to techniques that assign a score to input features based on how useful they are at predicting a target variable.
There are many types and sources of feature importance scores, although popular examples include statistical correlation scores, coefficients calculated as part of linear models, decision trees, and permutation importance scores.
Feature importance scores play an important role in a predictive modeling project, including providing insight into the data, insight into the model, and the basis for dimensionality reduction and feature selection that can improve the efficiency and effectiveness of a predictive model on the problem.
In this tutorial, you will discover feature importance scores for machine learning in python
After completing this tutorial, you will know:
- The role of feature importance in a predictive modeling problem.
- How to calculate and review feature importance from linear models and decision trees.
- How to calculate and review permutation feature importance scores.
Kick-start your project with my new book Data Preparation for Machine Learning, including step-by-step tutorials and the Python source code files for all examples.
Let’s get started.
- Update May/2020: Added example of feature selection using importance.

How to Calculate Feature Importance With Python
Photo by Bonnie Moreland, some rights reserved.
Tutorial Overview
This tutorial is divided into six parts; they are:
- Feature Importance
- Preparation
- Check Scikit-Learn Version
- Test Datasets
- Coefficients as Feature Importance
- Linear Regression Feature Importance
- Logistic Regression Feature Importance
- Decision Tree Feature Importance
- CART Feature Importance
- Random Forest Feature Importance
- XGBoost Feature Importance
- Permutation Feature Importance
- Permutation Feature Importance for Regression
- Permutation Feature Importance for Classification
- Feature Selection with Importance
Feature Importance
Feature importance refers to a class of techniques for assigning scores to input features to a predictive model that indicates the relative importance of each feature when making a prediction.
Feature importance scores can be calculated for problems that involve predicting a numerical value, called regression, and those problems that involve predicting a class label, called classification.
The scores are useful and can be used in a range of situations in a predictive modeling problem, such as:
- Better understanding the data.
- Better understanding a model.
- Reducing the number of input features.
Feature importance scores can provide insight into the dataset. The relative scores can highlight which features may be most relevant to the target, and the converse, which features are the least relevant. This may be interpreted by a domain expert and could be used as the basis for gathering more or different data.
Feature importance scores can provide insight into the model. Most importance scores are calculated by a predictive model that has been fit on the dataset. Inspecting the importance score provides insight into that specific model and which features are the most important and least important to the model when making a prediction. This is a type of model interpretation that can be performed for those models that support it.
Feature importance can be used to improve a predictive model. This can be achieved by using the importance scores to select those features to delete (lowest scores) or those features to keep (highest scores). This is a type of feature selection and can simplify the problem that is being modeled, speed up the modeling process (deleting features is called dimensionality reduction), and in some cases, improve the performance of the model.
Often, we desire to quantify the strength of the relationship between the predictors and the outcome. […] Ranking predictors in this manner can be very useful when sifting through large amounts of data.
— Page 463, Applied Predictive Modeling, 2013.
Feature importance scores can be fed to a wrapper model, such as the SelectFromModel class, to perform feature selection.
There are many ways to calculate feature importance scores and many models that can be used for this purpose.
Perhaps the simplest way is to calculate simple coefficient statistics between each feature and the target variable. For more on this approach, see the tutorial:
In this tutorial, we will look at three main types of more advanced feature importance; they are:
- Feature importance from model coefficients.
- Feature importance from decision trees.
- Feature importance from permutation testing.
Let’s take a closer look at each.
Want to Get Started With Data Preparation?
Take my free 7-day email crash course now (with sample code).
Click to sign-up and also get a free PDF Ebook version of the course.
Preparation
Before we dive in, let’s confirm our environment and prepare some test datasets.
Check Scikit-Learn Version
First, confirm that you have a modern version of the scikit-learn library installed.
This is important because some of the models we will explore in this tutorial require a modern version of the library.
You can check the version of the library you have installed with the following code example:
|
1 2 3 |
# check scikit-learn version import sklearn print(sklearn.__version__) |
Running the example will print the version of the library. At the time of writing, this is about version 0.22.
You need to be using this version of scikit-learn or higher.
|
1 |
0.22.1 |
Test Datasets
Next, let’s define some test datasets that we can use as the basis for demonstrating and exploring feature importance scores.
Each test problem has five important and five unimportant features, and it may be interesting to see which methods are consistent at finding or differentiating the features based on their importance.
Classification Dataset
We will use the make_classification() function to create a test binary classification dataset.
The dataset will have 1,000 examples, with 10 input features, five of which will be informative and the remaining five will be redundant. We will fix the random number seed to ensure we get the same examples each time the code is run.
An example of creating and summarizing the dataset is listed below.
|
1 2 3 4 5 6 |
# test classification dataset from sklearn.datasets import make_classification # define dataset X, y = make_classification(n_samples=1000, n_features=10, n_informative=5, n_redundant=5, random_state=1) # summarize the dataset print(X.shape, y.shape) |
Running the example creates the dataset and confirms the expected number of samples and features.
|
1 |
(1000, 10) (1000,) |
Regression Dataset
We will use the make_regression() function to create a test regression dataset.
Like the classification dataset, the regression dataset will have 1,000 examples, with 10 input features, five of which will be informative and the remaining five that will be redundant.
|
1 2 3 4 5 6 |
# test regression dataset from sklearn.datasets import make_regression # define dataset X, y = make_regression(n_samples=1000, n_features=10, n_informative=5, random_state=1) # summarize the dataset print(X.shape, y.shape) |
Running the example creates the dataset and confirms the expected number of samples and features.
|
1 |
(1000, 10) (1000,) |
Next, let’s take a closer look at coefficients as importance scores.
Coefficients as Feature Importance
Linear machine learning algorithms fit a model where the prediction is the weighted sum of the input values.
Examples include linear regression, logistic regression, and extensions that add regularization, such as ridge regression and the elastic net.
All of these algorithms find a set of coefficients to use in the weighted sum in order to make a prediction. These coefficients can be used directly as a crude type of feature importance score.
Let’s take a closer look at using coefficients as feature importance for classification and regression. We will fit a model on the dataset to find the coefficients, then summarize the importance scores for each input feature and finally create a bar chart to get an idea of the relative importance of the features.
Linear Regression Feature Importance
We can fit a LinearRegression model on the regression dataset and retrieve the coeff_ property that contains the coefficients found for each input variable.
These coefficients can provide the basis for a crude feature importance score. This assumes that the input variables have the same scale or have been scaled prior to fitting a model.
The complete example of linear regression coefficients for feature importance is listed below.
|
1 2 3 4 5 6 7 8 9 10 11 12 13 14 15 16 17 18 |
# linear regression feature importance from sklearn.datasets import make_regression from sklearn.linear_model import LinearRegression from matplotlib import pyplot # define dataset X, y = make_regression(n_samples=1000, n_features=10, n_informative=5, random_state=1) # define the model model = LinearRegression() # fit the model model.fit(X, y) # get importance importance = model.coef_ # summarize feature importance for i,v in enumerate(importance): print('Feature: %0d, Score: %.5f' % (i,v)) # plot feature importance pyplot.bar([x for x in range(len(importance))], importance) pyplot.show() |
Running the example fits the model, then reports the coefficient value for each feature.
Note: Your results may vary given the stochastic nature of the algorithm or evaluation procedure, or differences in numerical precision. Consider running the example a few times and compare the average outcome.
The scores suggest that the model found the five important features and marked all other features with a zero coefficient, essentially removing them from the model.
|
1 2 3 4 5 6 7 8 9 10 |
Feature: 0, Score: 0.00000 Feature: 1, Score: 12.44483 Feature: 2, Score: -0.00000 Feature: 3, Score: -0.00000 Feature: 4, Score: 93.32225 Feature: 5, Score: 86.50811 Feature: 6, Score: 26.74607 Feature: 7, Score: 3.28535 Feature: 8, Score: -0.00000 Feature: 9, Score: 0.00000 |
A bar chart is then created for the feature importance scores.

Bar Chart of Linear Regression Coefficients as Feature Importance Scores
This approach may also be used with Ridge and ElasticNet models.
Logistic Regression Feature Importance
We can fit a LogisticRegression model on the regression dataset and retrieve the coeff_ property that contains the coefficients found for each input variable.
These coefficients can provide the basis for a crude feature importance score. This assumes that the input variables have the same scale or have been scaled prior to fitting a model.
The complete example of logistic regression coefficients for feature importance is listed below.
|
1 2 3 4 5 6 7 8 9 10 11 12 13 14 15 16 17 18 |
# logistic regression for feature importance from sklearn.datasets import make_classification from sklearn.linear_model import LogisticRegression from matplotlib import pyplot # define dataset X, y = make_classification(n_samples=1000, n_features=10, n_informative=5, n_redundant=5, random_state=1) # define the model model = LogisticRegression() # fit the model model.fit(X, y) # get importance importance = model.coef_[0] # summarize feature importance for i,v in enumerate(importance): print('Feature: %0d, Score: %.5f' % (i,v)) # plot feature importance pyplot.bar([x for x in range(len(importance))], importance) pyplot.show() |
Running the example fits the model, then reports the coefficient value for each feature.
Note: Your results may vary given the stochastic nature of the algorithm or evaluation procedure, or differences in numerical precision. Consider running the example a few times and compare the average outcome.
Recall this is a classification problem with classes 0 and 1. Notice that the coefficients are both positive and negative. The positive scores indicate a feature that predicts class 1, whereas the negative scores indicate a feature that predicts class 0.
No clear pattern of important and unimportant features can be identified from these results, at least from what I can tell.
|
1 2 3 4 5 6 7 8 9 10 |
Feature: 0, Score: 0.16320 Feature: 1, Score: -0.64301 Feature: 2, Score: 0.48497 Feature: 3, Score: -0.46190 Feature: 4, Score: 0.18432 Feature: 5, Score: -0.11978 Feature: 6, Score: -0.40602 Feature: 7, Score: 0.03772 Feature: 8, Score: -0.51785 Feature: 9, Score: 0.26540 |
A bar chart is then created for the feature importance scores.
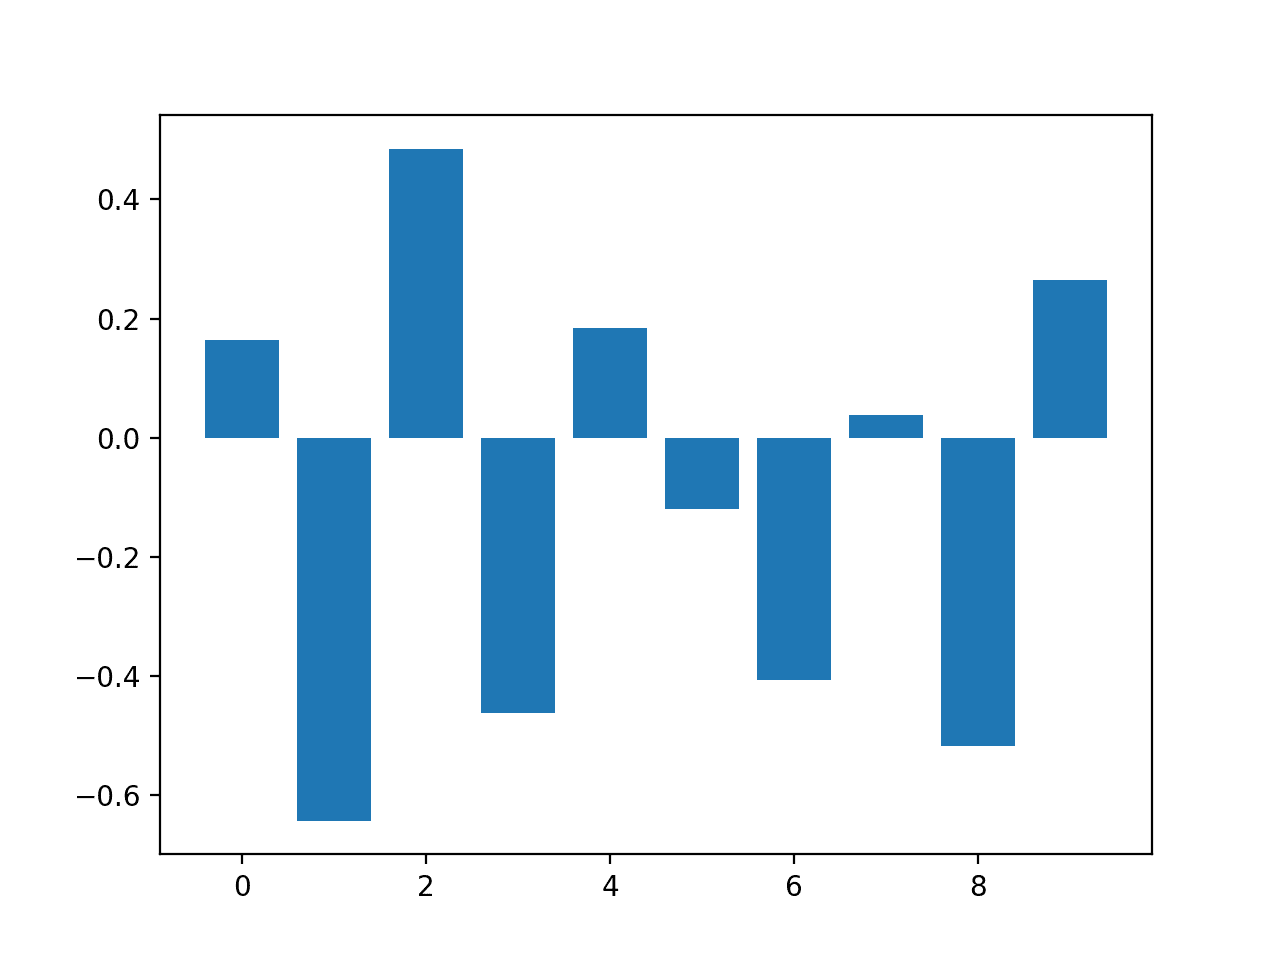
Bar Chart of Logistic Regression Coefficients as Feature Importance Scores
Now that we have seen the use of coefficients as importance scores, let’s look at the more common example of decision-tree-based importance scores.
Decision Tree Feature Importance
Decision tree algorithms like classification and regression trees (CART) offer importance scores based on the reduction in the criterion used to select split points, like Gini or entropy.
This same approach can be used for ensembles of decision trees, such as the random forest and stochastic gradient boosting algorithms.
Let’s take a look at a worked example of each.
CART Feature Importance
We can use the CART algorithm for feature importance implemented in scikit-learn as the DecisionTreeRegressor and DecisionTreeClassifier classes.
After being fit, the model provides a feature_importances_ property that can be accessed to retrieve the relative importance scores for each input feature.
Let’s take a look at an example of this for regression and classification.
CART Regression Feature Importance
The complete example of fitting a DecisionTreeRegressor and summarizing the calculated feature importance scores is listed below.
|
1 2 3 4 5 6 7 8 9 10 11 12 13 14 15 16 17 18 |
# decision tree for feature importance on a regression problem from sklearn.datasets import make_regression from sklearn.tree import DecisionTreeRegressor from matplotlib import pyplot # define dataset X, y = make_regression(n_samples=1000, n_features=10, n_informative=5, random_state=1) # define the model model = DecisionTreeRegressor() # fit the model model.fit(X, y) # get importance importance = model.feature_importances_ # summarize feature importance for i,v in enumerate(importance): print('Feature: %0d, Score: %.5f' % (i,v)) # plot feature importance pyplot.bar([x for x in range(len(importance))], importance) pyplot.show() |
Running the example fits the model, then reports the coefficient value for each feature.
Note: Your results may vary given the stochastic nature of the algorithm or evaluation procedure, or differences in numerical precision. Consider running the example a few times and compare the average outcome.
The results suggest perhaps three of the 10 features as being important to prediction.
|
1 2 3 4 5 6 7 8 9 10 |
Feature: 0, Score: 0.00294 Feature: 1, Score: 0.00502 Feature: 2, Score: 0.00318 Feature: 3, Score: 0.00151 Feature: 4, Score: 0.51648 Feature: 5, Score: 0.43814 Feature: 6, Score: 0.02723 Feature: 7, Score: 0.00200 Feature: 8, Score: 0.00244 Feature: 9, Score: 0.00106 |
A bar chart is then created for the feature importance scores.
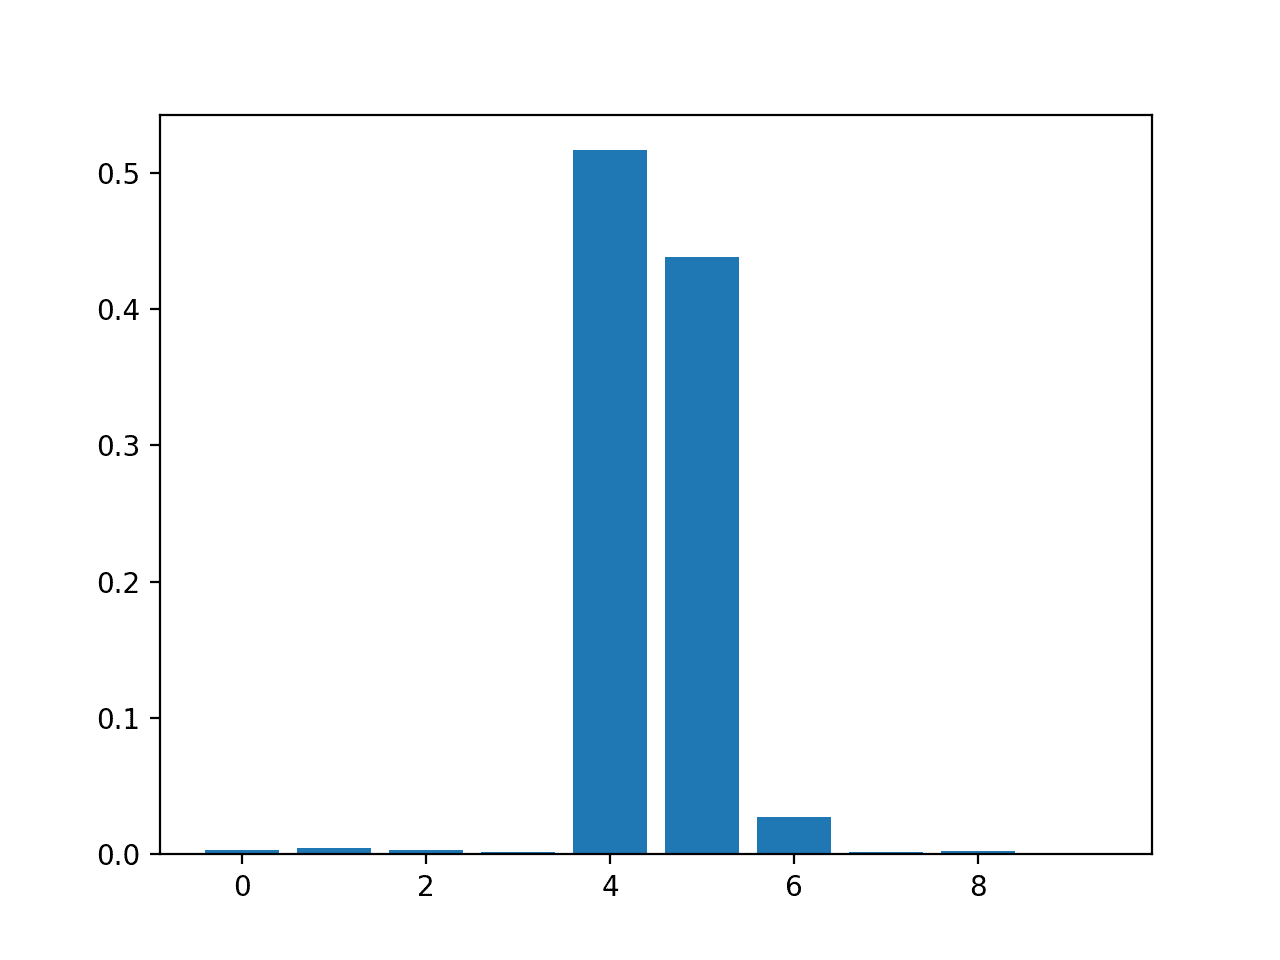
Bar Chart of DecisionTreeRegressor Feature Importance Scores
CART Classification Feature Importance
The complete example of fitting a DecisionTreeClassifier and summarizing the calculated feature importance scores is listed below.
|
1 2 3 4 5 6 7 8 9 10 11 12 13 14 15 16 17 18 |
# decision tree for feature importance on a classification problem from sklearn.datasets import make_classification from sklearn.tree import DecisionTreeClassifier from matplotlib import pyplot # define dataset X, y = make_classification(n_samples=1000, n_features=10, n_informative=5, n_redundant=5, random_state=1) # define the model model = DecisionTreeClassifier() # fit the model model.fit(X, y) # get importance importance = model.feature_importances_ # summarize feature importance for i,v in enumerate(importance): print('Feature: %0d, Score: %.5f' % (i,v)) # plot feature importance pyplot.bar([x for x in range(len(importance))], importance) pyplot.show() |
Running the example fits the model, then reports the coefficient value for each feature.
Note: Your results may vary given the stochastic nature of the algorithm or evaluation procedure, or differences in numerical precision. Consider running the example a few times and compare the average outcome.
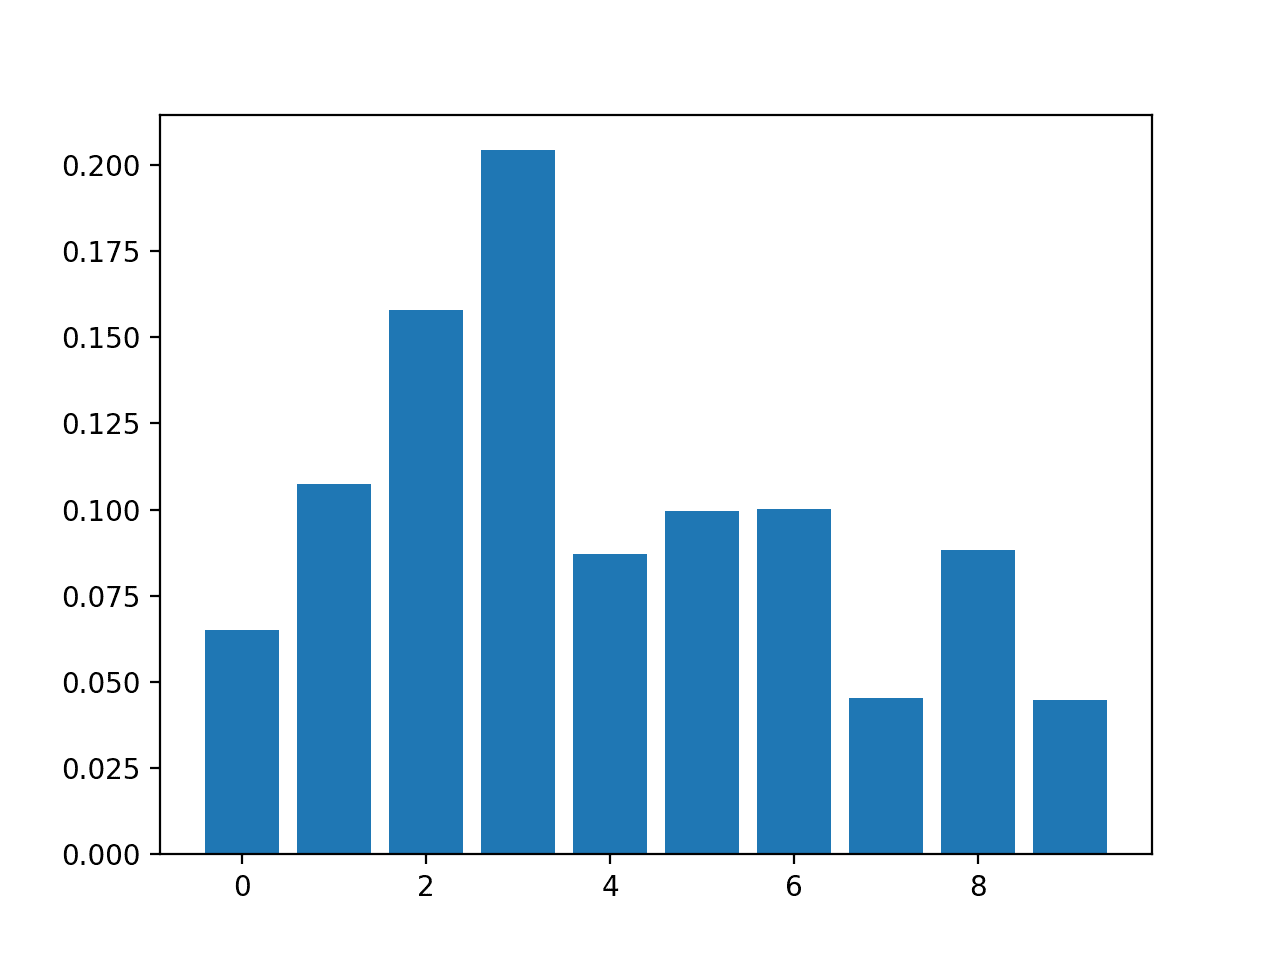
The results suggest perhaps four of the 10 features as being important to prediction.
|
1 2 3 4 5 6 7 8 9 10 |
Feature: 0, Score: 0.01486 Feature: 1, Score: 0.01029 Feature: 2, Score: 0.18347 Feature: 3, Score: 0.30295 Feature: 4, Score: 0.08124 Feature: 5, Score: 0.00600 Feature: 6, Score: 0.19646 Feature: 7, Score: 0.02908 Feature: 8, Score: 0.12820 Feature: 9, Score: 0.04745 |
A bar chart is then created for the feature importance scores.
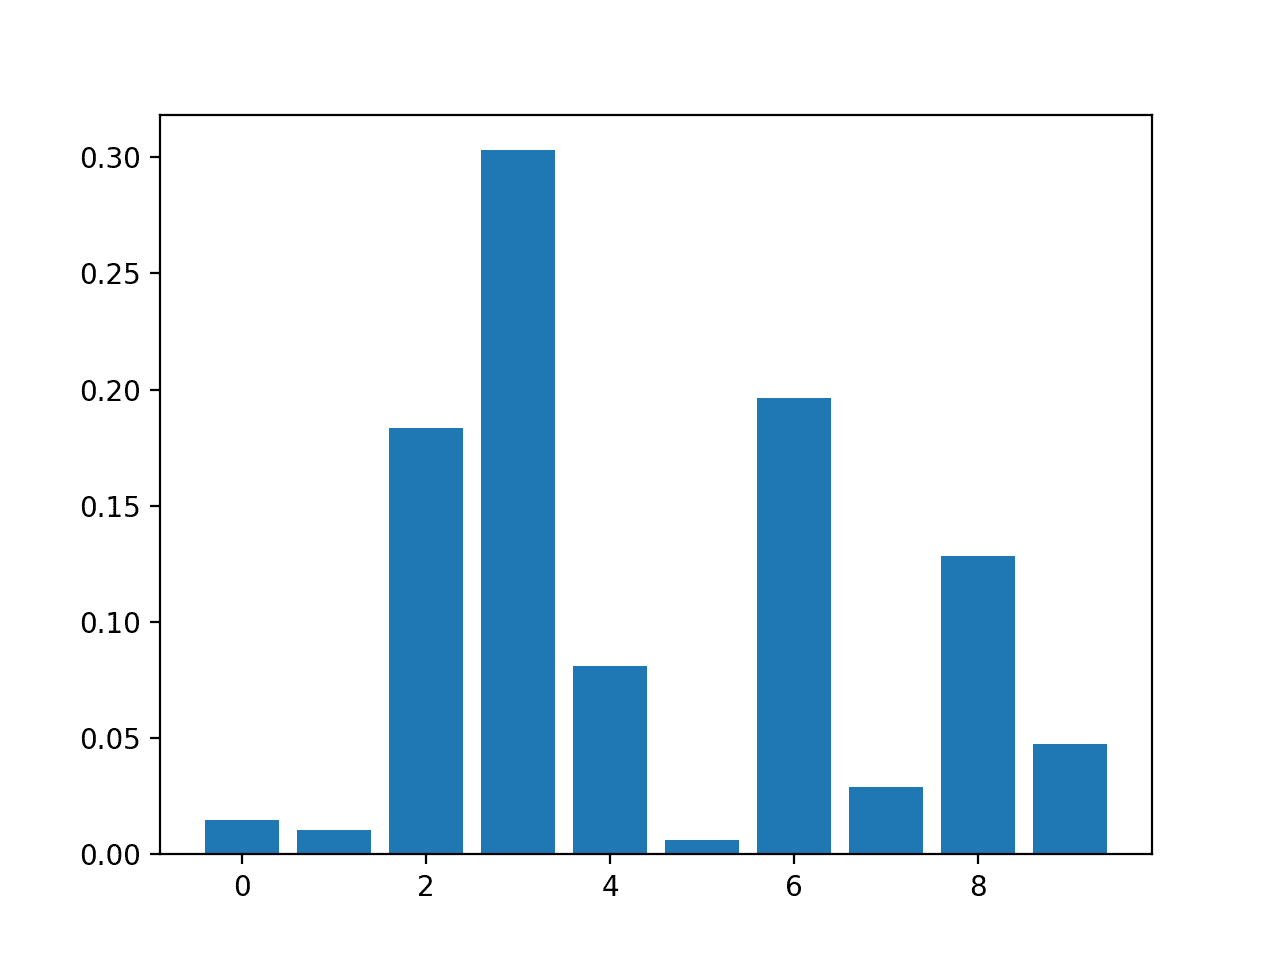
Bar Chart of DecisionTreeClassifier Feature Importance Scores
Random Forest Feature Importance
We can use the Random Forest algorithm for feature importance implemented in scikit-learn as the RandomForestRegressor and RandomForestClassifier classes.
After being fit, the model provides a feature_importances_ property that can be accessed to retrieve the relative importance scores for each input feature.
This approach can also be used with the bagging and extra trees algorithms.
Let’s take a look at an example of this for regression and classification.
Random Forest Regression Feature Importance
The complete example of fitting a RandomForestRegressor and summarizing the calculated feature importance scores is listed below.
|
1 2 3 4 5 6 7 8 9 10 11 12 13 14 15 16 17 18 |
# random forest for feature importance on a regression problem from sklearn.datasets import make_regression from sklearn.ensemble import RandomForestRegressor from matplotlib import pyplot # define dataset X, y = make_regression(n_samples=1000, n_features=10, n_informative=5, random_state=1) # define the model model = RandomForestRegressor() # fit the model model.fit(X, y) # get importance importance = model.feature_importances_ # summarize feature importance for i,v in enumerate(importance): print('Feature: %0d, Score: %.5f' % (i,v)) # plot feature importance pyplot.bar([x for x in range(len(importance))], importance) pyplot.show() |
Running the example fits the model, then reports the coefficient value for each feature.
Note: Your results may vary given the stochastic nature of the algorithm or evaluation procedure, or differences in numerical precision. Consider running the example a few times and compare the average outcome.
The results suggest perhaps two or three of the 10 features as being important to prediction.
|
1 2 3 4 5 6 7 8 9 10 |
Feature: 0, Score: 0.00280 Feature: 1, Score: 0.00545 Feature: 2, Score: 0.00294 Feature: 3, Score: 0.00289 Feature: 4, Score: 0.52992 Feature: 5, Score: 0.42046 Feature: 6, Score: 0.02663 Feature: 7, Score: 0.00304 Feature: 8, Score: 0.00304 Feature: 9, Score: 0.00283 |
A bar chart is then created for the feature importance scores.
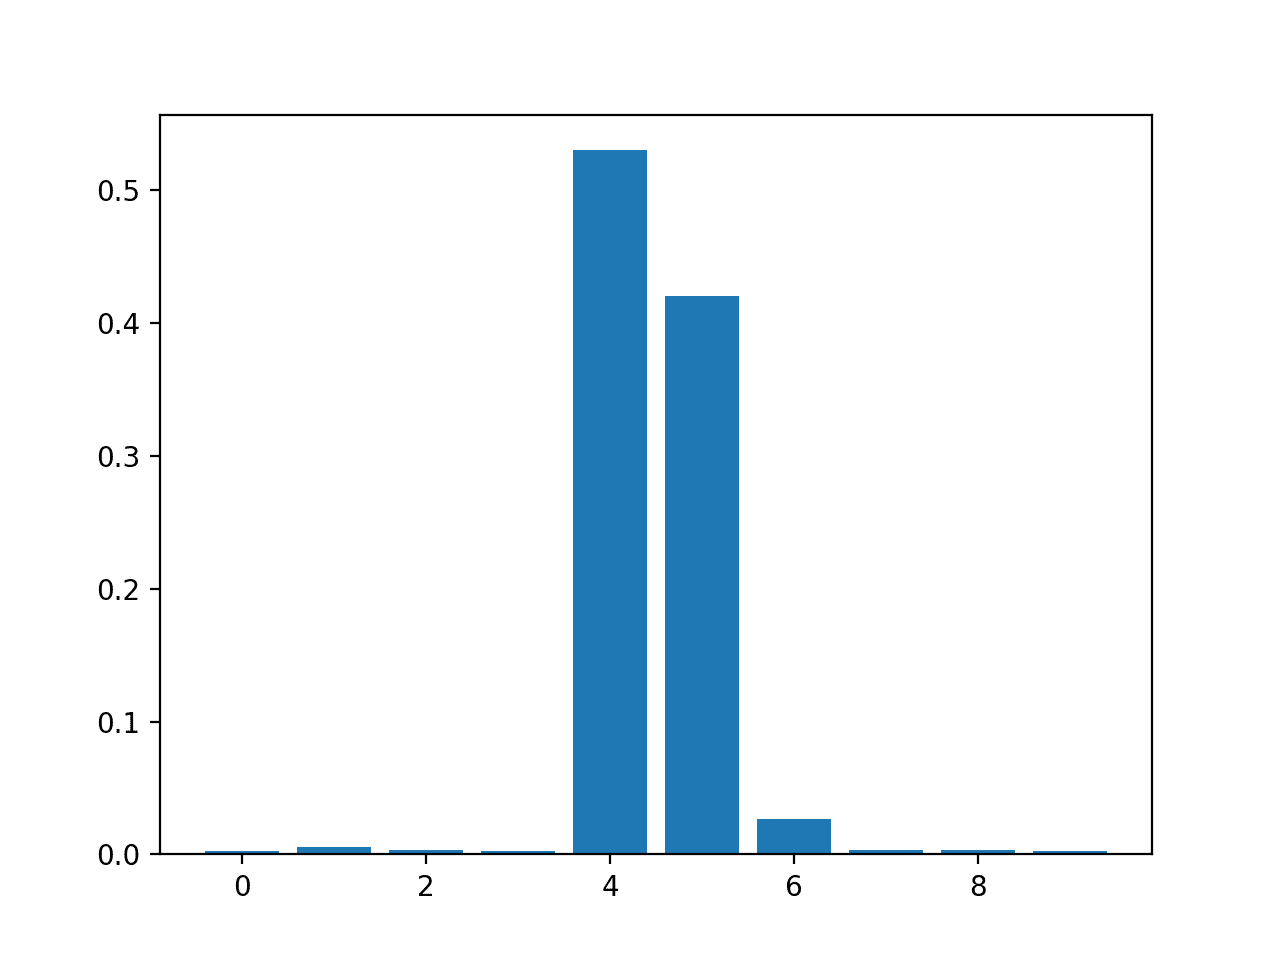
Bar Chart of RandomForestRegressor Feature Importance Scores
Random Forest Classification Feature Importance
The complete example of fitting a RandomForestClassifier and summarizing the calculated feature importance scores is listed below.
|
1 2 3 4 5 6 7 8 9 10 11 12 13 14 15 16 17 18 |
# random forest for feature importance on a classification problem from sklearn.datasets import make_classification from sklearn.ensemble import RandomForestClassifier from matplotlib import pyplot # define dataset X, y = make_classification(n_samples=1000, n_features=10, n_informative=5, n_redundant=5, random_state=1) # define the model model = RandomForestClassifier() # fit the model model.fit(X, y) # get importance importance = model.feature_importances_ # summarize feature importance for i,v in enumerate(importance): print('Feature: %0d, Score: %.5f' % (i,v)) # plot feature importance pyplot.bar([x for x in range(len(importance))], importance) pyplot.show() |
Running the example fits the model, then reports the coefficient value for each feature.
Note: Your results may vary given the stochastic nature of the algorithm or evaluation procedure, or differences in numerical precision. Consider running the example a few times and compare the average outcome.
The results suggest perhaps two or three of the 10 features as being important to prediction.
|
1 2 3 4 5 6 7 8 9 10 |
Feature: 0, Score: 0.06523 Feature: 1, Score: 0.10737 Feature: 2, Score: 0.15779 Feature: 3, Score: 0.20422 Feature: 4, Score: 0.08709 Feature: 5, Score: 0.09948 Feature: 6, Score: 0.10009 Feature: 7, Score: 0.04551 Feature: 8, Score: 0.08830 Feature: 9, Score: 0.04493 |
A bar chart is then created for the feature importance scores.
Bar Chart of RandomForestClassifier Feature Importance Scores
XGBoost Feature Importance
XGBoost is a library that provides an efficient and effective implementation of the stochastic gradient boosting algorithm.
This algorithm can be used with scikit-learn via the XGBRegressor and XGBClassifier classes.
After being fit, the model provides a feature_importances_ property that can be accessed to retrieve the relative importance scores for each input feature.
This algorithm is also provided via scikit-learn via the GradientBoostingClassifier and GradientBoostingRegressor classes and the same approach to feature selection can be used.
First, install the XGBoost library, such as with pip:
|
1 |
sudo pip install xgboost |
Then confirm that the library was installed correctly and works by checking the version number.
|
1 2 3 |
# check xgboost version import xgboost print(xgboost.__version__) |
Running the example, you should see the following version number or higher.
|
1 |
0.90 |
For more on the XGBoost library, start here:
Let’s take a look at an example of XGBoost for feature importance on regression and classification problems.
XGBoost Regression Feature Importance
The complete example of fitting a XGBRegressor and summarizing the calculated feature importance scores is listed below.
|
1 2 3 4 5 6 7 8 9 10 11 12 13 14 15 16 17 18 |
# xgboost for feature importance on a regression problem from sklearn.datasets import make_regression from xgboost import XGBRegressor from matplotlib import pyplot # define dataset X, y = make_regression(n_samples=1000, n_features=10, n_informative=5, random_state=1) # define the model model = XGBRegressor() # fit the model model.fit(X, y) # get importance importance = model.feature_importances_ # summarize feature importance for i,v in enumerate(importance): print('Feature: %0d, Score: %.5f' % (i,v)) # plot feature importance pyplot.bar([x for x in range(len(importance))], importance) pyplot.show() |
Running the example fits the model, then reports the coefficient value for each feature.
Note: Your results may vary given the stochastic nature of the algorithm or evaluation procedure, or differences in numerical precision. Consider running the example a few times and compare the average outcome.
The results suggest perhaps two or three of the 10 features as being important to prediction.
|
1 2 3 4 5 6 7 8 9 10 |
Feature: 0, Score: 0.00060 Feature: 1, Score: 0.01917 Feature: 2, Score: 0.00091 Feature: 3, Score: 0.00118 Feature: 4, Score: 0.49380 Feature: 5, Score: 0.42342 Feature: 6, Score: 0.05057 Feature: 7, Score: 0.00419 Feature: 8, Score: 0.00124 Feature: 9, Score: 0.00491 |
A bar chart is then created for the feature importance scores.
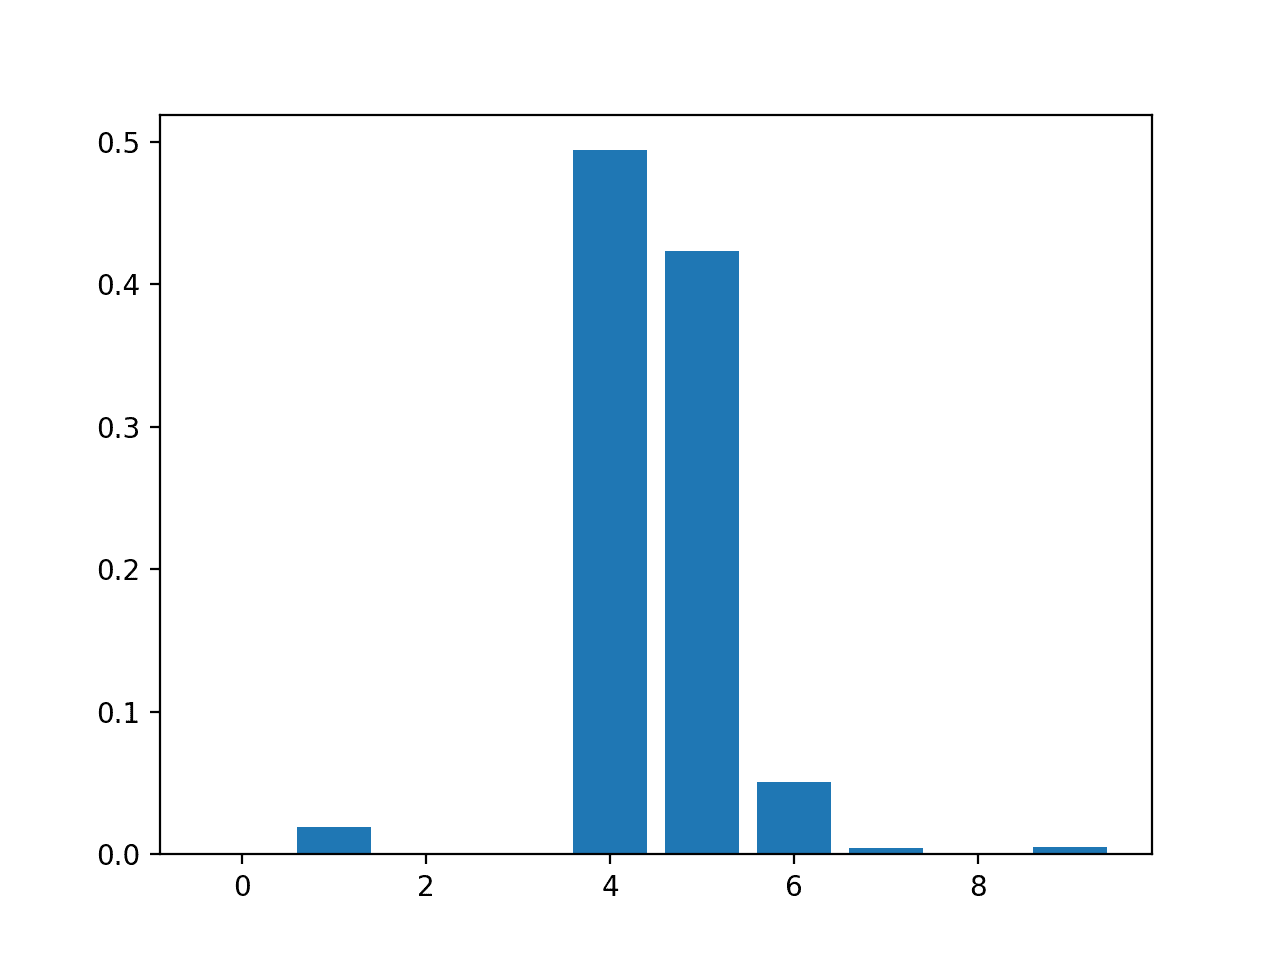
Bar Chart of XGBRegressor Feature Importance Scores
XGBoost Classification Feature Importance
The complete example of fitting an XGBClassifier and summarizing the calculated feature importance scores is listed below.
|
1 2 3 4 5 6 7 8 9 10 11 12 13 14 15 16 17 18 |
# xgboost for feature importance on a classification problem from sklearn.datasets import make_classification from xgboost import XGBClassifier from matplotlib import pyplot # define dataset X, y = make_classification(n_samples=1000, n_features=10, n_informative=5, n_redundant=5, random_state=1) # define the model model = XGBClassifier() # fit the model model.fit(X, y) # get importance importance = model.feature_importances_ # summarize feature importance for i,v in enumerate(importance): print('Feature: %0d, Score: %.5f' % (i,v)) # plot feature importance pyplot.bar([x for x in range(len(importance))], importance) pyplot.show() |
Running the example fits the model then reports the coefficient value for each feature.
Note: Your results may vary given the stochastic nature of the algorithm or evaluation procedure, or differences in numerical precision. Consider running the example a few times and compare the average outcome.
The results suggest perhaps seven of the 10 features as being important to prediction.
|
1 2 3 4 5 6 7 8 9 10 |
Feature: 0, Score: 0.02464 Feature: 1, Score: 0.08153 Feature: 2, Score: 0.12516 Feature: 3, Score: 0.28400 Feature: 4, Score: 0.12694 Feature: 5, Score: 0.10752 Feature: 6, Score: 0.08624 Feature: 7, Score: 0.04820 Feature: 8, Score: 0.09357 Feature: 9, Score: 0.02220 |
A bar chart is then created for the feature importance scores.
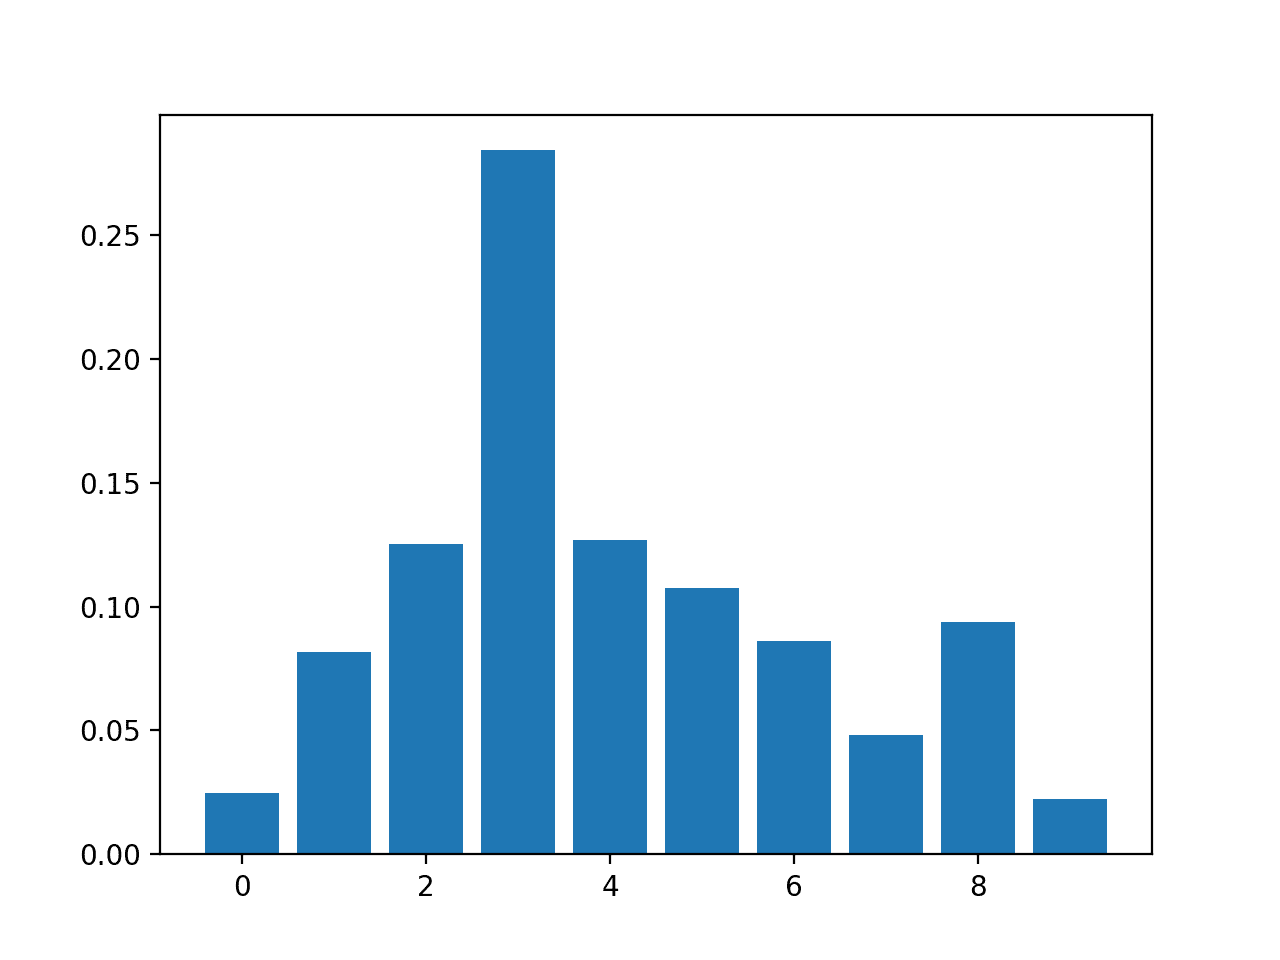
Bar Chart of XGBClassifier Feature Importance Scores
Permutation Feature Importance
Permutation feature importance is a technique for calculating relative importance scores that is independent of the model used.
First, a model is fit on the dataset, such as a model that does not support native feature importance scores. Then the model is used to make predictions on a dataset, although the values of a feature (column) in the dataset are scrambled. This is repeated for each feature in the dataset. Then this whole process is repeated 3, 5, 10 or more times. The result is a mean importance score for each input feature (and distribution of scores given the repeats).
This approach can be used for regression or classification and requires that a performance metric be chosen as the basis of the importance score, such as the mean squared error for regression and accuracy for classification.
Permutation feature selection can be used via the permutation_importance() function that takes a fit model, a dataset (train or test dataset is fine), and a scoring function.
Let’s take a look at this approach to feature selection with an algorithm that does not support feature selection natively, specifically k-nearest neighbors.
Permutation Feature Importance for Regression
The complete example of fitting a KNeighborsRegressor and summarizing the calculated permutation feature importance scores is listed below.
|
1 2 3 4 5 6 7 8 9 10 11 12 13 14 15 16 17 18 19 20 21 |
# permutation feature importance with knn for regression from sklearn.datasets import make_regression from sklearn.neighbors import KNeighborsRegressor from sklearn.inspection import permutation_importance from matplotlib import pyplot # define dataset X, y = make_regression(n_samples=1000, n_features=10, n_informative=5, random_state=1) # define the model model = KNeighborsRegressor() # fit the model model.fit(X, y) # perform permutation importance results = permutation_importance(model, X, y, scoring='neg_mean_squared_error') # get importance importance = results.importances_mean # summarize feature importance for i,v in enumerate(importance): print('Feature: %0d, Score: %.5f' % (i,v)) # plot feature importance pyplot.bar([x for x in range(len(importance))], importance) pyplot.show() |
Running the example fits the model, then reports the coefficient value for each feature.
Note: Your results may vary given the stochastic nature of the algorithm or evaluation procedure, or differences in numerical precision. Consider running the example a few times and compare the average outcome.
The results suggest perhaps two or three of the 10 features as being important to prediction.
|
1 2 3 4 5 6 7 8 9 10 |
Feature: 0, Score: 175.52007 Feature: 1, Score: 345.80170 Feature: 2, Score: 126.60578 Feature: 3, Score: 95.90081 Feature: 4, Score: 9666.16446 Feature: 5, Score: 8036.79033 Feature: 6, Score: 929.58517 Feature: 7, Score: 139.67416 Feature: 8, Score: 132.06246 Feature: 9, Score: 84.94768 |
A bar chart is then created for the feature importance scores.
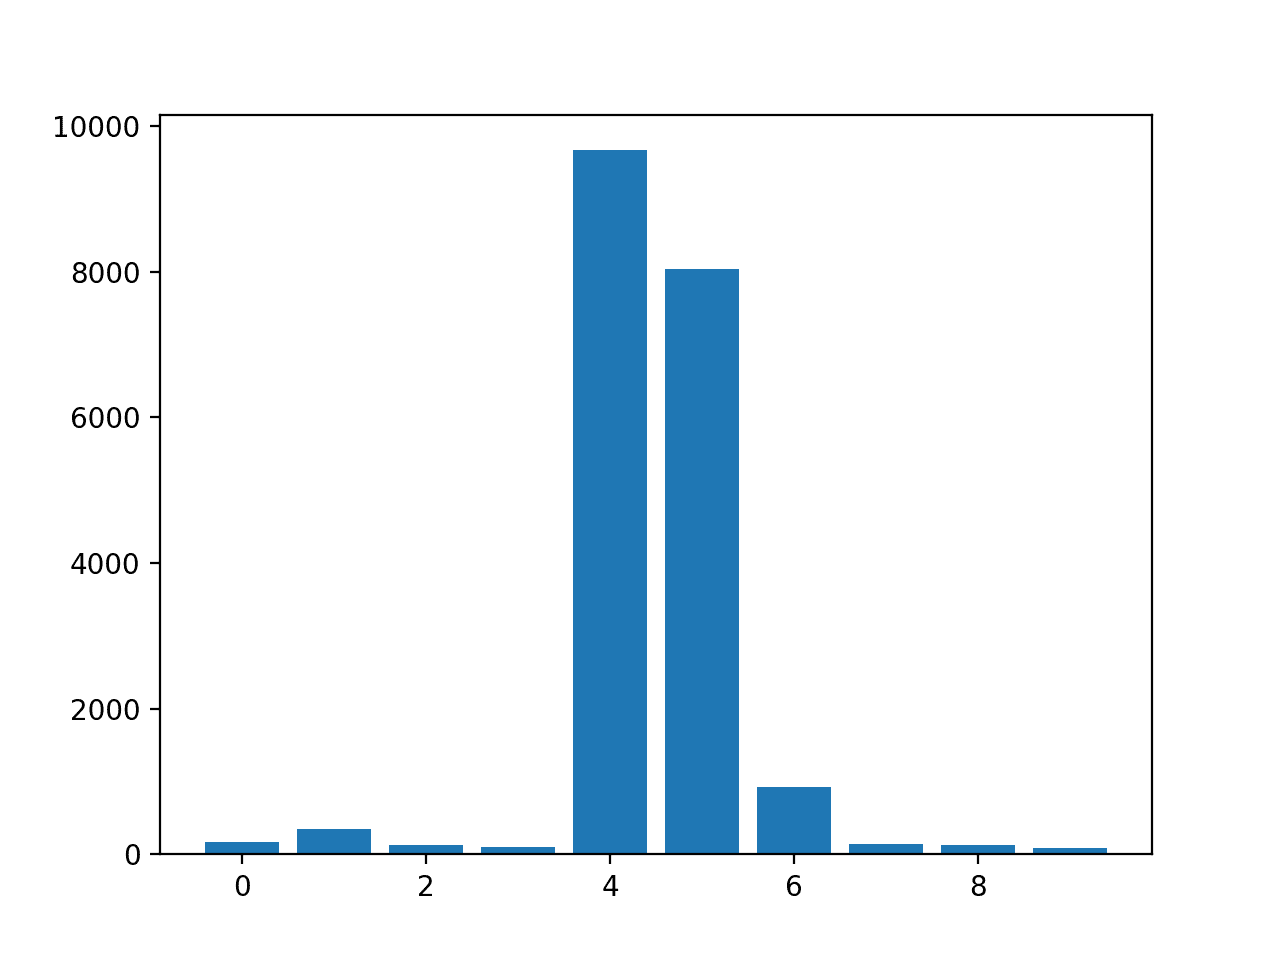
Bar Chart of KNeighborsRegressor With Permutation Feature Importance Scores
Permutation Feature Importance for Classification
The complete example of fitting a KNeighborsClassifier and summarizing the calculated permutation feature importance scores is listed below.
|
1 2 3 4 5 6 7 8 9 10 11 12 13 14 15 16 17 18 19 20 21 |
# permutation feature importance with knn for classification from sklearn.datasets import make_classification from sklearn.neighbors import KNeighborsClassifier from sklearn.inspection import permutation_importance from matplotlib import pyplot # define dataset X, y = make_classification(n_samples=1000, n_features=10, n_informative=5, n_redundant=5, random_state=1) # define the model model = KNeighborsClassifier() # fit the model model.fit(X, y) # perform permutation importance results = permutation_importance(model, X, y, scoring='accuracy') # get importance importance = results.importances_mean # summarize feature importance for i,v in enumerate(importance): print('Feature: %0d, Score: %.5f' % (i,v)) # plot feature importance pyplot.bar([x for x in range(len(importance))], importance) pyplot.show() |
Running the example fits the model, then reports the coefficient value for each feature.
Note: Your results may vary given the stochastic nature of the algorithm or evaluation procedure, or differences in numerical precision. Consider running the example a few times and compare the average outcome.
The results suggest perhaps two or three of the 10 features as being important to prediction.
|
1 2 3 4 5 6 7 8 9 10 |
Feature: 0, Score: 0.04760 Feature: 1, Score: 0.06680 Feature: 2, Score: 0.05240 Feature: 3, Score: 0.09300 Feature: 4, Score: 0.05140 Feature: 5, Score: 0.05520 Feature: 6, Score: 0.07920 Feature: 7, Score: 0.05560 Feature: 8, Score: 0.05620 Feature: 9, Score: 0.03080 |
A bar chart is then created for the feature importance scores.
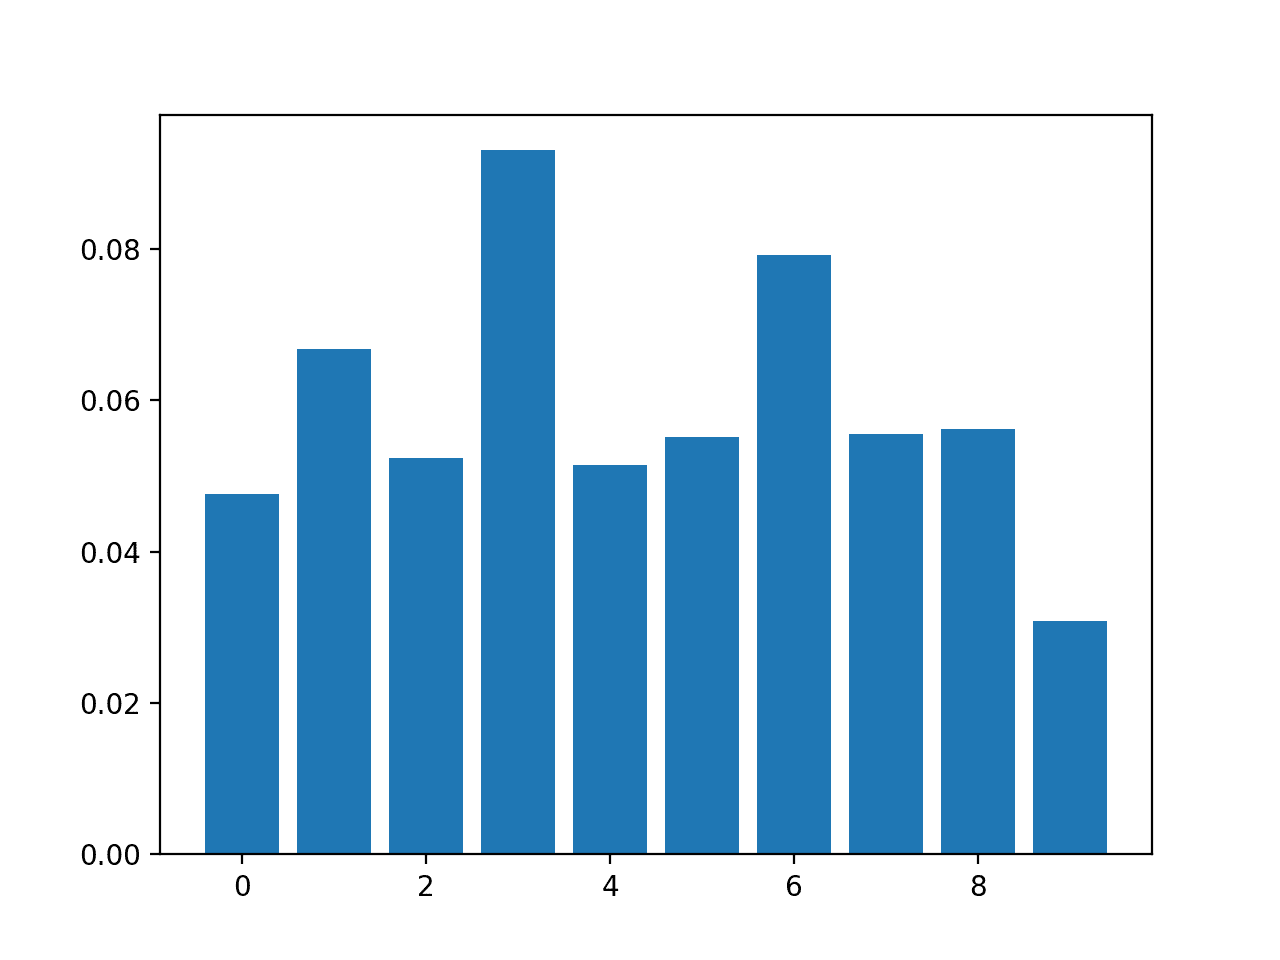
Bar Chart of KNeighborsClassifier With Permutation Feature Importance Scores
Feature Selection with Importance
Feature importance scores can be used to help interpret the data, but they can also be used directly to help rank and select features that are most useful to a predictive model.
We can demonstrate this with a small example.
Recall, our synthetic dataset has 1,000 examples each with 10 input variables, five of which are redundant and five of which are important to the outcome. We can use feature importance scores to help select the five variables that are relevant and only use them as inputs to a predictive model.
First, we can split the training dataset into train and test sets and train a model on the training dataset, make predictions on the test set and evaluate the result using classification accuracy. We will use a logistic regression model as the predictive model.
This provides a baseline for comparison when we remove some features using feature importance scores.
The complete example of evaluating a logistic regression model using all features as input on our synthetic dataset is listed below.
|
1 2 3 4 5 6 7 8 9 10 11 12 13 14 15 16 17 |
# evaluation of a model using all features from sklearn.datasets import make_classification from sklearn.model_selection import train_test_split from sklearn.linear_model import LogisticRegression from sklearn.metrics import accuracy_score # define the dataset X, y = make_classification(n_samples=1000, n_features=10, n_informative=5, n_redundant=5, random_state=1) # split into train and test sets X_train, X_test, y_train, y_test = train_test_split(X, y, test_size=0.33, random_state=1) # fit the model model = LogisticRegression(solver='liblinear') model.fit(X_train, y_train) # evaluate the model yhat = model.predict(X_test) # evaluate predictions accuracy = accuracy_score(y_test, yhat) print('Accuracy: %.2f' % (accuracy*100)) |
Running the example first the logistic regression model on the training dataset and evaluates it on the test set.
Note: Your results may vary given the stochastic nature of the algorithm or evaluation procedure, or differences in numerical precision. Consider running the example a few times and compare the average outcome.
In this case we can see that the model achieved the classification accuracy of about 84.55 percent using all features in the dataset.
|
1 |
Accuracy: 84.55 |
Given that we created the dataset, we would expect better or the same results with half the number of input variables.
We could use any of the feature importance scores explored above, but in this case we will use the feature importance scores provided by random forest.
We can use the SelectFromModel class to define both the model we wish to calculate importance scores, RandomForestClassifier in this case, and the number of features to select, 5 in this case.
|
1 2 3 |
... # configure to select a subset of features fs = SelectFromModel(RandomForestClassifier(n_estimators=200), max_features=5) |
We can fit the feature selection method on the training dataset.
This will calculate the importance scores that can be used to rank all input features. We can then apply the method as a transform to select a subset of 5 most important features from the dataset. This transform will be applied to the training dataset and the test set.
|
1 2 3 4 5 6 7 |
... # learn relationship from training data fs.fit(X_train, y_train) # transform train input data X_train_fs = fs.transform(X_train) # transform test input data X_test_fs = fs.transform(X_test) |
Tying this all together, the complete example of using random forest feature importance for feature selection is listed below.
|
1 2 3 4 5 6 7 8 9 10 11 12 13 14 15 16 17 18 19 20 21 22 23 24 25 26 27 28 29 30 31 32 33 34 |
# evaluation of a model using 5 features chosen with random forest importance from sklearn.datasets import make_classification from sklearn.model_selection import train_test_split from sklearn.feature_selection import SelectFromModel from sklearn.ensemble import RandomForestClassifier from sklearn.linear_model import LogisticRegression from sklearn.metrics import accuracy_score # feature selection def select_features(X_train, y_train, X_test): # configure to select a subset of features fs = SelectFromModel(RandomForestClassifier(n_estimators=1000), max_features=5) # learn relationship from training data fs.fit(X_train, y_train) # transform train input data X_train_fs = fs.transform(X_train) # transform test input data X_test_fs = fs.transform(X_test) return X_train_fs, X_test_fs, fs # define the dataset X, y = make_classification(n_samples=1000, n_features=10, n_informative=5, n_redundant=5, random_state=1) # split into train and test sets X_train, X_test, y_train, y_test = train_test_split(X, y, test_size=0.33, random_state=1) # feature selection X_train_fs, X_test_fs, fs = select_features(X_train, y_train, X_test) # fit the model model = LogisticRegression(solver='liblinear') model.fit(X_train_fs, y_train) # evaluate the model yhat = model.predict(X_test_fs) # evaluate predictions accuracy = accuracy_score(y_test, yhat) print('Accuracy: %.2f' % (accuracy*100)) |
Running the example first performs feature selection on the dataset, then fits and evaluates the logistic regression model as before.
Note: Your results may vary given the stochastic nature of the algorithm or evaluation procedure, or differences in numerical precision. Consider running the example a few times and compare the average outcome.
In this case, we can see that the model achieves the same performance on the dataset, although with half the number of input features. As expected, the feature importance scores calculated by random forest allowed us to accurately rank the input features and delete those that were not relevant to the target variable.
|
1 |
Accuracy: 84.55 |
Further Reading
This section provides more resources on the topic if you are looking to go deeper.
Related Tutorials
- How to Choose a Feature Selection Method For Machine Learning
- How to Perform Feature Selection with Categorical Data
- Feature Importance and Feature Selection With XGBoost in Python
- Feature Selection For Machine Learning in Python
- An Introduction to Feature Selection
Books
- Applied Predictive Modeling, 2013.
APIs
- Feature selection, scikit-learn API.
- Permutation feature importance, scikit-learn API.
- sklearn.datasets.make_classification API.
- sklearn.datasets.make_regression API.
- XGBoost Python API Reference.
- sklearn.inspection.permutation_importance API.
Summary
In this tutorial, you discovered feature importance scores for machine learning in python
Specifically, you learned:
- The role of feature importance in a predictive modeling problem.
- How to calculate and review feature importance from linear models and decision trees.
- How to calculate and review permutation feature importance scores.
Do you have any questions?
Ask your questions in the comments below and I will do my best to answer.
Get a Handle on Modern Data Preparation!

Prepare Your Machine Learning Data in Minutes
...with just a few lines of python code
Discover how in my new Ebook:
Data Preparation for Machine Learning
It provides self-study tutorials with full working code on:
Feature Selection, RFE, Data Cleaning, Data Transforms, Scaling, Dimensionality Reduction,
and much more...

 for Feature Selection in Python")


 from Scratch in Python")

This tutorial lacks the most important thing – comparison between feature importance and permutation importance. Which to choose and why?
For interested: https://explained.ai/rf-importance/
Best method to compare feature importance in Generalized Linear Models (Linear Regression, Logistic Regression etc.) is multiplying feature coefficients with standard devation of variable. It gives you standarized betas, which aren’t affected by variable’s scale measure. Thanks to that, they are comparable.
Scaling or standarizing variables works only if you have ONLY numeric data, which in practice… never happens.
Comparison requires a context, e.g. a specific dataset that you’re intersted in solving and suite of models.
Hey Jason
If i have a numerical dataset with around 40 independent variables and one dependent variable called quality. I want to find the features which cause a drop in quality or which feature affect the dependent variables the most.
However there is multicolleanirity present in the independent variables so i need to first group all the independent variables as per internal collinearity and then find the ones which affect quality the most.
Feature importance will give a per-variable idea of the influence on each independent variable on the dependent variable, taking into account interaction supported by the model.
Hello , Can you please help me with my question . So after performing RFE suppose that I have got a subset of 10 features for a model . If I see ranking of those features it is obvious that every feature is ranked ‘1’ . But , here I need to know the importance of features in the selected subset . What would be the ranking criterion to be used to vizualise/compare each other .
Thank you
Usually a subset as a whole infer some information with the target variable. The individual feature may not be as powerful as when complimented with another. Having this said, one way you can quantify the importance is using the coefficient of correlation. The closer to zero, the weaker the feature.
Hi Martin,
if you have already scaled your numerical dataset with StandardScaler, do you still have to rank the feature by multiplying coefficient by std or since it was already scaled coefficnet rank is enough?
Thanks
Luigi
Hi Martin,
Can you elaborate on that? Coefficient in which method? Assuming one has a neural network for classification with a large number of features I don’t think any of the weights be meaningful on their own.
Hi Jason!
Thanks for the nice coding examples and explanation. A little comment though, regarding the Random Forest feature importances: would it be worth mentioning that the feature importance using
importance = model.feature_importances_
could potentially provide importances that are biased toward continuous features and high-cardinality categorical features?
best wishes
Oliver
It may be, what makes you say that?
I came across this post a couple of years ago when it got published which discusses how you have to be careful interpreting feature importances from Random Forrest in general. This was exemplified using scikit learn and some other package in R.
https://explained.ai/rf-importance/index.html
This is the same that Martin mentioned above.
best wishes
Oliver
Thanks for sharing.
Thank you, Jason, that was very informative.
As a newbie in data science I a question:
Is the concept of Feature Importance applicable to all methods? What about DL methods (CNNs, LSTMs)? What about BERT? I’m thinking that, intuitively, a similar function should be available no matter then method used, but when searching online I find that the answer is not clear. I guess I lack some basic, key knowledge here.
Yes, but different methods are used.
Here, we are focused on tabular data.
Hi Jason, thank you for this post,
What other different methods are used for LSTM?
Here the different methods means we may not see the features so easily. Take image data for example, it is well known that processing the image and find the edges (i.e., think of converting a color photo into pencil sketch) would be helpful.
Hello Adrian,
I do not understand what you mean here. Can you specify more? What should I do to get the permutation feature importance of my LSTM model? I do not see too much information on the internet about this.
It depends on that nature of the problem and dataset. LSTM is a model but it doesn’t matter here. You should look at the dataset and find what are the features you can provide.
Hi, I am a freshman and I am wondering that with the development of deep learning that could find feature automatically, are the feature engineering that help construct feature manually and efficently going to be out of date? If not, where can we use feature engineering better than deep learning?
It performs feature extraction automatically.
Even so, such models may or may not perform better than other methods.
Thank you.
You’re welcome.
Hi, I am freshman too. I would like to ask if there is any way to implement “Permutation Feature Importance for Classification” using deep NN with Keras?
I don’t see why not. Use the Keras wrapper class for your model.
Hi. Just a little addition to your review. Beware of feature importance in RFs using standard feature importance metrics. See: https://explained.ai/rf-importance/
Keep up the good work!
Thanks for sharing.
Hi Jason,
Any plans please to post some practical stuff on Knowledge Graph (Embedding)?
Thanks,Bill
Thanks for the suggestion Bill!
Your tutorials are so interesting.
Thanks.
Hi Jason,
thank you very much for your post. It is very interesting as always!
May I conclude that each method ( Linear, Logistic, Random Forest, XGBoost, etc.) can lead to its own way to Calculate Feature Importance?
Thank you.
Thanks.
Yes, we can get many different views on what is important.
Hey Jason!!
Does this method works for the data having both categorical and continuous features? or we have to separate those features and then compute feature importance which i think wold not be good practice!.
and off topic question, can we apply P.C.A to categorical features if not then is there any equivalent method for categorical feature?
I believe so.
No. PCA is for numeric data.
And L.D.A is for categorical values??
LDA – linear discriminant analysis – no it’s for numerical values too.
Hi Jason, I learnt a lot from your website about machine learning. By the way, do you have an idea on how to know feature importance that use keras model?
Thanks.
Try: Permutation Feature Importance
Hi Jason,
I’m a Data Analytics grad student from Colorado and your website has been a great resource for my learning!
I have a question about the order in which one would do feature selection in the machine learning process. My dataset is heavily imbalanced (95%/5%) and has many NaN’s that require imputation. A professor also recommended doing PCA along with feature selection. Where would you recommend placing feature selection? My initial plan was imputation -> feature selection -> SMOTE -> scaling -> PCA.
For some more context, the data is 1.8 million rows by 65 columns. The target variable is binary and the columns are mostly numeric with some categorical being one hot encoded.
Appreciate any wisdom you can pass along!
Thanks, I’m happy to hear that.
Experiment to discover what works best.
I would do PCA or feature selection, not both. I would probably scale, sample then select. But also try scale, select, and sample.
Hi, Jason
Thanks for your post !
I got one question about the feature importance scores in the case of imbalanced class dataset. Does the class imbalance affect the interpretation of feature importance, in other words, if a binary classifier(say, random forest) is fitted on a heavily skewed dataset, is the feature imporatnce scores got form the model still credible? Thank you~
It may, depending on the method used. Very likely.
Perhaps test a suite of methods and compare the results of the model fit on the selected features.
Thanks Jason for this information.
You’re welcome!
Hi Jason,
I am running Decision tree regressor to identify the most important predictor. The output I got is in the same format as given. However I am not being able to understand what is meant by “Feature 1” and what is the significance of the number given.
I ran the Random forest regressor as well but not being able to compare the result due to unavailability of labelS. Please do provide the Python code to map appropriate fields and Plot.
Thanks
If you have a list of string names for each column, then the feature index will be the same as the column name index.
Does that help?
Hi Jason 🙂 thanks fot this very helpful example!
i have a very similar question: i do not have a list of string names, but rather use scaler and onehot encoder in my model via pipeline. Do you have any tipp how i can find out which feature number belongs to which feature name after using onehot enc and also having numerical variables in my model?:-/
Thank you so much in advance!
Not really, you could map binary variables to categorical labels if you did the encoding manually.
Hi Jason 🙂
Thanks for your reply! Just in case it is helpful for others:
i found a nice solution to access the column names in Column_Transformer
(see here for a def to access the names after transforming the data:
https://johaupt.github.io/scikit-learn/tutorial/python/data%20processing/ml%20pipeline/model%20interpretation/columnTransformer_feature_names.html)
(I hope it is ok to post this link here?) Turns out, this was exactly my problem >.<
Thanks so much for your content, it is of great help!
Happy to hear that you solved your issue.
Sir,
How about using SelectKbest from sklearn to identify the best features???
How does it differ in calculations from the above method?
Thankin advance
Yes, it allows you to use feature importance as a feature selection method.
Hi Jason,
Great post an nice coding examples. I am quite new to the field of machine learning. I was playing with my own dataset and fitted a simple decision tree (classifier 0,1). Model accuracy was 0.65. I was very surprised when checking the feature importance. They were all 0.0 (7 features of which 6 are numerical. How is that even possible?
Best
Alex
Thanks.
65% is low, near random. Perhaps the feature importance does not provide insight on your dataset. It is not absolute importance, more of a suggestion.
ok thanks, and yes it‘s really almost random. But still, I would have expected even some very small numbers around 0.01 or so because all features being exactly 0.0 … anyway, will check and use your great blog and comments for further education . thanks
I can see that many readers link the article “Beware Default Random Forest Importances” that compare default RF Gini importances in sklearn and permutation importance approach. I believe that is worth mentioning the other trending approach called SHAP:
https://www.kaggle.com/wrosinski/shap-feature-importance-with-feature-engineering
https://towardsdatascience.com/explain-your-model-with-the-shap-values-bc36aac4de3d
Recently I use it as one of a few parallel methods for feature selection. It seems to be worth our attention, because it uses independent method to calculate importance (in comparison to Gini or permutation methods). Also it is helpful for visualizing how variables influence model output. Do you have any experience or remarks on it?
Regards!
Thanks for sharing.
Hi Jason,
Thanks so much for these useful posts as well as books!
Would you mind sharing your thoughts about the differences between getting feature importance of our XGBoost model by retrieving the coeffs or directly with the built-in plot function?
Both provide the same importance scores I believe. What do you mean exactly?
I am currently using feature importance scores to rank the inputs of the dataset I am working on. I obtained different scores (and a different importance order) depending on if retrieving the coeffs via model.feature_importances_ or with the built-in plot function plot_importance(model). The specific model used is XGBRegressor(learning_rate=0.01,n_estimators=100, subsample=0.5, max_depth=7 )
So that, I was wondering if each of them use different strategies to interpret the relative importance of the features on the model …and what would be the best approach to decide which one of them select and when.
Thanks again Jason, for all your great work.
It is possible that different metrics are being used in the plot.
I believe I have seen this before, look at the arguments to the function used to create the plot.
Hi Jason, Thanks it is very useful.
I have some difficult on Permutation Feature Importance for Regression.I feel puzzled at the
scoring “MSE”. “MSE” is closer to 0, the more well-performant the model.When
according to the “Outline of the permutation importance algorithm”, importance is the difference between original “MSE”and new “MSE”.That is to say, the larger the difference, the less important the original feature is. But the meaning of the article is that the greater the difference, the more important the feature is
his may help with the specifics of the implementation:
https://scikit-learn.org/stable/modules/generated/sklearn.inspection.permutation_importance.html
Hello all,
Other than model performance metrics (MSE, classification error, etc), is there any way to visualize the importance of the ranked variables from these algorithms?
For example, do you expect to see a separation in the data (if any exists) when the important variables are plotted vs index (trend chart), or in a 2D scatter plot array?
Do the top variables always show the most separation (if there is any in the data) when plotted vs index or 2D? or do you have to usually search through the list to see something when drilldown? if you have to search down then what does the ranking even mean when drilldown isnt consistent down the list?
What if you have an “important” variable but see nothing in a trend plot or 2D scatter plot of features? If nothing is seen then no action can be taken to fix the problem, so are they really “important”?
If a variable is important in High D, and contributes to accuracy, will it always show something in trend or 2D Plot ? if not how to convince anyone it is important?
I think variable importances are very difficult to interpret, especially if you are fitting high dimensional models.
I hope to hear some interesting thoughts.
Thanks a lot!
Alex
SeasonWarez
Yes, the bar charts used in this tutorial is a way to visualize feature importance.
Perhaps I don’t understand your question?
The bar charts are not the actual data itself. For these High D models with importances, do you expect to see anything in the actual data on a trend chart or 2D plots of F1vsF2 etc…
If you cant see it in the actual data, How do you make a decision or take action on these important variables?
like if you color the data by Good/Bad Group1/Group2 in classification. or if you do a correalation between X and Y in regression.
If you use such high D models, would the probability of seeing nothing in the drilldown of the data increase? If you see nothing in the data drilldown, how do you take action? Is there really something there in High D that is meaningful ?
This is the issues I see with these automatic ranking methods using models.
They can be useful, e.g. fit a model on each perspective or each subset of features, compare results and go with the features that result in the best performing master. Faster than an exhaustive search of subsets, especially when n features is very large.
Each algorithm is going to have a different perspective on what is important. Personally, I use any feature importance outcomes as suggestions, perhaps during modeling or perhaps during a summary of the problem.
I dont think I am communicating clearly lol.
You are focusing on getting the best model in terms of accuracy (MSE etc). Yes feature selection is definitely useful for that task, Genetic Algo is another one that can come in handy too for that.
However in terms of interpreting an outlier, or fault in the data using the model. Or when doing Classification like Random Forest for determining what is different between GroupA/GroupB. And ranking the variables.
During interpretation of the input variable data (what I call Drilldown), I would plot Feature1 vs Index (or time) called univariate trend. Or Feature1 vs Feature2 in a scatter plot.
Now if you have a High D model with many inputs, you will get a ranking. But even if you look at the individual input trends, or individual correlations, or F2vsF2 scatterplots, you can still see nothing at all. The good/bad data wont stand out visually or statistically in lower dimensions.
The correlations will be low, and the bad data wont stand out in the important variables.
This problem gets worse with higher and higher D, more and more inputs to the models.
So my question is if you have such a model that has good accuracy, and many many inputs. When you see an outlier or excursion in the data how do you visualize what happened in the input space if you see nothing in lower D plots? If the problem is truly a 4D or higher problem, how do you visualize it and take action on it?
Thanks a lot
Thanks for elaborating Alex.
One approach is to use manifold learning and project the feature space to a lower dimensional space that preserves the salient properties/structure.
Perhaps start with a tsne:
https://scikit-learn.org/stable/modules/manifold.html
Dear Dr Jason,
Thank you for this tutorial.
This is my understanding of the line – adopting the use with iris data.
First we look at the inner function:
In essence we generate a ‘skeleton’ of decision tree classifiers. There are 10 decision trees. Note this is a skeleton.
For the next example I will use the iris data from:
model =
We can fit a model to the decision tree classifier:
You may ask why fit a model to a bunch of decision trees?
In the above example we are fitting a model with ALL the features.
Then you may ask, what about this: by putting a RandomForestClassifier into a SelectFromModel
In this case we get our model ‘model’ from SelectFromModel. In the iris data there are five features in the data set. Here the above function SelectFromModel selects the ‘best’ model with at most 3 features.
We get a model from the SelectFromModel instead of the RandomForestClassifier. So we don’t fit the model on RandomForestClassifier, but rather RandomForestClassifier feeds the ‘skeleton’ of decision tree classfiers. Then the model is determined by selecting a model by based on the best three features.
Thank you
Anthony of Sydney
The “SelectFromModel” is not a model, you cannot make predictions with it.
Instead it is a transform that will select features using some other model as a guide, like a RF.
Dear Dr Jason,
Thank you
Anthony of Sydney
You’re welcome.
Dear Dr Jason,
Need clarification here on “SelectFromModel” please.
Referring to the last set of code lines 12-14 in this blog
What do we do when “fs” is fitted in
Is “fs.fit” fitting a model?
Thank you,
Anthony of Sydney
It is fitting the transform.
-Here is an example using iris data.
Iris data has four features, and one output which is a categorial 0,1,2
In sum, there is a difference between the model.fit and the fs.fit.
Question is what is fs.fit please?
Thank you,
Anthony of Sydney
It fits the transform:
https://scikit-learn.org/stable/modules/generated/sklearn.feature_selection.SelectFromModel.html#sklearn.feature_selection.SelectFromModel.fit
Dear Dr Jason,
I looked at the definition of fit( as:
I don’t feel wiser from the meaning.
Why couldn’t the developers say that the fit(X) method gets the best fit columns of X?
This is because when you print the model, you get the subset of the features X.
To me the words “transform” mean do some mathematical operation .
But in this context, “transform” means obtain the features which explained the most to predict y.
Thank you,
Anthony of Sydney
Dear Dr Jason,
To tie things up we would like to know the names of the features that were determined by the SelectFromModel
Hope that helps,
Anthony of Sydney
Dear Dr Jason,
I apologize for the “alternative” version to obtain names using ‘zip’ function. IGNORE THE LAST ENTRY as the results are incorrect.
Apologies
Anthony of Sydney
Rather the alternative is
This is the correct alternative using the ‘zip’ function.
Apologies again.
Anthony of Sydney
It is mathematical.
In this case, transform refers to the fact that Xprime = f(X), where Xprime is a subset of columns of X.
Thank you,
Anthony of Sydney
You’re welcome.
Dear Dr Jason,
Thanks again for your tutorial.
I have experimented with for example RFE and GradientBoosterClassifier and determining a set of features to use, I found from experimenting with the iris_data that GradientBoosterClassifier will ‘determine’ that 2 features best explain the model to predict a species, while RFE ‘determines’ that 3 features best explain the model to predict a species.
The question:
Experimenting with GradientBoostClassifier determined 2 features while RFE determined 3 features.
Must the results of feature selection be the same?
Or in other words, is fine tuning the parameters for GradientBoostClassifier and RFE need to be adjusted – what parameters in the GradientBoostClassifier and RFE to be adjusted to get the same result.
Thank you,
Anthony of Sydney
Great question.
No, each method will have a different idea on what features are important.
Thank you,
Anthony of Sydney
You’re welcome.
Thank you Jason for sharing valuable content.
Can you please clarify how classification accuracy effect if one of the input features is same as class attribute
You’re welcome!
If the class label is used as input to the model, then the model should achieve perfect skill, In fact, the model is not required.
Hello! Thanks for this great article!!
I’m fairly new in ML and I got two questions related to feature importance calculation.
First, for some reason, when using coef_, after having fitted a linear regression model, I get negative values for some of the features, is this normal? And if yes what could it mean about those features? Perhaps that (since we talk about linear regression) the smaller the value of the first feature the greater the value of the second feature (or the target value depending on which variables we are comparing). For the logistic regression it’s quite straight forward that a feature is correlated to one class or the other, but in linear regression negative values are quite confussing, could you please share your thoughts on that.
Second, maybe not 100% on this topic but still I think worth mentioning. The scenario is the following. When trying the feature_importance_ of a DecisionTreeRegressor as the example above, the only difference that I use one of my own datasets. When I try the same script multiple times for the exact same configuration, if the dataset was splitted using train_test_split with a parameter of random_state equals a specific integer I get a different result each time I run the script. The only way to get the same results is to set random_state equals to false(not even None which is the default). From the docs of sklearn, I understand that using an int random_state results in a “reproducible output across multiple function calls” and trully this gives the same split every time, however when it comes to getting the feature_importance_ of the DecisionTreeRegressor model the results deffer every time? How and why is this possible?
You’re welcome.
Yes, to be expected. If used as an importance score, make all values positive first.
You may have to set the seed on the model as well.
Thank you for the fast reply!
For the first question, I made sure that all of the feature values are positive by using the feature_range=(0,1) parameter during normalization with MinMaxScaler, but unfortunatelly I am still getting negative coefficients.
For the second question you were absolutely right, once I included a specific random_state for the DecisionTreeRegressor I got the same results after repetition.
Sorry, I mean that you can make the coefficients themselves positive before interpreting them as importance scores.
Hey Dr Jason. Do any of these methods work for time series? If I convert my time series to a supervised learning problem as you did in your previous tutorials, can I still do feature importance with Random Forest? I don’t know what the X and y will be.
No, I believe you will need to use methods designed for time series.
I hope to write about them i the future.
For importance of lag obs, perhaps an ACF/PACF is a good start:
https://machinelearningmastery.com/gentle-introduction-autocorrelation-partial-autocorrelation/
Hi Jason Brownlee,
Thanks for the post.
How can u say that important feature in certain scenarios.
1) Random forest for feature importance on a classification problem (two or three while bar graph very near with other features)
2) xgboost for feature importance on a classification problem (seven of the 10 features as being important to prediction.) Is there any threshold between 0.5 & 1.0
3) permutation feature importance with knn for classification two or three while bar graph very near with other features)
Thanks,
Arul
Sorry, I don’t understand your question, perhaps you can restate or rephrase it?
Dear Dr Jason,
Thanks for your tutorial.
I am using feature importance scores to rank the variables of the dataset.
I got the feature importance scores with random forest and decision tree.
I did your step-by-step tutorial for classification models
With model feature importance.
This tutorial shows the importance scores in 1 runs. But I want the feature importance score in 100 runs.
must abundant variables in100 first order position of the runing of DF & RF &svm model???
thank you.
Why do you want scores over 100 runs?
I have 200 records and 18 attributes.
And my goal is to rank features.
To validate the ranking model, I want an average of 100 runs.
Do you have another method?
I want help in this regard please.
Can you also teach us Partial Dependence Plots in python?
thank you
I don’ follow. How would ranked features be evaluated exactly?
Thanks for the suggestion.
Can’t feature importance score in the above tutorial be used to rank the variables?
If so, is that enough???!!
A single run will give a single rank. Multiple runs will give a mess.
Hi Jason, thanks for the awesome tutorial. I have a question when using Keras wrapper for a CNN model. CNN requires input in 3-dimension, but Scikit-learn only takes 2-dimension input for fit function. How do I satisfy dimension requirement of both 2D and 3D for Keras and Scikit-learn? Part of my code is shown below, thanks!
from keras.wrappers.scikit_learn import KerasRegressor
from sklearn.inspection import permutation_importance
from matplotlib import pyplot
# my input X is in shape of (10000*380*1) with 380 input features
# define the model
from tensorflow.keras.models import Sequential
from tensorflow.keras import layers
def base_model():
model = Sequential()
model.add(layers.Conv1D(40,7, activation=’relu’, input_shape=(input_dim,1))) #CONV1D require 3D input
model.add(layers.MaxPooling1D(4))
model.add(layers.Conv1D(60,11, activation=’relu’))
model.add(layers.MaxPooling1D(8))
model.add(layers.Dense(80, activation=’relu’))
model.add(layers.Flatten())
model.add(layers.Dense(2, activation=’linear’))
model.compile(loss=’mse’,
optimizer=’adam’,
metrics=[‘mae’])
print(model.summary())
return model
wrapper_model = KerasRegressor(build_fn=base_model)
# fit the model
wrapper_model.fit(X, Y) #scikit learn only take 2D input here
# perform permutation importance
results = permutation_importance(wrapper_model, X, Y, scoring=’neg_mean_squared_error’)
# get importance
importance = results.importances_mean
CNN is not appropriate for a regression problem.
This will help:
https://machinelearningmastery.com/when-to-use-mlp-cnn-and-rnn-neural-networks/
When using 1D cnns for time series forecasting or sequence prediction, I recommend using the Keras API directly.
Hi Jason,
Thanks for the article 🙂
How can you get the feature importance if the model is part of an sklearn pipeline?
Thanks
You can use the feature importance model standalone to calculate importances for your review.
This article is very informative, do we have real world examples instead of using n_samples=1000, n_features=10, ?????????
Thanks.
I used the synthetic dataset intentionally so that you can focus on learning the method, then easily swap in your own dataset.
Hi,
I guess these methods for discovering the feature importance are valid when target variable is binary.
Can we use suggested methods for a multi-class classification task?
Thank you
Alex
Yes.
In a binary task ( for example based on linear SVM coefficients), features with positive and negative coefficients have positive and negative associations, respectively, with probability of classification as a case.
How about a multi-class classification task? How we can interpret the linear SVM coefficients?
Thank you,
SVM does not support multi-class. Instead the problem must be transformed into multiple binary problems.
Thank you for your reply.
In case of a multi class SVM, (For example, for a 3-class task), can we combine the SVM coefficients coming from different “Binary Learners” to determine the feature importance?
Perhaps.
It might be easier to use RFE:
https://machinelearningmastery.com/rfe-feature-selection-in-python/
Dear Jason,
Thank you for your useful article.
I was wondering if it is reasonable to implement a regression problem with Deep Neural Network and then get the importance scores of the predictor variables using the Random Forest feature importance?
Thanks in advance,
Masoud
No. I don’t think the importance scores and the neural net model would be related in any useful way.
Dear Jason,
Thank you for your reply. So I think the best way to retrieve the feature importance of parameters in the DNN or Deep CNN model (for a regression problem) is the Permutation Feature Importance. Am I right?
Thanks in advance,
Masoud
I recommend checking the literature.
Hi Jason.
I’m using AdaBoost Classifier to get the feature importance. I have 17 variables but the result only shows 16. What did I do wrong? Thanks
Perhaps you have 16 inputs and 1 output to equal 17.
Sorry if my question sounds dumb, but why are the feature importance results that much different between regression and classification although when using the same model like RandomForest for both ? I understand the target feature is the different, since it’s a numeric value when using the regression method or a categorical value (or class) when using the classification method. But the input features, aren’t they the same ? If not, it would have been interesting to use the same input feature dataset for regressions and classifications, so we could see the similarities and differences. Thanks.
Good question, each algorithm will have different idea of what is important.
More here:
https://machinelearningmastery.com/faq/single-faq/what-feature-importance-method-should-i-use
There are different datasets used for the regression and for the classification in this tutorial, right ?
Yes.
Hi Jason and, Thanks for a great article
Is there a way to set a minimum threshold in which we can say that it is from there it is important for the selection of features such as the average of the coefficients, quatile1 …..
Thank you in advance
cordially
Saber
You’re welcome.
Not really, model skill is the key focus, the features that result in best model performance should be selected.
Nice tutorials Jason. Thank you !
I see a big variety of techniques in order to reduce features dimensions or evaluate importance or select features from.a given dataset… most of them related to “sklearn” Library. I have followed them through several of your numerous tutorials about the topic…providing a rich space of methodologies to explore features relevance for our particular problem …sometime, a little bit confused because of the big amount of tools to be tested and evaluated…
I have a single question to put it. Do we have something similar (or equivalent) to Images field (computer vision) or all of them are exclusively related to tabular dataset
Thank you in advance
You’re welcome.
Yes, pixel scaling and data augmentation is the main data prep methods for images.
Thanks Jason for this informative tutorial.
I’ve got 2 questions:
1- You mentioned that “The positive scores indicate a feature that predicts class 1, whereas the negative scores indicate a feature that predicts class 0.”, that is mean that features related to positive scores aren’t used when predicting class 0?
2- Since various techniques on the same dataset may produce different subsets of important features, shall we train the model using each subset and then keep the subset that makes the model perform the best? can we combine important features from different techniques?
No a linear model is a weighed sum of all inputs.
Yes, here is an example:
https://machinelearningmastery.com/feature-selection-subspace-ensemble-in-python/
Hi Jason and thanks for this useful tutorial.
I was wondering if we can use Lasso()
model = BaggingRegressor(Lasso()) where you use
# fit the model
model = LogisticRegression(solver=’liblinear’)
Because Lasso() itself does feature selection?
Thanks in advance
Perhaps try it. Not sure using lasso inside a bagging model is wise.
As Lasso() has feature selection, can I use it in your above code instead of “LogisticRegression(solver=’liblinear’)”:
model = LogisticRegression(solver=’liblinear’)
model = Lasso()
And could you please let me know why it is not wise to use
model = BaggingRegressor(Lasso())?
When I adapt your code using model = BaggingRegressor(Lasso()) then I have the best result in comparison with other models.
Thanks in advance
LASSO has feature selection, but not feature importance.
Bagging is appropriate for high variance models, LASSO is not a high variance model.
Nice work. Use the model that gives the best result on your problem.
Thank you very much for the interesting tutorial.
May you help me out, please?
I would like to rank my input features. Using the same input features, I ran the different models and got the results of feature coefficients. However, the rank of each feature coefficient was different among various models (e.g., RF and Logistic Regression). If I do not care about the result of the models, instead of the rank of the coefficients. Which model is the best? How we can evaluate the confidence of the feature coefficient rank?
Thank you very much in advance.
Best regards,
Alex.
You’re welcome.
Yes, each model will have a different “idea” of what features are important, you can learn more here:
https://machinelearningmastery.com/faq/single-faq/what-feature-importance-method-should-i-use
Dear Json,
I have 40 features and using SelectFromModel I found that my model has better result with features [6, 9, 20,25].
1-Can I just use these features and ignore other features and then predict? I did this way and the result was really bad.
2-Can I use SelectFromModel to save my model? Could you please help me by providing information for making a pipeline to load new data and the model that is save using SelectFromModel and do the final prediction?
If the result is bad, then don’t use just those features.
You can save your model directly, see this example:
https://machinelearningmastery.com/save-load-machine-learning-models-python-scikit-learn/
MY other question is if I can use PCA and StandardScaler() before SelectFromModel?
# split into train and test sets
X_train, X_test, y_train, y_test = train_test_split(X, y, test_size=0.33, random_state=1)
#### here first StandardScaler on X_train, X_test, y_train, y_test
#### then PCA on X_train, X_test, y_train, y_test
# feature selection
X_train_fs, X_test_fs, fs = select_features(X_trainSCPCA, y_trainSCPCA, X_testSCPCA)
Thanks in advance
I would recommend using a Pipeline to perform a sequence of data transforms:
https://scikit-learn.org/stable/modules/generated/sklearn.pipeline.Pipeline.html
Thanks I will use a pipeline but we still need a correct order in the pipeline, yes? That is why I asked about this order:
1 – # split into train and test sets
X_train, X_test, y_train, y_test = train_test_split(X, y, test_size=0.33, random_state=1)
2 – #### here first StandardScaler on X_train, X_test, y_train, y_test
3 – #### then PCA on X_train, X_test, y_train, y_test
4 – # feature selection
X_train_fs, X_test_fs, fs = select_features(X_trainSCPCA, y_trainSCPCA, X_testSCPCA)
Thanks in advance
Yes order is key.
Standardizing prior to a PCA is the correct order.
Hi Jason,
thanks for this great post.
I have a question regarding permutation importance.
Since it involves the permutation of each predictor, can it be applied to time data (my feature are daily financial indeces)?
I am not sure if you can in this case, as you have some temporal order and serial correlation.
What is your opinion about it?
Many thanks
Luigi
Maybe. I don’t know for sure, but off the cuff I think feature selection methods for tabular data may not be appropriate for time series data as a general rule.
Hi Jason,
Great Tutorial. Thank you.
I have seen some criticism on this tutorial comments.
So first of all, I like and support your teaching method that emphasizes more the use of the tool, that you provide with your piece of code vs big ideas/concept. I mean I rather prefer to have a “knife” and experiment how to cut wit it than big guys explaining big ideas on how to make cuts …but without providing me the tool.
so I share here my experiments:
1º) I experimented with Sklearn “permutation_importance” methods that seems the more objetive and also I apply it to my own regression dataset problem). I apply also scaling (MinMaxScaler()) to my dataset.
So I decided to abandon a little bit the other ones equivalent methods such as: (RFE, KBest, and own methods for .coef_, .features_ mean, importances.mean for certain sklearn models
2º) I apply “permutation_importance to several models (Some kind of Grid of comparative methods) with LinearRegressor(), SVR(), RandomForestRegressor(), ExtraTreesRegressor(), KNeighborsRegressor(), XGBRegressor() …and also I ad a simple ANN MLP model (not included
on Sklearn)…
3º) I decided to train all these models, and I decided to choose the best permutation_importance , in order to reduce the full features to a K-features only, but applied to the model where I got the best metric (e.g. RMSE) performance. Do you share my criterium?
4º) finally I reduce the dataset according these best models (ANN, XGR, ETR, RFR) features importances values and check out the final performance of a new training, applied for reduced dataset features, …and I got even better performance than using the full dataset features …
so I conclude that features importance selection was working correctly…
even I got surprised because I select the features with a method but I got the best features reduction training performance with a close method but not the best.
My questions are:
5º) Could you write down the structure (or linked me to one of your tutorials) on how to save a sklearn trained model (weights) using Sklearn method (I hear using pickle but i do not specifically how)…
6º) and of course how to load the Sklearn saved model weights …
it is clear on Keras the equivalent ones: model.save(‘filename.h5) and,
load_model(‘filename.h5’)
regards,
JG
Thanks.
Agreed, me too.
Great experiments!
This shows how to sae an sklearn model:
https://machinelearningmastery.com/save-load-machine-learning-models-python-scikit-learn/
And this:
https://machinelearningmastery.com/how-to-save-and-load-models-and-data-preparation-in-scikit-learn-for-later-use/
I believe if you wrap a keras model in sklearn wrapper class, it cannot be saved (easily).
Thank you Jason.
You really provide a great added ML value !
Thanks!
Thank you Jason for all your help! This website is a fantastic resource! Any post you make is an invaluable treat!!
Thank you!
Dear Jason,
first of all, great work you are doing, thanks so much. If I want to cross-validate this model,
is it correct to plug the RandomForest together with StandardScaler() and a linear model such as SVC() in a pipeline and to cross-validate it?
Here would be the code:
from sklearn.model_selection import cross_val_score
fs = SelectFromModel(RandomForestClassifier(n_estimators=1000), max_features=30)
model=SVC()
model_=make_pipeline(StandardScaler(),fs,model)
scores = cross_val_score(model_, X, y, cv=20)
np.round(np.mean(scores),2)
You can use feature importance as one step in a pipeline.
Dear Jason,
thank you so much for your fast reply- I don’t understand, I didn’t mean feature importance but if the cross-validation is legit if I plug the SelectFromModel RandomForest in a pipeline.. but I guess it is (?)
Yes, you can use that approach.
Hi Jason. This tutorial is exactly what I needed and I’m using Random Forest to find feature importance. My objective is not to make any predictions but just to see which variables are important to explain my dependent variable. So keeping this objective in mind, am I supposed to split my data in training and testing sets or in this case splitting is not required? This is an urgent question and would highly appreciate if you could reply fast
Perhaps just use all data to estimate the feature importance. E.g. it sounds like an analysis task rather than a prediction task.
Hi bro, how to select the PermutationImportance feature by applying RFRegressor
What problem are you having exactly?
Hi Jason
In your article above, the Logistic Regression Feature Importance gave coefficients that are positive and negative. I myself don’t like using sklearn and prefer to use statsmodels for regression and LR as I am able to obtain meaningful information (such as t stats and p values). When doing the regression with statsmodels, I got the same coefficients as you. But what is interesting is that statsmodels added a warning:
ConvergenceWarning: Maximum Likelihood optimization failed to converge.
Even when choosing other optimization methods, the results were the same (unable to converge) with all t-stats and p-values NaN
Interesting, thanks for sharing!
Hi dear Jason
How can I see the ranking of selected features in the SelectFromModel?
I still confuse about feature importance sir. Could you help me ? if I use DecisionTreeClassifier() and then i use importance = model.feature_importances. So, Could I say that the output of the importance variable which is the score is the gini index value? Another case How can I find out the Gini index score as the feature selection of a model?
You would not use the importance in the tree, you could use it for some other purpose, such as explaining to project stakeholders how important each input is to the predictive model.
Hi Jason,
I have physiological data where 120 data points recorded per sec. I used feature importance score and found that timestamp has more importance score than other features, even though timestamp has no correlation with other features. Why timestamp has more important score than other features? Any idea?
Thanks
It may suggest an autocorrelation, e.g. try an ACF/PACF plot for the variable being predicted.
Thanks for your prompt response. I will take a look at ACF/PACF but predicting score was around 90% for test data.
I also looked at correlation matrix where other features are correlated with each other but timestamp is poorly correlated with other features. But the same dataset provides the more important score for the timestamp. Therefore, I’m confused that I did something wrong or not. How can I verify the important score of timestamp and other features are correct?
The score is just a guide, it is neither correct nor not incorrect.
Instead, evaluate a model with and without a given feature to see if it helps in making predictions.
Thanks, Jason.
I tried with and without timestamp features where without timestamp prediction score was only 66% and 90% with that features. So, I assume it’s an important feature to predict.
However, the timestamp is poorly correlated with other features but the importance score of timestamp is 0.35 whereas other features score was from 0.05 to 0.16. What do you think about it?
I think feature importance for time series data is very different from tabular data and instead, you should be using pacf/acf plots.
I think time series models and data prep must be evaluated using walk-forward validation to avoid data leakage.
I think you should use whatever works best on a robust test harness.
So how could i know the gini index in a model ? I need your suggestion
Sorry, I don’t have an example of calculating this metric for a model.
As we see above , That there are the multiple classifiers for calculating the feature importance , So how to choose that which method is best either Random Forest or Logistic regression or etc ?
Good question, I answer this question here:
https://machinelearningmastery.com/faq/single-faq/what-feature-importance-method-should-i-use
Should I first find the best hyperparameters (min_depth,min_samples_leaf, etc.) and then find the feature importances?
Also, when do you recommend dropping the features using their importance values?
Good question. I generally avoid tuning models before calculating feature importance.
Removing features is a step before modeling, e.g. data preparation.
Hello,
Any example about how to get node importance when having a graph database (neo4j)?
Thanks
No, sorry.
Hi Jason,
Could you clarify if the values obtained by permutacion_importance() function (or the other), related to features coefficients are any absolute meaning or normalized meaning? I do not see it …or by the contrary must be interpreted only as relative or ranking (coefficient) values?
regards
JG
I believe the scores are relative, not absolute.
E.g. relative to each other for a specific run + dataset + model.
Hi Jason,
What are the different algorithm used for determining feature importance like e.g., random forest regressor?
I mean whether KNN can able to determine the feature importance?
I don’t think knn can determine feature importance.
Thanhttps://machinelearningmastery.com/calculate-feature-importance-with-python/#respondks
You’re welcome.
Hi Jason,
I have used Random Forest on my data and get 4 most important features. When I use whole data, I get 99% accuracy. And when I use those 4 important features I still get almost the same accuracy (which seems logical). But the thing is that when I use other features (removing those 4 features), I get around 95% accuracy which is lower but still is good. Is it logical or something might be wrong with my model? I use Random Forest as the model to compare the accuracies.
Yes, it means the other features are adding statistical noise or adding some value to the model.
Hi jason,
I love your work. I had a question regarding scikit learn Permutation Importance. I am using a Keras binary classification model, it gives the probability as its prediction and not the class value. So I was hoping if there is a way to not use Keras Wrapper class, and just modify the scorer function to get the feature importance. Can you tell me if that is indeed possible?
Thanks
Perhaps try it and see.
Hi Jason,
I am a fresher in this area. I have been trying to build a propensity score with close to 200,000 observations and 203 variables. Do you think your methods given above will give me a good understanding of the variables I should choose for XGboost ? Or should I narrow down my variables further ???
Your blogs are very helpful, is it possible that I can get in touch with you over google meet, so that I can clear my doubts?
Thank you
A quick calculation tells 200,000 divided by 203 is roughly 1000. It should give plenty of variations to each variable so the model can learn the rules from the data. So you have a good chance to make it work.
Can i use permutation importance function on spark mllib models?
Why do you think you cannot?
Hi everyone,
Thanks for your comments. My doubt is about the last which is “Feature Selection with Importance”.
In the example above, they already know the number of features to select (max_features = 5), since they created their own dataset. However, how can you know which value can be suitable for that parameter? How can you set a threshold for a given dataset?
I wonder if it is necessary to train the model with different amount of features (different values for max_features) and then compare them.
Hope someone can help!
Thank you.
You don’t! Or you already have an idea of how much max_features you need because your computer has limited memory, etc. So you’re correct, we experiment with different values for max_features to see which trade off makes sense.
Hi Jason,
Thank you for this tutorial! Is it possible that permutation importance for some or all of the variables becomes higher than 1? I use R2 for scoring and I get numbers that are higher than 1 for some models like Ridge and Huber. For each model, I have something like this:
model.fit(X_train, y_train)
result = permutation_importance(model, X_test, y_test, scoring=’r2′)
importance_score = result.importances_mean
Do you think I’m doing something wrong?
R2 should not be higher than 1 – mathematically impossible. Is there something wrong?
Thank you for your reply. That’s why I’m confused. I’m just using the code above to compute permutation importance. But, some models create permutation importance that is higher than 1. I was wondering if you know what might have caused this problem.
No idea. It doesn’t sound like possible to me if you’re using R^2
Hi Jason,
Thank you for this tutorial. Do the feature_importances_ property and Permutation Feature Importance have same results or their results are different?
Hi Ali…They will not be exact, however they should in general lead to similar conclusions regarding the relative “feature importance”. I would highly recommend that both be used before making final decisions to remove features based upon low scores.
Hi Jason,
Thank you for this tutorial . I am traying to working on optimizing feature weight in Analogy based effort estimation (similar to KNN Regressor) by optimize the similarity distance . the objective function will be to minimize the accuracy measures.
I need to aske about How to validate my final model with cross-validation ?
hi we can short this introduction use
model=[LinearRegression(), LogisticRegression().
the generate once the data
and use
model.fit
model.predict
for all models …
Thank you for the feedback Michael!
Hello folks,
I have a quick question to people more knowledgeable than I am in term of statistical metrics,
let’s say, I have the result of a SVM classifier alpha + retained observations A.K.A support vectors,
so if I multiply each support vectors by it’s alpha value then run a logistic regression with that result using the original y-true to fit, would the resulting weights correspond to some kind of “feature importance” as they draw “linear correlation strength” for that specific training set? (I discard the bias concern). Thank you in advance for telling me if I am flying high or not.
Hi Mat…the following may be helpful:
https://machinelearningmastery.com/feature-selection-with-real-and-categorical-data/
Why do the results make sense?
If make_classification creates the meaningful features first, shouldn’t the importance scores find them the most important?
Does it seem as if the classifier didn’t pick it?
Ok, since the shuffle parameters of make_calssification is True, the order is not as I thought 🙂
My mistake.
Thank you for the feedback! Keep up the great work Idan!
My apologies if this was already asked (I must have missed it). With the feature importance can the feature name be included in the output – as opposed to ‘Feature: 0’ , ‘Feature: 1’ , etc…
Hi Tim…This is possible. The following discussion may be helpful:
https://stackoverflow.com/questions/61508922/keeping-track-of-feature-names-when-doing-feature-selection
How can i handle a case where my dataset is a combination of categorical and numeric data. How would perform the feature importance. Thanks.
Bumping because I have the same question as Rodney. How is Feature Importance determined for a mix of categorical and numerical features? Does it make sense to encode the categoricals as numerical features and then determine Feature Importance? If so, would that introduce a lot of extraneous features for feature importance? Not clear how to approach this situation.
Hi Json
In above post when interpreting coefficients for logistic regression how do we say that The positive scores indicate a feature that predicts class 1, whereas the negative scores indicate a feature that predicts class 0 ? thanks.
Permutation importance seem sensitive to n_estimators in GradientBoostingClassifier. With my data all is fine with default setting of 100 but down at 40 the results all return as zero’s
is it possible to perform feature importance with AdaBoost Regressor?
Hi Valentin…You may find the following resource of interest:
https://stackoverflow.com/questions/36665511/scikit-adaboost-feature-importance
Hi,
Can you let me know how to do feature importance for clustering model such as kmeans.
Thanks
Hi akshay…You may find the following resource of interest:
https://towardsdatascience.com/interpretable-k-means-clusters-feature-importances-7e516eeb8d3c
Hi Jason,
Thank you for your article. I am always learning a lot from your blogs.
Just one quick question, How are the results of feature importance score from random forest classification reflected in the decision tree? I have extracted the top 10 most important features and made a decision tree where a top decision node (root node) is not the top 1st feature. Could you explain how they are related? feature importance calculation using RFC and a decision tree?
Thanks!
Hi Katie…You are very welcome! The following resource provides a mathematical basis that may add clarity:
https://towardsdatascience.com/the-mathematics-of-decision-trees-random-forest-and-feature-importance-in-scikit-learn-and-spark-f2861df67e3
Hi Jason and all,
thanks for all the tutorials, they have been very helpful.
I have a quick question. I want to run RF over a large dataset and I need to look into the feature importance. At the same time I want to get the best model I can obtain using a nested CV. So, my question is, where in the nested CV should I check the feature importance? should I do that inside of the outer loop and somehow get an average, or do I run, for example the permutation approach, on the final model (fitted over the entire dataset) ?
Thanks a lot for any suggestions
Cheers
Nico
Hi Nico…The following may be of interest:
https://machinelearningmastery.com/feature-importance-and-feature-selection-with-xgboost-in-python/
I find most of your post valuable regarding the technical coverage but your insistence on using artificial datasets instead of public datasets, is a major downside and makes your posts have a lot less value and interest.
Most of the action is in the dealing with real features (that are meaningful) and the efforts in feature selection.
When your post states that feature 08 is important, this has little value, because in the real-world it is the discoveries of hidden relationships in known features that is a big part of the game, that is the great action in the storytelling.
Thank you for your feedback Paulo! We appreciate it.
Great!!!!!!!!!! Thank you Dear.
You are very welcome Getnet!
Hi, great post. I want to know if its is possible to calculate feature importance scores when using stacked model i.e. I have multiple models stacked. I want to know your opinion how can it be done?
Hi Anjali…The following resources may be of interest to you:
https://machinelearningmastery.com/stacking-ensemble-machine-learning-with-python/
https://www.analyticsvidhya.com/blog/2021/08/ensemble-stacking-for-machine-learning-and-deep-learning/
Dear Dr. Brownlee,
Any threshold to determine which feature is good explanatory variable? Any academic article for reference?
Hi Nguyen…A mathematical basis can be found here:
https://towardsdatascience.com/the-mathematics-of-decision-trees-random-forest-and-feature-importance-in-scikit-learn-and-spark-f2861df67e3
Hi!
Thanks for your paper!
It helped me to increase my score a little bit in Titanic Disaster competition on kaggle .
I have a question: why we need to perfom permutation feature importance analysis if we can simply perform removal feature analysis.
I mean to remove feature and train our models several times, when take a mean value of target metric and look at the difference between target metrics gained by base model and by model which was trained without a particular feature?
Hi Artem…The following resource may be of interest to you:
https://machinelearningmastery.com/feature-selection-with-real-and-categorical-data/
Hi, thank you for the article. Just wanted to find out how can I obtain the feature names from the feature importance score. I had done some one-hot encoding on my categorical features and did a cross-validate using the BalancedRandomForestClassifier. However, I would like to find out which feature and their scores that contributed to the results. How can I do that?
To obtain the feature names along with their importance scores from a model like
BalancedRandomForestClassifier, especially after one-hot encoding your categorical features, you can follow these steps:1. **Fit the Model**: First, ensure that your
BalancedRandomForestClassifieris properly trained with your dataset.2. **Retrieve Feature Importances**: After training, you can access the feature importance scores using the
feature_importances_attribute of the classifier.3. **Match Encoded Features with Original Features**: This is where it gets a bit tricky with one-hot encoded features. You need to map these encoded feature names back to your original feature names.
4. **Sort and Display Feature Importances**: For better understanding, you might want to sort these features based on their importance scores.
Here’s an example of how you can do this in Python:
pythonimport pandas as pd
from sklearn.ensemble import BalancedRandomForestClassifier
from sklearn.preprocessing import OneHotEncoder
from sklearn.model_selection import train_test_split
# Example dataset
# df = pd.read_csv('your_dataset.csv')
# Separate features and target
X = df.drop('target_column', axis=1)
y = df['target_column']
# One-hot encoding
encoder = OneHotEncoder(sparse=False)
X_encoded = encoder.fit_transform(X)
# Splitting the dataset
X_train, X_test, y_train, y_test = train_test_split(X_encoded, y, test_size=0.2, random_state=42)
# Train the model
model = BalancedRandomForestClassifier(random_state=42)
model.fit(X_train, y_train)
# Get feature importances
importances = model.feature_importances_
# Match encoded feature names to original feature names
encoded_feature_names = encoder.get_feature_names_out(input_features=X.columns)
feature_importances = pd.DataFrame({'feature': encoded_feature_names, 'importance': importances})
# Sort by importance
feature_importances = feature_importances.sort_values('importance', ascending=False)
# Display
print(feature_importances)
This code will give you a dataframe with each one-hot encoded feature and its corresponding importance score. Remember that in one-hot encoding, each unique value of a categorical feature becomes a new feature. Therefore, the feature names in the importance list will correspond to these new features. You can trace them back to the original categorical variables based on the naming convention used by the
OneHotEncoder.