
It is important to both present the expected skill of a machine learning model a well as confidence intervals for that model skill.
Confidence intervals provide a range of model skills and a likelihood that the model skill will fall between the ranges when making predictions on new data. For example, a 95% likelihood of classification accuracy between 70% and 75%.
A robust way to calculate confidence intervals for machine learning algorithms is to use the bootstrap. This is a general technique for estimating statistics that can be used to calculate empirical confidence intervals, regardless of the distribution of skill scores (e.g. non-Gaussian)
In this post, you will discover how to use the bootstrap to calculate confidence intervals for the performance of your machine learning algorithms.
After reading this post, you will know:
- How to estimate confidence intervals of a statistic using the bootstrap.
- How to apply this method to evaluate machine learning algorithms.
- How to implement the bootstrap method for estimating confidence intervals in Python.
Kick-start your project with my new book Statistics for Machine Learning, including step-by-step tutorials and the Python source code files for all examples.
Let’s get started.
- Update June/2017: Fixed a bug where the wrong values were provided to numpy.percentile(). Thanks Elie Kawerk.
- Update March/2018: Updated link to dataset file.

How to Calculate Bootstrap Confidence Intervals For Machine Learning Results in Python
Photo by Hendrik Wieduwilt, some rights reserved.
Bootstrap Confidence Intervals
Calculating confidence intervals with the bootstrap involves two steps:
- Calculate a Population of Statistics
- Calculate Confidence Intervals
Need help with Statistics for Machine Learning?
Take my free 7-day email crash course now (with sample code).
Click to sign-up and also get a free PDF Ebook version of the course.
1. Calculate a Population of Statistics
The first step is to use the bootstrap procedure to resample the original data a number of times and calculate the statistic of interest.
The dataset is sampled with replacement. This means that each time an item is selected from the original dataset, it is not removed, allowing that item to possibly be selected again for the sample.
The statistic is calculated on the sample and is stored so that we build up a population of the statistic of interest.
The number of bootstrap repeats defines the variance of the estimate, and more is better, often hundreds or thousands.
We can demonstrate this step with the following pseudocode.
|
1 2 3 4 5 |
statistics = [] for i in bootstraps: sample = select_sample_with_replacement(data) stat = calculate_statistic(sample) statistics.append(stat) |
2. Calculate Confidence Interval
Now that we have a population of the statistics of interest, we can calculate the confidence intervals.
This is done by first ordering the statistics, then selecting values at the chosen percentile for the confidence interval. The chosen percentile in this case is called alpha.
For example, if we were interested in a confidence interval of 95%, then alpha would be 0.95 and we would select the value at the 2.5% percentile as the lower bound and the 97.5% percentile as the upper bound on the statistic of interest.
For example, if we calculated 1,000 statistics from 1,000 bootstrap samples, then the lower bound would be the 25th value and the upper bound would be the 975th value, assuming the list of statistics was ordered.
In this, we are calculating a non-parametric confidence interval that does not make any assumption about the functional form of the distribution of the statistic. This confidence interval is often called the empirical confidence interval.
We can demonstrate this with pseudocode below.
|
1 2 3 |
ordered = sort(statistics) lower = percentile(ordered, (1-alpha)/2) upper = percentile(ordered, alpha+((1-alpha)/2)) |
Bootstrap Model Performance
The bootstrap can be used to evaluate the performance of machine learning algorithms.
The size of the sample taken each iteration may be limited to 60% or 80% of the available data. This will mean that there will be some samples that are not included in the sample. These are called out of bag (OOB) samples.
A model can then be trained on the data sample each bootstrap iteration and evaluated on the out of bag samples to give a performance statistic, which can be collected and from which confidence intervals may be calculated.
We can demonstrate this process with the following pseudocode.
|
1 2 3 4 5 6 |
statistics = [] for i in bootstraps: train, test = select_sample_with_replacement(data, size) model = train_model(train) stat = evaluate_model(test) statistics.append(stat) |
Calculate Classification Accuracy Confidence Interval
This section demonstrates how to use the bootstrap to calculate an empirical confidence interval for a machine learning algorithm on a real-world dataset using the Python machine learning library scikit-learn.
This section assumes you have Pandas, NumPy, and Matplotlib installed. If you need help setting up your environment, see the tutorial:
First, download the Pima Indians dataset and place it in your current working directory with the filename “pima–indians-diabetes.data.csv” (update: download here).
We will load the dataset using Pandas.
|
1 2 3 |
# load dataset data = read_csv('pima-indians-diabetes.data.csv', header=None) values = data.values |
Next, we will configure the bootstrap. We will use 1,000 bootstrap iterations and select a sample that is 50% the size of the dataset.
|
1 2 3 |
# configure bootstrap n_iterations = 1000 n_size = int(len(data) * 0.50) |
Next, we will iterate over the bootstrap.
The sample will be selected with replacement using the resample() function from sklearn. Any rows that were not included in the sample are retrieved and used as the test dataset. Next, a decision tree classifier is fit on the sample and evaluated on the test set, a classification score calculated, and added to a list of scores collected across all the bootstraps.
|
1 2 3 4 5 6 7 8 9 10 11 12 |
# run bootstrap stats = list() for i in range(n_iterations): # prepare train and test sets train = resample(values, n_samples=n_size) test = numpy.array([x for x in values if x.tolist() not in train.tolist()]) # fit model model = DecisionTreeClassifier() model.fit(train[:,:-1], train[:,-1]) # evaluate model predictions = model.predict(test[:,:-1]) score = accuracy_score(test[:,-1], predictions) |
Once the scores are collected, a histogram is created to give an idea of the distribution of scores. We would generally expect this distribution to be Gaussian, perhaps with a skew with a symmetrical variance around the mean.
Finally, we can calculate the empirical confidence intervals using the percentile() NumPy function. A 95% confidence interval is used, so the values at the 2.5 and 97.5 percentiles are selected.
Putting this all together, the complete example is listed below.
|
1 2 3 4 5 6 7 8 9 10 11 12 13 14 15 16 17 18 19 20 21 22 23 24 25 26 27 28 29 30 31 32 33 34 35 36 |
import numpy from pandas import read_csv from sklearn.utils import resample from sklearn.tree import DecisionTreeClassifier from sklearn.metrics import accuracy_score from matplotlib import pyplot # load dataset data = read_csv('pima-indians-diabetes.data.csv', header=None) values = data.values # configure bootstrap n_iterations = 1000 n_size = int(len(data) * 0.50) # run bootstrap stats = list() for i in range(n_iterations): # prepare train and test sets train = resample(values, n_samples=n_size) test = numpy.array([x for x in values if x.tolist() not in train.tolist()]) # fit model model = DecisionTreeClassifier() model.fit(train[:,:-1], train[:,-1]) # evaluate model predictions = model.predict(test[:,:-1]) score = accuracy_score(test[:,-1], predictions) print(score) stats.append(score) # plot scores pyplot.hist(stats) pyplot.show() # confidence intervals alpha = 0.95 p = ((1.0-alpha)/2.0) * 100 lower = max(0.0, numpy.percentile(stats, p)) p = (alpha+((1.0-alpha)/2.0)) * 100 upper = min(1.0, numpy.percentile(stats, p)) print('%.1f confidence interval %.1f%% and %.1f%%' % (alpha*100, lower*100, upper*100)) |
Running the example prints the classification accuracy each bootstrap iteration.
A histogram of the 1,000 accuracy scores is created showing a Gaussian-like distribution.
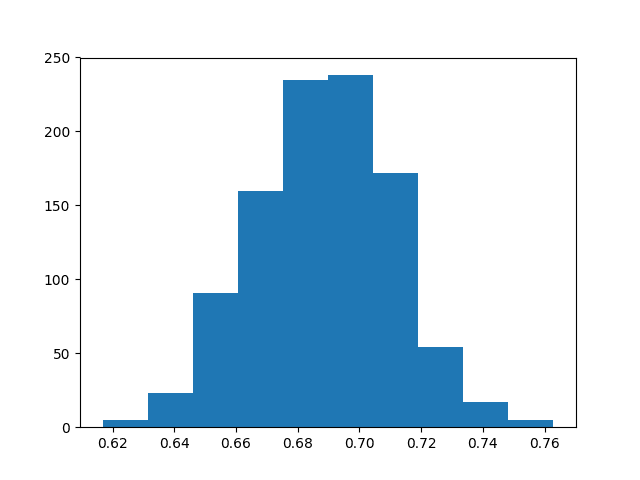
Distribution of Classification Accuracy Using the Bootstrap
Finally, the confidence intervals are reported, showing that there is a 95% likelihood that the confidence interval 64.4% and 73.0% covers the true skill of the model.
|
1 2 3 4 5 6 7 |
... 0.646288209607 0.682203389831 0.668085106383 0.673728813559 0.686021505376 95.0 confidence interval 64.4% and 73.0% |
This same method can be used to calculate confidence intervals of any other errors scores, such as root mean squared error for regression algorithms.
Further Reading
This section provides additional resources on the bootstrap and bootstrap confidence intervals.
- An Introduction to the Bootstrap, 1996
- Bootstrap Confidence Intervals, Statistical Science, 1996
- Section 5.2.3, Bootstrap Confidence Intervals, Empirical Methods for Artificial Intelligence
- Bootstrapping on Wikipedia
- Section 4.4 Resampling Techniques, Applied Predictive Modeling
Summary
In this post, you discovered how to use the bootstrap to calculate confidence intervals for machine learning algorithms.
Specifically, you learned:
- How to calculate the bootstrap estimate of confidence intervals of a statistic from a dataset.
- How to apply the bootstrap to evaluate machine learning algorithms.
- How to calculate bootstrap confidence intervals for machine learning algorithms in Python.
Do you have any questions about confidence intervals?
Ask your questions in the comments below.
Get a Handle on Statistics for Machine Learning!

Develop a working understanding of statistics
...by writing lines of code in python
Discover how in my new Ebook:
Statistical Methods for Machine Learning
It provides self-study tutorials on topics like:
Hypothesis Tests, Correlation, Nonparametric Stats, Resampling, and much more...
Discover how to Transform Data into Knowledge
Skip the Academics. Just Results.


Thank you Jason
I’m glad you found the post useful.
Where can i get your book “Mastering machine learning with python”
Here:
https://machinelearningmastery.com/machine-learning-with-python/
Sir ,how we can apply bootstrap resampling for software effort interval prediction and what is the procedure and initial steps that are to be followed.
Collect your data, load it in Python and apply the procedure to estimate the desired quantity.
Which part are you struggling with exactly?
Thank you Jason,
Are you considering to include the posts on confidence intervals in a previous (or new) book?
Regards
Elie
Hi Elie,
Not especially. I have a soft idea of “statistical methods for machine learning” or something to that effect that could cover topics like sampling theory and confidence intervals. Posts like this are a test to see if there is interest.
Why do you ask? Is this a topic for which you’re looking for more help?
Yes,
I actually find posts like these very useful for reporting statistically meaningful results for machine learning. Here’s a nice free book link on the subject: https://www.otexts.org/book/sfml
Regards
Jason,
I have another question. How do we report confidence intervals on an evaluation done on a hold-out set? We cannot apply the bootstrap with training here since this would contaminate our results.
Regards
Generally, you can repeat the holdout process many times with different random samples and use the outcomes as your population of results.
I agree, it’s a great book!
Wouldn’t it be suitable to apply the bootstrap by sampling from one hold out set for a certain number of iterations without any training involved?
As in only resampling the set used to evaluate the skill of the model?
No, I don’t think this would be valid.
Jason,
Something seems not to make sense in the confidence interval you obtain. The one you calculate is [61.5, 63.9]. However the mean (that I obtain) is about 69% (similar to the one you get from the graph) and visually one can inspect and estimate the 95% CI to be [64, 74]. I think there is something wrong.
Please correct me if I am wrong.
Regards
Elie
You are correct Elie, thank you so much.
The values provided to numpy.percentile() must be in [0,100] and I was providing them in [0,1].
I have fixed the example and made it clearer how the percentile values are calculated (so they can be debugged by the skeptical developers we should be).
I really appreciate you finding this and the comment. It makes the example better for everyone!
np.quantile(q) = np.percentile(p) for q=p/100
I love the piece of cake notes about ML.
Thanks Dawit.
Hi Jason, thanks for this post. Is the concept of fitting your classifier using a training set and calculating it’s accuracy on unseen data (a holdout set) now outdated? It seems to me that CV is testing how good your algorithm (with optimized parameters) is at building a model, in that the model is re-fitted in each fold prior to testing it on the held-out fold. It doesn’t seem to predict how a trained model will work once it is put into production and starts having to classify completely new instances. For that, I can’t see any option other than training on the full training set and testing against the hold out set – am I missing something ?
Cross Validation (CV) is doing the same thing, just repeated 10 times, for 10-fold CV.
CV and train/test splits are both resampling methods intended to estimate the skill of the model on unseen data. Perhaps this post will clear things up for you:
https://machinelearningmastery.com/train-final-machine-learning-model/
On many problems where we have millions of examples (e.g. deep learning) we often do not have the resources for CV.
Thanks for the link – that clarifies a lot of things ! In summary, is it correct to say where you have the processing power and time to perform it, k-fold validation is always going to be the superior option as it provides means, standard deviations and confidence intervals ?
CV will give a less biased estimate of model skill, in general. This is the key objective of the method.
I often use a bootstrap to then present the final confidence interval for the chosen configuration.
Hi, thanks for this article. I’m after calculating confidence intervals for sensitivity and specificity. I’ve used your code, but changed the prep step to use the ‘train_test_split’ (with a random seed), to create samples of the data. Then, once per iteration, I’ve fitted a model and made predictions, then created a confusion matrix, and then worked out the sensitivity and specificity. Do you think that sounds reasonable? The results look sensible.
Thanks.
I think the bootstrap approach would work for other accuracy related measures.
Nice post (:
Might be useful to mention the bootsrapped package in case people are feeling lazy 😉
https://pypi.python.org/pypi/bootstrapped/0.0.1
Thanks for the link Ian.
Great post Jason. I was wondering if you think it might be feasible to use bootstrap method for neural nets to estimate confidence level?
Absolutely!
How can I estimate a 95% likelihood of classification accuracy for a particular unseen data point?
Suppose, I have three new data points x1, x2, x3. How can I estimate that my method has a 95% likelihood of classification accuracy between 80% and 85% for predicting, say, x2, but between 60% and 65% for predicting x1, and between 90% and 95% for predicting x3?
It sounds like you might be asking about a prediction interval instead of a confidence interval.
I cover this in my book on stats and I have a post on the topic scheduled for soon.
Until then see this article:
https://en.wikipedia.org/wiki/Prediction_interval
Thanks for the link!
Dear Dr Jason,
While I understand the general concept presented above, I am lost on one fine detail on
lines 21 and 23. It is about selection array [:,:-1] and [:,-1].
It is about
and
In other words, when there is an array, what is the difference between the selection methods.
and
Thank you,
Anthony of Sydney
Yes, we are selecting columns.
You can learn more about slicing arrays here:
https://machinelearningmastery.com/index-slice-reshape-numpy-arrays-machine-learning-python/
Dear Dr Jason,
Thank you for that reference. I admit I was having difficulty then. Today I understand.
Regards
Anthony of Sydney
Glad to hear it.
Hello,
can you please point to a reference for the expressions in line 32 and 34 of the complete example. frame?
p = ((1.0-alpha)/2.0) * 100
p = (alpha+((1.0-alpha)/2.0)) * 100
Thanks
Perhaps see the references at the end of the post.
Please ignore my previous comment. I just observed that alpha was set to .95.
They now make sense.
No problem.
Hi! Thanks very much for your post!
However I don’t understand your confidence intervals. If you wanted a 95% confidence interval shouldn’t you be setting your alpha to 0.05?
Cheers,
Santiago
Perhaps re-read the post. Remember that we want both sides, e.g. 2.5% gap on both sides of the mean.
Perhaps this will help:
https://machinelearningmastery.com/confidence-intervals-for-machine-learning/
it’s very intuitive. Thanks for writing it
Thanks.
Jason,
Thank you for writing this article!!
During my PhD in Physics, we had to fit unwieldy (highly) nonlinear functions to real data and it was essential for us (as “budding” scientists) to at least attempt to report on both the standard and systematic errors of our results.
While learning about and using propagation of error methods throughout school, it surprised me to learn so late in my studies that the bootstrap method was a (kosher) go-to method for (a simulated) estimate of standard error of parameters from such complicated functions.
When nature’s constituent parts at various scales appear to often exhibit non-linear interaction dynamics, one would think our engineer and science teaching forefathers (e.g. for engineers, physicists, chemists, biologists, etc.) would have emphasized merit and further study of this method, particularly in an era now heavily (re)focused more on phenomenological studies and less so on pure analytical theories.
To end on a high note, I’m still thankful for the advances in DS and ML for making such phenomenological studies, and basic predictive analytics accessible to the masses, and namely a laymen like me.
Thank you again for another great article!!
Thanks for sharing, I could not agree with you more.
In fact, more simulation/monte carlo methods should be taught in general.
Hi Jason,
Great article on this. It’s helped me immensely. I’ve been trying to apply this to getting CIs for AUC and after visualizing the sampling distribution it looks like it is a truncated normal distribution. Have you worked with these type of distributions when calculating CIs? Any advice would be much appreciated.
I have not sorry.
Perhaps try repeating the experiment 100+ times and then review the distribution, e.g. histogram and perhaps a statistical test.
I find this article very useful. I have been working on a data set where I am using RandomForestRegressor to predict 2 outputs (multi output ) and there are 17 predictors. I made the model and prediction but I want prediction intervals from them, I read papers jackknife and infinitesimal jackknife and quantile regression, and found out about foresci package which makes interval based on jackknife paper, but none of them explained the multi output case like how to find the interval for multivariate case. It will be helpful if you could give me some advice.
Thanks for the suggestion, I may cover the topic in the future.
Hi Jason, thank you very much, I love this article, is super helpful and clear.
I have one question: I’m currently interested in just the confidence intervals, I’ve noticed that varying the size of the sample gives me different intervals. I came across the Seaborn package that has a bootstrap function that takes samples that are 100% the size of the dataset [1].
Is it Ok to sample with a size equal to 100% of the dataset? Why do the intervals vary?
Thanks for any guide you could provide me.
[1] https://github.com/mwaskom/seaborn/blob/b9551aff1e2b020542a5fb610fec468b69b87c6e/seaborn/algorithms.py#L86
Yes, I believe using bootstrap samples that are 100% is a standard practice.
Hello!
Really helpful article, thanks a lot!
I want to ask: if we made not bootstrap, but some shufflesplit CV. And have a list of some metric values after it. Can we test the normality of this values (with shapiro test for example) and if we don’t reject null hypothesis, build a confidence interval for mean over this values with unknown standard deviation (x.mean +- t*s/sqrt(n))? I was trying to do something like that, but I don’t really confident in correctness of this computations.
Thanks for any advice you could give me!
Might be a bit messy, e.g. k mean values for m repeats with different splits.
Not sure about the implications sorry. Perhaps check in with a statistician?
Very nice article! Can you please suggest how can we use Bootstrapping with logistic regression? I want to change the C value in every iteration. How this can be done?
Thank you!
Sounds straightforward, what problem are you having exactly?
I am not sure how can I send series of C for logistic regression and which value will give me best solution. Can you provide me the syntax of doing this? Currently I am using LogReg.fit to do the logistic regression but not sure how can I allocate different C. Also, if C can be optimized?
Thank you!
Perhaps try a range of values for C on a log scale?
Hi, is there are reason why you don’t use replacement? And what is the ideal percentage of your original dataset that we should keep on each bootstrap? Is it just random?
Thanks
The bootstrap does use replacement.
The bootstrap size should match the original dataset size, that is a good heuristic.
Thanks
And should we care about stratification when resampling?
Yes, probably.
Thanks Jason! Great article, as always.
The mlxtend Python package has a nice implementation of the bootstrap, as well as the .632 and .632+ methods (bootstrap_point632.py). My only complaint is that it only takes one scoring function at a time as of now, but I’m working on a PR to make it more efficient for multiple scores. 🙂
Thanks for sharing.
Hello Dr. Jason Bronwlee,
It is very nice stuff. I want to calculate the Confidence intervals for XGBoost of H2o. I do not understand a few steps. I am applying data to XGBoost by splitting into train, valid and test assuming time series case. How can we put it into iterations? I would appreciate your guidance.
import numpy
from pandas import read_csv
from sklearn.utils import resample
from sklearn.metrics import accuracy_score
from matplotlib import pyplot
from xgboost import XGBRegressor
# load dataset
#data = read_csv(‘pima-indians-diabetes.data.csv’, header=None)
#values = data.values
# configure bootstrap
n_iterations = 100
n_size = int(len(hf_train) * 0.50)
# run bootstrap
stats = list()
for i in range(n_iterations):
# prepare train and test sets
#train = resample(values, n_samples=n_size)
#test = numpy.array([x for x in values if x.tolist() not in train.tolist()])
# fit model
import h2o
from h2o.estimators.xgboost import H2OXGBoostEstimator
h2o.init()
param = {
“ntrees” : 10000
, “nfolds” : 0
,”stopping_rounds” : 40
, “max_depth” : 25
,”stopping_tolerance” : 0.005
, “learn_rate” : 0.05
, “eta” : 0.3
, “sample_rate” : 0.8
, “subsample” : 1
, “col_sample_rate” : 1
, “col_sample_rate_per_tree” : 1
, “colsample_bylevel” : 1
, “min_rows” : 0.06
,”min_child_weight”: 1
, “sample_type” : “uniform”
, “normalize_type” : “tree”
,”nthread” : -1
, “max_bins” : 256
, “max_leaves” : 0
, “seed”: 1601
, “score_tree_interval”: 0
,”reg_lambda” : 0.1
,”reg_alpha” : 1/1
,”grow_policy” : “depthwise”
, “booster” : “gbtree”
}
from h2o.estimators import H2OXGBoostEstimator
model = H2OXGBoostEstimator(**param)
model.train(x = X, y = y, training_frame = hf_train, validation_frame = hf_valid)
# evaluate model
predictions = model.predict(hf_test)
score = model.model_performance(test_data= hf_test)
print(score)
stats.append(score)
# plot scores
pyplot.hist(stats)
pyplot.show()
# confidence intervals
alpha = 0.95
p = ((1.0-alpha)/2.0) * 100
lower = max(0.0, numpy.percentile(stats, p))
p = (alpha+((1.0-alpha)/2.0)) * 100
upper = min(1.0, numpy.percentile(stats, p))
print(‘%.1f confidence interval %.1f%% and %.1f%%’ % (alpha*100, lower*100, upper*100))
This is a common question that I answer here:
https://machinelearningmastery.com/faq/single-faq/can-you-read-review-or-debug-my-code
Thanks: That,s make sense.
You’re welcome.
Hello Dr. Jason,
I followed the step given the link above by “cutting the problem” into a small level. I have now been able to apply to the XGBoost H2o. I need still your guidance for a few things.
first: I want to divide the data into train,valid and test. The models are trained using the training data and scored using the validation data and obtain a final score of the model using test data. How can we change it.?
train = resample(values, n_samples=n_size)
test = numpy.array([x for x in values if x.tolist() not in train.tolist()])
Second: I do not understand why lower and upper confidence interval are same i.e.(4.4% and 4.4%). I am doing it for regression .For score I am using:
score = model.rmse()
You can use this function to split data into subsets:
https://scikit-learn.org/stable/modules/generated/sklearn.model_selection.train_test_split.html
Thank a lot: I have now posted my second question at Stackoverflow with reproducible codes.
https://stackoverflow.com/questions/60956655/bootstrap-confidence-intervals-for-xgboost-h2o-regression-python
Well done.
Hello Dr Jason: I am still looking for the answer my second question (in comments 31March).
In your example. When we print(score), we will the score equal to the number of n_iterations.This is how we can plot the histogram.
score = accuracy_score(test[:,-1], predictions)
print(score)
IN my case: XGBoost h2o. (whole codes can be seen in Stackoverflow). I get the single value for the score when we do n_iterations. This is the problem. How can we solve it?
predictions = model.predict(test_hf1)
score = model.rmse()
print(score)
Sorry, I don’t know about the h20 api, not sure I can give you advice. Perhaps contact their support?
Thanks a lot for the always prompt response. I have contacted with H2O. I am also working on it.
I’m happy to hear that, good luck!
I checked it with using LightGBM library it seem to have the same problem for the regression as I am getting with XGBoost H2o. It seems to me the codes does not work for the regression. It works well with the XGBoost classifier. Also it means that the problem is not pertain to specific API such H2o rather to applying to regression or classification. It works fine with classification.
I shall be very thankful to you if you can check it for regression.
Yes, the code example calculates accuracy, you must change this for regression to an error score like MSE.
Probably I could not explain my question. I did change to MSE/RMSE but the problem is not solved. It works perfectly only for classification case.
score = np.sqrt(mean_squared_error(yt, y_pred))
print(score)
stats.append(score)
# plot scores
pyplot.hist(stats)
pyplot.show()
# confidence intervals
alpha = 0.95
p = ((1.0-alpha)/2.0) * 100
lower = max(0.0, numpy.percentile(stats, p))
p = (alpha+((1.0-alpha)/2.0)) * 100
upper = min(1.0, numpy.percentile(stats, p))
print(‘%.1f confidence interval %.1f%% and %.1f%%’ % (alpha*100, lower*100, upper*100))
Sorry to hear that, why not? What is the problem you are having precisely?
I have now posted the issue at https://github.com/dmlc/xgboost/issues/5475
Try plotting the data to confirm there is a distribution. Perhaps there is not.
If there is, try changing the number of bins in the histogram plot.
Yes, I tried that too but did not work:
import seaborn as sns; sns.set()
sns.distplot(stats, hist=True, kde=False, bins=int(10), color = ‘blue’, hist_kws={‘edgecolor’:’black’})
Print the predicted values and look at them, ensure that there is some spread. Perhaps there isn’t in which case everything is working correctly.
Thanks a lot once again!! I have now plotted the prediction, the spread looks fine. It can be found here : https://github.com/dmlc/xgboost/issues/5475
Nice.
How about print the values of mean error from each run?
The problem is related to (I think) when we run iteration for bootstrapping and using print(score) we can get as many values for score as number of iteration for classification however, we do not get for regression rather we get single value for score during the iteration. But I do not know how to fix it.
It may not be a bug if the mean performance across runs does not change. It means the problem is trivial and the model is very stable.
I can not get the mean error from run when use print(error).
error = np.mean(predictions-y_test)
Use the sklearn library to calculate it:
https://scikit-learn.org/stable/modules/generated/sklearn.metrics.mean_squared_error.html#sklearn.metrics.mean_squared_error
Thanks! : I did already with different ways including sklearn
score = mean_squared_error(y_test,y_pred, squared= True)
with this functrion.
But nothing work. Is there any way we can incorporate rmse into loop like rmse[i] in your codes. Though I am trying myself too.
I did in R with XGBoost H2o. it works fine on small number of iteration. But I get problem with large iteration. I posted question at Stackoverflow (https://stackoverflow.com/questions/61019185/boostrapped-histogram-of-rmse-for-xgboost-regression-h2o-r-how-to-make-it-more).
Yes.
Sorry, I don’t have the capacity to prepare custom code for you.
Dr Jason, I have a question. If I happen to use a Random Forest Regressor, for instance, which already contains the bootstrap as a default parameter, would it be the case to not manually apply a bootstrap sampling, right? Thanks !
No, I don’t think so. They are different.
The model uses the bootstrap to ensemble trees.
You can use the bootstrap to get an estimate of model performance.
Hello! I found this post very useful, as many others:) I just have a quick question.
I am wondering at what stage in your pipeline you perform hyperparameter optimization (using 10 fold CV on the training set).
In your example, you fit a simple Decision Tree classifier on the whole training data at each bootstrap iteration (with default hyperparameters I suppose).
But what if I wanted to do report the performance of the best optimized model (e.g.SVM) with the confidence intervals as you describe here with this bootstrap procedure?
Would I need to repeat hyperparameter tuning to find the best C and gamma parameters (using 10 fold CV) on the training set at each bootstrapping iteration?
Or instead, would I do it only once as a preliminary step during the search for the best model before the bootstrapping resampling? and then use the best hyperparameters found, to fit my model iteratively during the bootstrapping in all iterations?
Thanks!
You’re welcome.
Within the resampling process, e.g. so-called nested cross-validation or nested bootstrap.
Or select model+config first, then use the bootstrap on the final model to estimate performance.
Just to confirm, if you select model+config first, you could not select it as a result of preliminary cross validation, correct? If you performed cross validation first (on the whole dataset) to select model+config and then performed bootstrapping to estimate performance, there would be a leakage of test data.
Also, if you were to do hyperparameter tuning within the resampling process, what model would you really be reporting on? Rather, every fitted model will probably not have the same chosen hyperparameters, so I guess you could only say ‘Classifier X does this well’, but not comment on its hyperparameters?
Hi Natalia…The following resource may be of interest to you:
https://machinelearningmastery.com/training-validation-test-split-and-cross-validation-done-right/
hi Jason,
Thank you for the post.. It was very useful and explanatory. I get the following error while trying to execute the code. Can you please direct me how to overcome this?
AttributeError: ‘DataFrame’ object has no attribute ‘tolist’
You’re welcome.
Sorry, to hear that, perhaps this will help:
https://machinelearningmastery.com/faq/single-faq/why-does-the-code-in-the-tutorial-not-work-for-me
Also, pandas version is 0.25.1. No upgrade required. What is the alternative to the tolist()
Update to pandas 1.0.3 or better.
Hi Jason,
Great stuff 🙂
I had a doubt about the test sizes in such bootstrapping-with-replacement methods. The approach pretty much means we are going to have different test set sizes for the same size of training data in every iteration. For example, I find that in my case, test size varies between 444 to 486.
Is it acceptable in general to compare/make use of accuracy scores (or other metrics) which have been arrived at using different test set sizes?
Or is it something we accept to live with, only in case of bootstrapping-with-replacement approach, since no better options are available?
Thanks
Typically the bootstrap sample size is configured to be the same size as the raw dataset.
Hello Jason, I have a question:
What I need to change if my metrics distribution is not a gaussian? I.E. the metrics that I get for each bootstrap created a list of metrics, let’s say 3000 metrics for each bootstrap dataset, but that list not follow a gaussian distribution (fail in shapiro test), how can I create a confidence interval?
Best regards from Brazil,
You can use the bootstrap directly, it does not assume a distribution.
Thanks Jason, but I don’t understand why isn’t necessary to assume a normal distribution, can you explain more or point out some links to read more about it? I was reading about non-parametric CI and they have a robust mathematical background about the distribution, why for this specific case is not necessary.
Yes, the whole idea of using the boostrap is because it is a nonparametric method that does not assume a distribution.
If you need further information, see the “Further Reading” section.
Jason, one last question: Can I evaluate a BCI in the test set (doing resampling over this set) to create a 95%CI for my prediction?
I make this question because I developed an HP optimization before the BCI.
It is calculated on one dataset with in and out samples each run. There is no train and test sets per se.
That is my problem Jason. I will briefly explain my pipeline:
– Hold out TRAIN/TEST split
– Hyper parameter optimization CV 5-Fold in TRAIN split
– Generate BCI intervals based in my the model’s prediction for TEST split. I.E. I generate N bootstrap sets from test, calculate a metric and then in the calculate the BCI.
I was reading more about and this could be a prediction interval problem, but still I don’t know a good method to get it. I was reading other post of yours:
https://machinelearningmastery.com/report-classifier-performance-confidence-intervals/
And I don’t know if it is suitable for my problem. I don’t want to train all my models again… So somehow it is possible to generate a CI based in test set prediction?
Thanks for sharing.
If it works for you, that is great, it is not the approach I would take as I stated earlier.
Hello,
In a multi-classfication problem I’m interested in knowing if the performance of my model (micro f1-score) is statistically significant over the baseline. Thus, I am looking for confidence intervals for the f1-score.
I want to use bootstrap, but since my model is large enough, I cannot afford to re-train and compute the f1-score each time.
What I have at my disposal is a prediction-file, that contains all predictions of my model for each test-example.
Does it make sense to apply bootstrap directly by sampling with replacement from these predictions and calculating f1-scores? Essentially, I will be leaving out some test-samples, calculating the f1-score on the subset and repeating until I have enough statistics to compute confidence intervals.
If not, do you have any suggestion on how I can proceed with this task?
Thank you in advance!
Off the cuff, no. You would be sampling predictions, not sampling the capability of the model.
Drop the confidence interval and use a different statistical test, e.g.:
https://machinelearningmastery.com/mcnemars-test-for-machine-learning/
Thank you for your quick reply!
I’ve tried the McNemar’s test although I’m still a bit confused. Is this test only applicable in a binary classification scenario? To my understanding the 2×2 contingency table is built using the predictions of both models (regardless of how many classes we have) and the ground truth.
I have found on the internet that Stuart-Maxwell (or generalised McNemar’s) test can be used on a multi-classification setting, although I didn’t find it implemented in any python library (hence I’m concerned about it’s validity).
Now, I know that model A has a higher f1-score than model B and McNemar’s test yields a p-value which is less than the critical value, e.g. p < 0.05.
Can I conclude that the difference between the performance of the two models is statistically significant, i.e. model A is better than model B?
Yes, if the result is better and significant, you can start to make claims.
You might also want to look at 2×5 cv:
https://machinelearningmastery.com/hypothesis-test-for-comparing-machine-learning-algorithms/
Hello Jason and gonconist,
Thank you Json for writing this article. After reading it I went to other sources of literature and it looks like that there are two ways in which the “bootstrap” is described:
1. As you explain in this article, the resampling is performed and the model is trained each time. (“Applied Predictive Modeling” book and paper “Evaluating Machine Learning Models for engineering problems” Reich, Y.)
2. The bootstrap method can be applied the statistical estimator to estimate its mean and variance. Literature supporting this:
– Book: An Introduction To Statistical Learning With Applications In R (Section 5.3.4)
– Paper: Estimating Neural Network’s Performance with Bootstrap: A Tutorial (Michelucci, U.) (section 4)
Thus to answer gonconist question, the approach you are suggesting can be used.
Thank you balvisio for the outstanding feedback and recommendations! We greatly appreciate it!
Hi Jason!
Thank you for this excellent post. We are trying to create a confidence interval for AUC. We have a dataset of 120k plus observations. Could we just resample the dataset with 80% of the data and run a train/test split instead of doing bootstrap with replacement? Or could we just run a train/test split on all the data 1000s of times? I am not clear why, from a stats theory standpoint, we should do bootstrap with replacement for the training set. After all, this results in a training set with duplicates whereas the method below does not.
auc_list = list()
# Begin bootstrap sampling
for i in range(num_iter):
df_resampled = df.sample(frac=0.8, replace=False)
y, X = df_resampled.pop(‘DEATH_90’), df_resampled
X_train, X_test, y_train, y_test = train_test_split(X, y, test_size=0.2)
clf.fit(X_train, y_train)
y_prob = clf.predict_proba(X_test)[:,1]
auc_score = roc_auc_score(y_test, y_prob)
auc_list.append(auc_score)
# Calculate lower & upper confidence interval
lower_ci = np.percentile(auc_list, ((1.0-alpha)/2.0) * 100)
upper_ci = np.percentile(auc_list, (alpha+((1.0-alpha)/2.0)) * 100)
Thanks for your help!
Yes, perhaps try a bootstrap as a first step.
Sorry, I don’t have the capacity to debug your code, these tips may help:
https://machinelearningmastery.com/faq/single-faq/can-you-read-review-or-debug-my-code
Thanks, Jason. Perhaps, I can rephrase the question without using any code. I have a dataset with 120k rows. Can I just run a train/test split 10,000 times without a random seed and with a data shuffle, so that the split is different every time, instead of using the bootstrap sample with replacement method? Using my method, there would be no duplicates in the training set and both the train and test sets would be the same size.
Nadaa
Sure.
The bootstrap simulates multiple samples when you don’t have much data.
Why use min and max when calculating the bounds?
The min and max are the very definition of “bounds”.
Hi.thanks for good post.
I have a question.
How i can apply this method in deep learning binary classfication using keras?
Please help me.
Thank you
Yes, sure.
Hi Jason,
This article was very useful for me as always. I have a question. when I use resample method it produces some NaNs. How can I handle this problem? My dataset do not have NaNs
Thanks.
Sorry, I don’t know why you are getting NaNs.
Perhaps try posting your code and error to stackoverflow.com
Hi Jason,
really good explanation. I was wondering how could I find a prediction interval for a multivariable nonlinear model. I want to show a plot of predicted data with the corresponding prediction interval bands. Should I use the percentile function in the predicted data for each X?.
Thanks.
Perhaps this would be a good starting point:
https://machinelearningmastery.com/prediction-intervals-for-machine-learning/
And this:
https://machinelearningmastery.com/prediction-intervals-for-deep-learning-neural-networks/
Hi, thanks for this article. I am an absolute beginner and have a few questions. It would be a great help to get your advice and ideas.
1. You mentioned “95.0 confidence interval 64.4% and 73.0%” – is it the same as saying 95% CI [64.4, 73.0]?
2. The “bootstrapped Python library” (https://pypi.org/project/bootstrapped/) allows you to build confidence intervals from data. It does not considers or asks for including the ML model. But in your approach, you included DecisionTreeClassifier. I am curious to know what are the differences between these two approaches of finding the CI? Is your approach finding something different?
3. It seems to me that you are choosing percentile for the confidence interval. But the bootstrap python lbirary authors are using Mean or SD for the confidence interval. Are these different options available? [honestly I am just starting to learn C.I.]
4. You said “A 95% confidence interval is used, so the values at the 2.5 and 97.5 percentiles are selected.” – could you please explain what exactly this means? From where you are getting these values of 2.5 and 97.5? and more importantly, I could not find these values on your codes. So how or where were these values used?
1. yes I think so.
2. I’ve not seen that lib. Here we are determining the CI for a model, that is why the model is included in the code.
3. Yes. Choose the representation you require.
4. Yes, see further reading section.
The following is WRONG, right?
“Area Under ROC Curve performance of the model X is 0.59, the 95% confidence interval calculated using bootstrapped re-sampling is [0.92-0.96].”
I used your codes on my data and this is what I got. What I might be doing wrong?
Perhaps this will help:
https://machinelearningmastery.com/faq/single-faq/why-does-the-code-in-the-tutorial-not-work-for-me
Or this:
https://machinelearningmastery.com/faq/single-faq/why-do-i-get-different-results-each-time-i-run-the-code
Not sure if this has been mentioned before, but a cleaner and a faster way would be to use a bagging regressor from sklearn. It can do the resampling internally for you in a more optimized fashion than with a for loop.
https://scikit-learn.org/stable/modules/generated/sklearn.ensemble.BaggingRegressor.html
Thanks for sharing.
Hi there, great tutorial!
I noticed here you use the percentile method for calculating the confidence interval rather than (for example) assuming the scores follow a normal distribution, and calculating the CI from that.
Is there a reason you used this method over others? Furthermore, is it permissible to calculate the standard error directly from the CI determined using the percentile method?
Hi Natalia…The following may help add clarity to how and when to use percentiles.
https://www.uvm.edu/~statdhtx/StatPages/Randomization%20Tests/ResamplingWithR/BootstMeans/bootstrapping_means.html
Hi, great article as always.
Experimentally I see that n_size has quite an impact on the confidence intervals. You set it to half the number of rows, is there a particular reason why ? I would like to understand what is the best value for n_size.
Hi Paul…The following would be a great resource for you in terms of understanding and applying optimization:
https://machinelearningmastery.com/optimization-for-machine-learning-crash-course/
Hi, very nice article! Would you please show an example from time series data? I mean how we can apply bootstrapping over time series data
Hi Atish…The following resource may be of interest:
https://stats.stackexchange.com/questions/25706/how-do-you-do-bootstrapping-with-time-series-data
Hello Mr. Jason
Thanks for the good article again.
I have one question. What is the difference between this method, the bootstrapping, and just using CV, like 5 or 10 fold, and getting some values of acc??
Hi…You are very welcome! The following resources may be of interest:
https://machinelearningmastery.com/a-gentle-introduction-to-the-bootstrap-method/
https://machinelearningmastery.com/k-fold-cross-validation/
Hello. When we use bootstrapping to calculate a sample statistic, such as the mean, we do not use the out-of-bag samples for anything. Is there a reference showing that we should use OOB to calculate the model metrics instead of, for instance, bootstrapping from a separate x_train dataset and predict on the same x_test for all bootstrapped samples?