A popular and widely used statistical method for time series forecasting is the ARIMA model.
ARIMA stands for AutoRegressive Integrated Moving Average and represents a cornerstone in time series forecasting. It is a statistical method that has gained immense popularity due to its efficacy in handling various standard temporal structures present in time series data.
In this tutorial, you will discover how to develop an ARIMA model for time series forecasting in Python.
After completing this tutorial, you will know:
About the ARIMA model the parameters used and assumptions made by the model.
How to fit an ARIMA model to data and use it to make forecasts.
How to configure the ARIMA model on your time series problem.
Kick-start your project with my new book Time Series Forecasting With Python, including step-by-step tutorials and the Python source code files for all examples.
Let’s get started.
Updated Apr/2019: Updated the link to dataset.
Updated Sep/2019: Updated examples to use latest API.
Updated Dec/2020: Updated examples to use latest API.
Updated Nov/2023: #####
Autoregressive Integrated Moving Average Model
The ARIMA (AutoRegressive Integrated Moving Average) model stands as a statistical powerhouse for analyzing and forecasting time series data.
It explicitly caters to a suite of standard structures in time series data, and as such provides a simple yet powerful method for making skillful time series forecasts.
ARIMA is an acronym that stands for AutoRegressive Integrated Moving Average. It is a generalization of the simpler AutoRegressive Moving Average and adds the notion of integration.
Let’s decode the essence of ARIMA:
AR (Autoregression): This emphasizes the dependent relationship between an observation and its preceding or ‘lagged’ observations.
I (Integrated): To achieve a stationary time series, one that doesn’t exhibit trend or seasonality, differencing is applied. It typically involves subtracting an observation from its preceding observation.
MA (Moving Average): This component zeroes in on the relationship between an observation and the residual error from a moving average model based on lagged observations.
Each of these components is explicitly specified in the model as a parameter. A standard notation is used for ARIMA(p,d,q) where the parameters are substituted with integer values to quickly indicate the specific ARIMA model being used.
The parameters of the ARIMA model are defined as follows:
p: The lag order, representing the number of lag observations incorporated in the model.
d: Degree of differencing, denoting the number of times raw observations undergo differencing.
q: Order of moving average, indicating the size of the moving average window.
A linear regression model is constructed including the specified number and type of terms, and the data is prepared by a degree of differencing to make it stationary, i.e. to remove trend and seasonal structures that negatively affect the regression model.
Interestingly, any of these parameters can be set to 0. Such configurations enable the ARIMA model to mimic the functions of simpler models like ARMA, AR, I, or MA.
Adopting an ARIMA model for a time series assumes that the underlying process that generated the observations is an ARIMA process. This may seem obvious but helps to motivate the need to confirm the assumptions of the model in the raw observations and the residual errors of forecasts from the model.
Next, let’s take a look at how we can use the ARIMA model in Python. We will start with loading a simple univariate time series.
Stop learning Time Series Forecasting the slow way!
Take my free 7-day email course and discover how to get started (with sample code).
Click to sign-up and also get a free PDF Ebook version of the course.
Shampoo Sales Dataset
The Shampoo Sales dataset provides a snapshot of monthly shampoo sales spanning three years, resulting in 36 observations. Each observation is a sales count. The genesis of this dataset is attributed to Makridakis, Wheelwright, and Hyndman (1998).
Save it to your current working directory with the filename “shampoo-sales.csv”.
Loading and Visualizing the Dataset:
Below is an example of loading the Shampoo Sales dataset with Pandas with a custom function to parse the date-time field. The dataset is baselined in an arbitrary year, in this case 1900.
When executed, this code snippet will display the initial five dataset entries:
1
2
3
4
5
6
7
Month
1901-01-01 266.0
1901-02-01 145.9
1901-03-01 183.1
1901-04-01 119.3
1901-05-01 180.3
Name: Sales, dtype: float64
Shampoo Sales Dataset Plot
The data is also plotted as a time series with the month along the x-axis and sales figures on the y-axis.
We can see that the Shampoo Sales dataset has a clear trend. This suggests that the time series is not stationary and will require differencing to make it stationary, at least a difference order of 1.
Pandas offers a built-in capability to plot autocorrelations. The following example showcases the autocorrelation for an extensive set of time series lags:
Running the example prints a summary of the fit model. This summarizes the coefficient values used as well as the skill of the fit on the on the in-sample observations.
First, we get a line plot of the residual errors, suggesting that there may still be some trend information not captured by the model.
ARMA Fit Residual Error Line Plot
Next, we get a density plot of the residual error values, suggesting the errors are Gaussian, but may not be centred on zero.
ARMA Fit Residual Error Density Plot
The distribution of the residual errors is displayed. The results show that indeed there is a bias in the prediction (a non-zero mean in the residuals).
1
2
3
4
5
6
7
8
count 36.000000
mean 21.936144
std 80.774430
min -122.292030
25% -35.040859
50% 13.147219
75% 68.848286
max 266.000000
Note, that although we used the entire dataset for time series analysis, ideally we would perform this analysis on just the training dataset when developing a predictive model.
Next, let’s look at how we can use the ARIMA model to make forecasts.
Rolling Forecast ARIMA Model
The ARIMA model can be used to forecast future time steps.
The ARIMA model is adept at forecasting future time points. In a rolling forecast, the model is often retrained as new data becomes available, allowing for more accurate and adaptive predictions.
We can use the predict() function on the ARIMAResults object to make predictions. It accepts the index of the time steps to make predictions as arguments. These indexes are relative to the start of the training dataset used to make predictions.
How to Forecast with ARIMA:
Use the predict() function on the ARIMAResults object. This function requires the index of the time steps for which predictions are needed.
To revert any differencing and return predictions in the original scale, set the typ argument to ‘levels’.
For a simpler one-step forecast, employ the forecast() function.
We can split the training dataset into train and test sets, use the train set to fit the model and generate a prediction for each element on the test set.
A rolling forecast is required given the dependence on observations in prior time steps for differencing and the AR model. A crude way to perform this rolling forecast is to re-create the ARIMA model after each new observation is received.
1
2
3
4
5
6
7
8
9
10
11
12
13
14
15
16
17
18
19
20
21
22
23
24
25
26
27
28
29
30
31
32
33
34
35
# evaluate an ARIMA model using a walk-forward validation
We manually keep track of all observations in a list called history that is seeded with the training data and to which new observations are appended each iteration.
Putting this all together, below is an example of a rolling forecast with the ARIMA model in Python.
Running the example prints the prediction and expected value each iteration.
We can also calculate a final root mean squared error score (RMSE) for the predictions, providing a point of comparison for other ARIMA configurations.
1
2
3
4
5
6
7
8
9
10
11
12
13
14
predicted=343.272180, expected=342.300000
predicted=293.329674, expected=339.700000
predicted=368.668956, expected=440.400000
predicted=335.044741, expected=315.900000
predicted=363.220221, expected=439.300000
predicted=357.645324, expected=401.300000
predicted=443.047835, expected=437.400000
predicted=378.365674, expected=575.500000
predicted=459.415021, expected=407.600000
predicted=526.890876, expected=682.000000
predicted=457.231275, expected=475.300000
predicted=672.914944, expected=581.300000
predicted=531.541449, expected=646.900000
Test RMSE: 89.021
A line plot is created showing the expected values (blue) compared to the rolling forecast predictions (red). We can see the values show some trend and are in the correct scale.
ARIMA Rolling Forecast Line Plot
The model could use further tuning of the p, d, and maybe even the q parameters.
Configuring an ARIMA Model
ARIMA is often configured using the classical Box-Jenkins Methodology. This process employs a meticulous blend of time series analysis and diagnostics to pinpoint the most fitting parameters for the ARIMA model.
The Box-Jenkins Methodology: A Three-Step Process:
Model Identification: Begin with visual tools like plots and leverage summary statistics. These aids help recognize trends, seasonality, and autoregressive elements. The goal here is to gauge the extent of differencing required and to determine the optimal lag size.
Parameter Estimation: This step involves a fitting procedure tailored to derive the coefficients integral to the regression model.
Model Checking: Armed with plots and statistical tests delve into the residual errors. This analysis illuminates the temporal structure that the model might have missed.
The process is repeated until either a desirable level of fit is achieved on the in-sample or out-of-sample observations (e.g. training or test datasets).
The process was described in the classic 1970 textbook on the topic titled Time Series Analysis: Forecasting and Control by George Box and Gwilym Jenkins. An updated 5th edition is now available if you are interested in going deeper into this type of model and methodology.
Given that the model can be fit efficiently on modest-sized time series datasets, grid searching parameters of the model can be a valuable approach.
For an example of how to grid search the hyperparameters of the ARIMA model, see the tutorial:
Hi Jason! Great tutorial.
Just a reeal quick question ..how can I fit and run the last code for multiple varialbles?..the dataset that looks like this:
Nice article, it helped me a lot.
I have a question as to how to make predictions in a scenario where you are attempting to make new predictions not included in the dataset.
For each item in the test set, after a prediction is made, the correct data point, taken from test, is added to the history.
How can I make predictions when I don’t have a test set to extract the right data points from?
have a question am doing a project concerning data analytics insights for retail company sales case study certain supermarket in my area and am proposing to use ARIMA can it be appropriate and how can i apply it
I have a usecase of timeseries forecasting where I have to predict sales of different products out of the electronics store. There are around 300 types of different products. And I have to predict the sales on the next day for each of the product based on previous one year data. But not every product is being sold each day.
My guess is I have to create a tsa for each product. but the data quality for each product is low as not each product is being sold each day. And my use case is that I have to predict sales of each product.
Any way I can use time series on whole data without using tsa on each product individually?
Hi I am trying to understand data set related to daily return of a stock. I calculated autocorrelation and partial autocorrelation function as a function of lag. I am observing
that ACF lies within two standard error limits. But I find PACF to be large value at few non-zero lags, one and two. I want to ask you is this behaviour strange ? ACF zero and PACF large and non-zero. If this behaviour not strange, then how does one arrive at the correct order of ARIMA model for this data.
hi. great tutorial.
what’s your advice for finding correlation between two data sets.
I have two csv file, one showing amount of money spent on advertising and one showing amount of sale. and I wanna find out effect of advertisement on sale and forecasting future sale with different amount of advertisement. I know one way is finding correlation with panda like:
sales_df[‘colx’].corr(spend_df[‘coly’])
but I wanna know is there a better way?
For some reason, I need to calculate residuals of a fitted ARMA-GARCH model manually, but found that the calculated residuals are different of those directly from the R package such rugarh. I put the estimated parameters back to the model and use the training data to back out the residuals. How to get the staring residuals at t=0, t=-1 etc. Should I treat the fitted ARMA-GARCH just as an fitted ARMA model? In that case why we need to fit an ARMA-GARCH model to the training data.
Hi Jason,
Could you do a GaussianProcess example with the same data. And compare the two- those two methods seem to be applicable to similar problems- I would love to see your insights.
Thanks. If you also did a comparative study of the two, that would be great- I realize that might be out of the regular, thought I’d still ask. Also can I sign up for email notification?
Hi, appreciate your great explanations, awesome! I wonder how will you load a statistics feature-engineered time series dataset/dataframe into ARIMA? Would appreciate if you have example or article. Thanks!
Hello,
I have climate change data for the past 8 years and I need to do a regression model using climate as a factor so I need at least climate data for 30 years which I can’t find online. Is it possible to get the previous 22 years climate change using ARIMA based on the last 8 years data.
Thank you
I am also working on a similar dataset which is univariate with a timestamp and a categorical value (around 150 distinct categories). Can we use an ARIMA model for this task?
What if there are multiple columns in dataset. For example: Instead of only 1 items like the shampoo, there could be a column with item numbers ranging from 1 – 20 and a column with number of stores and finally a column with respective sales?
OMG. Searching for weeks, never found an article like this one. Thank a lot.
I need your advice please,
I need to predict Retail sales data with variables like weather, sales Discount’, holiday etc.
Which is the best model is to use? And why?
How can decide the best fit model?
(Can I use SARIMAX for this?)
Hi Jason,
Recently I am working on time series prediction, but my research is a little bit complicated for me to understand how to fix a time series models to predict future values of multi targets.
Recently I read your post in multi-step and multivariate time series prediction with LSTM. But my problem have a series input values for every time (for each second we have recorded more than 500 samples). We have 22 inputs and 3 targets. All the data has been collected during 600 seconds and then predict 3 targets for 600 next seconds. Please help me how can solve this problem?
It is noticed we have trend and seasonality pulses for targets during the time.
Traceback (most recent call last):
File “/Users/kevinoost/anaconda/lib/python3.5/site-packages/pandas/io/parsers.py”, line 2276, in converter
date_parser(*date_cols), errors=’ignore’)
File “/Users/kevinoost/PycharmProjects/ARIMA/main.py”, line 6, in parser
return datetime.strptime(‘190’+x, ‘%Y-%m’)
TypeError: strptime() argument 1 must be str, not numpy.ndarray
During handling of the above exception, another exception occurred:
Traceback (most recent call last):
File “/Users/kevinoost/anaconda/lib/python3.5/site-packages/pandas/io/parsers.py”, line 2285, in converter
dayfirst=dayfirst),
File “pandas/src/inference.pyx”, line 841, in pandas.lib.try_parse_dates (pandas/lib.c:57884)
File “pandas/src/inference.pyx”, line 838, in pandas.lib.try_parse_dates (pandas/lib.c:57802)
File “/Users/kevinoost/PycharmProjects/ARIMA/main.py”, line 6, in parser
return datetime.strptime(‘190’+x, ‘%Y-%m’)
File “/Users/kevinoost/anaconda/lib/python3.5/_strptime.py”, line 510, in _strptime_datetime
tt, fraction = _strptime(data_string, format)
File “/Users/kevinoost/anaconda/lib/python3.5/_strptime.py”, line 343, in _strptime
(data_string, format))
ValueError: time data ‘190Sales of shampoo over a three year period’ does not match format ‘%Y-%m’
During handling of the above exception, another exception occurred:
Traceback (most recent call last):
File “/Users/kevinoost/PycharmProjects/ARIMA/main.py”, line 8, in
series = read_csv(‘shampoo-sales.csv’, header=0, parse_dates=[0], index_col=0, squeeze=True, date_parser=parser)
File “/Users/kevinoost/anaconda/lib/python3.5/site-packages/pandas/io/parsers.py”, line 562, in parser_f
return _read(filepath_or_buffer, kwds)
File “/Users/kevinoost/anaconda/lib/python3.5/site-packages/pandas/io/parsers.py”, line 325, in _read
return parser.read()
File “/Users/kevinoost/anaconda/lib/python3.5/site-packages/pandas/io/parsers.py”, line 815, in read
ret = self._engine.read(nrows)
File “/Users/kevinoost/anaconda/lib/python3.5/site-packages/pandas/io/parsers.py”, line 1387, in read
index, names = self._make_index(data, alldata, names)
File “/Users/kevinoost/anaconda/lib/python3.5/site-packages/pandas/io/parsers.py”, line 1030, in _make_index
index = self._agg_index(index)
File “/Users/kevinoost/anaconda/lib/python3.5/site-packages/pandas/io/parsers.py”, line 1111, in _agg_index
arr = self._date_conv(arr)
File “/Users/kevinoost/anaconda/lib/python3.5/site-packages/pandas/io/parsers.py”, line 2288, in converter
return generic_parser(date_parser, *date_cols)
File “/Users/kevinoost/anaconda/lib/python3.5/site-packages/pandas/io/date_converters.py”, line 38, in generic_parser
results[i] = parse_func(*args)
File “/Users/kevinoost/PycharmProjects/ARIMA/main.py”, line 6, in parser
return datetime.strptime(‘190’+x, ‘%Y-%m’)
File “/Users/kevinoost/anaconda/lib/python3.5/_strptime.py”, line 510, in _strptime_datetime
tt, fraction = _strptime(data_string, format)
File “/Users/kevinoost/anaconda/lib/python3.5/_strptime.py”, line 343, in _strptime
(data_string, format))
ValueError: time data ‘190Sales of shampoo over a three year period’ does not match format ‘%Y-%m’
Hi Kevin,
the last line of the data set, at least in the current version that you can download, is the text line “Sales of shampoo over a three year period”. The parser barfs on this because it is not in the specified format for the data lines. Try using the “nrows” parameter in read_csv.
series = read_csv(‘~/Downloads/shampoo-sales.csv’, header=0, nrows=36, parse_dates=[0], index_col=0, squeeze=True, date_parser=parser)
Let say I have a time series data with many attribute. For example a row will have (speed, fuel, tire_pressure), how could we made a model out of this ? the value of each column may affect each other, so we cannot do forecasting on solely 1 column. I google a lot but all the example I’ve found so far only work on time series of 1 attribute.
Update: the statsmodels.tsa.arima_model.ARIMA() function documentation says it takes the optional parameter exog, which is described in the documentation as ‘an optional array of exogenous variables’. This sounds like multivariate analysis to me, would you agree?
I am trying to predict number of cases of a mosquito-borne disease, over time, given weather data. So I believe the ARIMA model should work for this, correct?
Hi, would you have a example for the seasonal ARIMA post? I have installed latest statsmodels module, but there is an error of import the SARIMAX. Do help if you manage to figure it out. Thanks.
– Just to be sure. model_fit.forecast() is single step ahead forecasts and model_fit.predict() is for multiple step ahead forecasts?
– I am working with a series that seems at least quite similar to the shampoo series (by inspection). When I use predict on the training data, I get this zig-zag pattern in the prediction as well. But for the test data, the prediction is much smoother and seems to saturate at some level. Would you expect this? If not, what could be wrong?
Concerning the second question. Yes, you are right the prediction is not very accurate. But moreover, the predicted time series has a totally different frequency content. As I said, it is smooth and not zig-zaggy as the original data. Is this normal or am I doing something wrong. I also tried the multiple step prediction (model_fit.predict()) on the training data and then the forecast seem to have more or less the same frequency content (more zig-zaggy) as the data I am trying to predict.
In the case of predicting on the training dataset, the model has access to real observations. For example, if you predict the next 5 obs somewhere in the training dataset, it will use obs(t+4) to predict t+5 rather than prediction(t+4).
In the case of predicting beyond the end of the model data, it does not have obs to make predictions (unless you provide them), it only has access to the predictions it made for prior time steps. The result is the errors compound and things go off the rails fast (flat forecast).
Continuing on this note, how far ahead can you forecast using something like ARIMA or AR or GARCH in Python? I’m guessing most of these utilize some sort of Kalman filter forecasting mechanism?
To give you a sense of my data, given between 60k and 80k data points, how far ahead in terms of number of predictions can we make reliably? Similar to Sebastian, I have pretty jagged predictions in-sample, but essentially as soon as the valid/test area begins, I have no semblance of that behavior and instead just get a pretty flat curve. Let me know what you think. Thanks!
The skill of AR+GARH (or either) really depends on the choice of model parameters and on the specifics of the problem.
Perhaps you can try grid searching different parameters?
Perhaps you can review ACF/PACF plots for your data that may suggest better parameters?
Perhaps you can try non-linear methods?
Perhaps your problem is truly challenging/not predictable?
In step 3, when it says “Prediction: 46.755211”, is that meaning after it fit the model on the dataset, it uses the model to predict what would happen next from the dataset, right?
thank you very much for the post, very good written! I have a question: so I used your approach to build the model, but when I try to forecast the data that are out of sample, I commented out the obs = test[t] and change history.append(obs) to history.append(yhat), and I got a flat prediction… so what could be the reason? and how do you actually do the out-of-sample predictions based on the model fitted on train dataset? Thank you very much!
Each loop in the rolling forecast shows you how to make a one-step out of sample forecast.
Train your ARIMA on all available data and call forecast().
If you want to perform a multi-step forecast, indeed, you will need to treat prior forecasts as “observations” and use them for subsequent forecasts. You can do this automatically using the predict() function. Depending on the problem, this approach is often not skillful (e.g. a flat forecast).
Hello Jason, thanks for this amazing post.
I was wondering how does the “size” work here. For example lets say i want to forecast only 30 days ahead. I keep getting problems with the degrees of freedom.
Could you please explain this to me.
Thank you for explaining the ARIMA model in such clear detail.
It helped me to make my own model to get numerical forrcasts and store it in a database.
So nice that we live in an era where knowledge is de-mystified .
Hi Jason,
Lucky i found this at the begining of my project.. Its a great start point and enriching.
Keep it coming :).
This can also be used for non linear time series as well?
Hi Jason,
Great writeup, had a query, when u have a seasonal data and do seasonal differencing. i.e for exy(t)=y(t)-y(t-12) for yearly data. What will be the value of d in ARIMA(p,d,q).
ARIMA will not do seasonal differencing (there is a version that will called SARIMA). The d value on ARIMA will be unrelated to the seasonal differencing and will assume the input data is already seasonally adjusted.
Thanks for the great post! It was very helpful. I’m currently trying to forecast with the ARIMA model using order (4, 1, 5) and I’m getting an error message “The computed initial MA coefficients are not invertible. You should induce invertibility, choose a different model order, or you can pass your own start_params.” The model works when fitting, but seems to error out when I move to model_fit = model.fit(disp=0). The forecast works well when using your parameters of (0, 1, 5) and I used ACF and PACF plots to find my initial p and q parameters. Any ideas on the cause/fix for the error? Any tips would be much appreciated.
Sorry, it is difficult for (3,1,3) as well.
It worked for prediction for the first step of the test data, but gave out the error on the second prediction step.
Good afternoon!
Is there an analog to the function auto.arima in the package for python from the package of the language R.
For automatic selection of ARIMA parameters?
Thank you!
Hi. Great one. Suppose I have multiple airlines data number of passengers for two years recorded on daily basis. Now I want to predict for each airline number of possible passangers on next few months. How can I fit these time series models. Separate model for each airline or one single model?
Hi Jason, if in my dataset, my first column is date (YYYYMMDD) and second column is time (hhmmss) and third column is value at given date and time. So could I use ARIMA model for forecasting such type of time series ?
Hi Jason,
I have a general question about ARIMA model in the case of multiple Time Series:
suppose you have not only one time series but many (i.e. the power generated per hour at 1000 different wind farms). So you have a dataset of 1000 time series of N points each and you want to predict the next N+M points for each of the time series.
Analyzing each time series separately with the ARIMA could be a waste. Maybe there are similarities in the time evolution of these 1000 different patterns which could help my predictions. What approach would you suggest in this case?
Hi Jason and thank you for this post, its really helpful!
I have one question regarding ARIMA computation time.
I’m working on a dataset of 10K samples, and I’ve tried rolling and “non rolling” (where coefficients are only estimated once or at least not every new sample) forecasting with ARIMA :
– rolling forecast produces good results but takes a big amount of time (I’m working with an old computer, around 3/6h depending on the ARMA model);
– “non rolling” doesn’t forecast well at all.
Re-estimating the coefficients for each new sample is the only possibility for proper ARIMA forecasting?
Dear Respected Sir, I have tried to use ARIMA model for my dataset, some samples of my dataset are following,
YYYYMMDD hhmmss Duration
20100916 130748 18
20100916 131131 99
20100916 131324 214
20100916 131735 72
20100916 135342 37
20100916 144059 250
20100916 150148 87
20100916 150339 0
20100916 150401 180
20100916 154652 248
20100916 183403 0
20100916 210148 0
20100917 71222 179
20100917 73320 0
20100917 81718 25
20100917 93715 15
But when I used ARIMA model for such type of dataset, the prediction was very bad and test MSE was very high as well, My dataset has irregular pattern and autocorrelation is also very low. so could ARIMA model be used for such type of dataset ? or I have to do some modification in my dataset for using ARIMA model?
Looking forward.
Thanks
Love this. The code is very straightforward and the explanations are nice.
I would like to see a HMM model on here. I have been struggling with a few different packages (pomegranate and hmmlearn) for some time now. would like to see what you can do with it! (particularly a stock market example)
Good evening,
In what I am doing, I have a training set and a test set. In the training set, I am fitting an ARIMA model, let’s say ARIMA(0,1,1) to the training set. What I want to do is use this model and apply it to the test set to get the residuals.
So far I have:
model = ARIMA(data,order = (0,1,1))
model_fit = model.fit(disp=0)
res = model_fit.resid
This gives me the residuals for the training set. So I want to apply the ARIMA model in ‘model’ to the test data.
Is there a function to do this?
Thank you
You could use your fit model to make a prediction for the test dataset then compare the predictions vs the real values to calculate the residual errors.
In your example, you append the real data set to the history list- aren’t you supposed to append the prediction?
history.append(obs), where obs is test[t].
in a real example, you don’t have access to the real “future” data. if you were to continue your example with dates beyond the data given in the csv, the results are poor. Can you elaborate?
interestingly, under your Rolling Forecast ARIMA Model explanation, matplotlib was above statsmodels.
from matplotlib import pyplot
from statsmodels.tsa.arima_model import ARIMA
i am using jupyter notebook from WinPython-64bit-3.5.3.1Qt5 to run your examples. i keep getting ImportError: No module named ‘statsmodels’ if i declare import this way in ARIMA with Python explanation
from matplotlib import pyplot
from pandas import DataFrame
from statsmodels.tsa.arima_model import ARIMA
i think it could be i need to restart the virtual environment to let the environment recognize it, today i re-test the following declarations it is ok.
from matplotlib import pyplot
from pandas import DataFrame
from statsmodels.tsa.arima_model import ARIMA
Great explanation
can anyone help me to write code in R about forecasting such as (50,52,50,55,57) i need to forecasting the next 3 hour, kindly help me to write code using R with ARIMA and SARIMA Model
thanks in advance
Can the ACF be shown using bars so you can look to see where it drops off when estimating order of MA model? Or have you done a tutorial on interpreting ACF/PACF plots please elsewhere?
I am getting the error when trying to run the code:
from matplotlib import pyplot
from pandas import DataFrame
from pandas.core import datetools
from pandas import read_csv
from statsmodels.tsa.arima_model import ARIMA
series = read_csv(‘sales-of-shampoo-over-a-three-year.csv’, header=0, parse_dates=[0], index_col=0)
# fit model
model = ARIMA(series, order=(0, 0, 0))
model_fit = model.fit(disp=0)
print(model_fit.summary())
# plot residual errors
residuals = DataFrame(model_fit.resid)
residuals.plot()
pyplot.show()
residuals.plot(kind=’kde’)
pyplot.show()
print(residuals.describe())
Error Mesg on Console :
C:\Python36\python.exe C:/Users/aamrit/Desktop/untitled1/am.py
C:/Users/aamrit/Desktop/untitled1/am.py:3: FutureWarning: The pandas.core.datetools module is deprecated and will be removed in a future version. Please use the pandas.tseries module instead.
from pandas.core import datetools
Traceback (most recent call last):
File “C:\Python36\lib\site-packages\pandas\core\tools\datetimes.py”, line 444, in _convert_listlike
values, tz = tslib.datetime_to_datetime64(arg)
File “pandas\_libs\tslib.pyx”, line 1810, in pandas._libs.tslib.datetime_to_datetime64 (pandas\_libs\tslib.c:33275)
TypeError: Unrecognized value type:
During handling of the above exception, another exception occurred:
Traceback (most recent call last):
File “C:\Python36\lib\site-packages\statsmodels\tsa\base\tsa_model.py”, line 56, in _init_dates
dates = to_datetime(dates)
File “C:\Python36\lib\site-packages\pandas\core\tools\datetimes.py”, line 514, in to_datetime
result = _convert_listlike(arg, box, format, name=arg.name)
File “C:\Python36\lib\site-packages\pandas\core\tools\datetimes.py”, line 447, in _convert_listlike
raise e
File “C:\Python36\lib\site-packages\pandas\core\tools\datetimes.py”, line 435, in _convert_listlike
require_iso8601=require_iso8601
File “pandas\_libs\tslib.pyx”, line 2355, in pandas._libs.tslib.array_to_datetime (pandas\_libs\tslib.c:46617)
File “pandas\_libs\tslib.pyx”, line 2538, in pandas._libs.tslib.array_to_datetime (pandas\_libs\tslib.c:45511)
File “pandas\_libs\tslib.pyx”, line 2506, in pandas._libs.tslib.array_to_datetime (pandas\_libs\tslib.c:44978)
File “pandas\_libs\tslib.pyx”, line 2500, in pandas._libs.tslib.array_to_datetime (pandas\_libs\tslib.c:44859)
File “pandas\_libs\tslib.pyx”, line 1517, in pandas._libs.tslib.convert_to_tsobject (pandas\_libs\tslib.c:28598)
File “pandas\_libs\tslib.pyx”, line 1774, in pandas._libs.tslib._check_dts_bounds (pandas\_libs\tslib.c:32752)
pandas._libs.tslib.OutOfBoundsDatetime: Out of bounds nanosecond timestamp: 1-01-01 00:00:00
During handling of the above exception, another exception occurred:
Traceback (most recent call last):
File “C:/Users/aamrit/Desktop/untitled1/am.py”, line 9, in
model = ARIMA(series, order=(0, 0, 0))
File “C:\Python36\lib\site-packages\statsmodels\tsa\arima_model.py”, line 997, in __new__
return ARMA(endog, (p, q), exog, dates, freq, missing)
File “C:\Python36\lib\site-packages\statsmodels\tsa\arima_model.py”, line 452, in __init__
super(ARMA, self).__init__(endog, exog, dates, freq, missing=missing)
File “C:\Python36\lib\site-packages\statsmodels\tsa\base\tsa_model.py”, line 44, in __init__
self._init_dates(dates, freq)
File “C:\Python36\lib\site-packages\statsmodels\tsa\base\tsa_model.py”, line 58, in _init_dates
raise ValueError(“Given a pandas object and the index does ”
ValueError: Given a pandas object and the index does not contain dates
Traceback (most recent call last):
File “C:/Users/aamrit/Desktop/untitled1/am.py”, line 10, in
model_fit = model.fit(disp=0)
File “C:\Python36\lib\site-packages\statsmodels\tsa\arima_model.py”, line 1151, in fit
callback, start_ar_lags, **kwargs)
File “C:\Python36\lib\site-packages\statsmodels\tsa\arima_model.py”, line 956, in fit
start_ar_lags)
File “C:\Python36\lib\site-packages\statsmodels\tsa\arima_model.py”, line 578, in _fit_start_params
start_params = self._fit_start_params_hr(order, start_ar_lags)
File “C:\Python36\lib\site-packages\statsmodels\tsa\arima_model.py”, line 508, in _fit_start_params_hr
endog -= np.dot(exog, ols_params).squeeze()
TypeError: Cannot cast ufunc subtract output from dtype(‘float64’) to dtype(‘int64’) with casting rule ‘same_kind’
Code :
import pandas as pd
import numpy as np
import matplotlib.pylab as plt
from datetime import datetime
from statsmodels.tsa.arima_model import ARIMA
data = pd.read_csv(‘AirPassengers.csv’, header=0, parse_dates=[0], index_col=0)
model = ARIMA(data, order=(1,1,0),exog=None, dates=None, freq=None, missing=’none’)
model_fit = model.fit(disp=0)
print(model_fit.summary())
@kyci is correct as you can check in https://github.com/statsmodels/statsmodels/issues/3504.
I was following this tutorial for my dataset, and what fixed my problem was just converting to float, like this:
X = series.values
X = X.astype(‘float32’)
Traceback (most recent call last):
File “C:/untitled1/prediction_new.py”, line 31, in
output = model_fit.predict(start=’2017-01-08′,end=’2017-20-08′)
File “C:\Python36\lib\site-packages\statsmodels\base\wrapper.py”, line 95, in wrapper
obj = data.wrap_output(func(results, *args, **kwargs), how)
File “C:\Python36\lib\site-packages\statsmodels\tsa\arima_model.py”, line 1492, in predict
return self.model.predict(self.params, start, end, exog, dynamic)
File “C:\Python36\lib\site-packages\statsmodels\tsa\arima_model.py”, line 733, in predict
start = self._get_predict_start(start, dynamic)
File “C:\Python36\lib\site-packages\statsmodels\tsa\arima_model.py”, line 668, in _get_predict_start
method)
File “C:\Python36\lib\site-packages\statsmodels\tsa\arima_model.py”, line 375, in _validate
start = _index_date(start, dates)
File “C:\Python36\lib\site-packages\statsmodels\tsa\base\datetools.py”, line 52, in _index_date
date = dates.get_loc(date)
AttributeError: ‘NoneType’ object has no attribute ‘get_loc’
ERROR is
runfile(‘C:/Users/kashi/Desktop/prog/Date_time.py’, wdir=’C:/Users/kashi/Desktop/prog’)
Traceback (most recent call last):
File “”, line 1, in
runfile(‘C:/Users/kashi/Desktop/prog/Date_time.py’, wdir=’C:/Users/kashi/Desktop/prog’)
File “C:\Users\kashi\Anaconda3\lib\site-packages\spyder\utils\site\sitecustomize.py”, line 866, in runfile
execfile(filename, namespace)
File “C:\Users\kashi\Anaconda3\lib\site-packages\spyder\utils\site\sitecustomize.py”, line 102, in execfile
exec(compile(f.read(), filename, ‘exec’), namespace)
File “C:/Users/kashi/Desktop/prog/Date_time.py”, line 10, in
series = read_csv(‘E:/data/csv/shampoo-sales.csv’, header=0, parse_dates=[0], index_col=0, squeeze=True, date_parser=parser)
File “C:\Users\kashi\Anaconda3\lib\site-packages\pandas\io\parsers.py”, line 562, in parser_f
return _read(filepath_or_buffer, kwds)
File “C:\Users\kashi\Anaconda3\lib\site-packages\pandas\io\parsers.py”, line 325, in _read
return parser.read()
File “C:\Users\kashi\Anaconda3\lib\site-packages\pandas\io\parsers.py”, line 815, in read
ret = self._engine.read(nrows)
File “C:\Users\kashi\Anaconda3\lib\site-packages\pandas\io\parsers.py”, line 1387, in read
index, names = self._make_index(data, alldata, names)
File “C:\Users\kashi\Anaconda3\lib\site-packages\pandas\io\parsers.py”, line 1030, in _make_index
index = self._agg_index(index)
File “C:\Users\kashi\Anaconda3\lib\site-packages\pandas\io\parsers.py”, line 1111, in _agg_index
arr = self._date_conv(arr)
File “C:\Users\kashi\Anaconda3\lib\site-packages\pandas\io\parsers.py”, line 2288, in converter
return generic_parser(date_parser, *date_cols)
File “C:\Users\kashi\Anaconda3\lib\site-packages\pandas\io\date_converters.py”, line 38, in generic_parser
results[i] = parse_func(*args)
File “C:/Users/kashi/Desktop/prog/Date_time.py”, line 8, in parser
return datetime.strptime(‘190’+x, ‘%Y-%m’)
File “C:\Users\kashi\Anaconda3\lib\_strptime.py”, line 510, in _strptime_datetime
tt, fraction = _strptime(data_string, format)
File “C:\Users\kashi\Anaconda3\lib\_strptime.py”, line 343, in _strptime
(data_string, format))
ValueError: time data ‘1901-Jan’ does not match format ‘%Y-%m’
I have already removed the footer note from the dataset and I also open dataset in text editor. But I couldn’t remove this error. But when I comment ”date_parser=parser” my code runs but doesn’t show years,
How to resolve it?
Thanks
File “/shampoo.py”, line 6, in parser
return datetime.strptime(‘190’+x, ‘%Y-%m’)
TypeError: ufunc ‘add’ did not contain a loop with signature matching types dtype(‘<U32') dtype('<U32') dtype('<U32')
I've tried '%Y-%b' but that only gives me the "does not match format" error.
Hey,
I’ve two years monthly data of different products and their sales at different stores. How can I perform Time series forecasting on each product at each location?
You mentioned that since the residuals doesn’t have mean = 0, there is a bias. I have same situation. But the spread of the residuals is in the order of 10^5. So i thought it is okay to have non-zero mean. Your thoughts please?
Firstly, I would like to thanks about your sharing
Secondly, I have a small question about ARIMA with Python. I have about 700 variables need to be forecasted with ARIMA model. How Python supports this issuse Jason
For example, I have data of total orders in a country, and it will be contributte to each districts
So I need to forecast for each districts (about 700 districts)
The result of model_fit.forecast() is like (array([ 242.03176448]), array([ 91.37721802]), array([[ 62.93570815, 421.12782081]])). The first number is yhat, can you explain what the other number means in the result? thank you!
Great blogpost Jason!
Had a follow up question on the same topic.
Is it possible to do the forecast with the ARIMA model at a higher frequency than the training dataset?
For instance, let’s say the training dataset is sampled at 15min interval and after building the model, can I forecast at 1second level intervals?
If not directly as is, any ideas on what approaches can be taken? One approach I am entertaining is creating a Kernel Density Estimator and sampling it to create higher frequency samples on top of the forecasts.
Thanks, much appreciate your help!
Hmm, it might not be the best tool. You might need something like a neural net so that you can design a one-to-many mapping function for data points over time.
Your tutorial was really helpful to understand the concept of solving time series forecasting problem. But I have small doubt regarding the steps you followed at the very end. I’m pasting your code down below-
X = series.values
size = int(len(X) * 0.66)
train, test = X[0:size], X[size:len(X)]
history = [x for x in train]
predictions = list()
for t in range(len(test)):
model = ARIMA(history, order=(5,1,0))
model_fit = model.fit(disp=0)
output = model_fit.forecast()
yhat = output[0]
predictions.append(yhat)
obs = test[t]
history.append(obs)
print(‘predicted=%f, expected=%f’ % (yhat, obs))
error = mean_squared_error(test, predictions)
Note:1) here in the above for each iteration you’re adding the elements from the “test” and the forecasted value because in real forecasting we don’t have future data to include in test, isn’t it? Or is it that your’re trying to explain something and I’m not getting it.
2) Second doubt, aren’t you suppose to perform “reverse difference” for that you have used first order differencing in the model?
Kindly, please clear my doubt
Note: I have also went through one of your other tutorial where you have forecasted the average daily temperature in Australia.
here the steps you followed were convincing, also you have performed “inverse difference” step to scale the prediction to original scale.
I have followed the steps from the one above but I m unable to forecast correctly.
Hi Jason,
Recently I am working on time series prediction, but my research is a little bit complicated for me to understand how to fix a time series models to predict future values of multi targets.
Recently I read your post in multi-step and multivariate time series prediction with LSTM. But my problem have a series input values for every time (for each second we have recorded more than 500 samples). We have 22 inputs and 3 targets. All the data has been collected during 600 seconds and then predict 3 targets for 600 next seconds. Please help me how can solve this problem?
It is noticed we have trend and seasonality pulses for targets during the time.
Hey just a quick check with you regarding the prediction part. I need to do some forecast of future profit based on the data from past profit. Let’s say I got the data for the past 3 years, and then I wanted to perform a forecast on the next 12 months in next year. Does the model above applicable in this case?
Hey Jason thanks so much for the clarification! But just to clarify, when I run the example above, my inputs are the past records for the past 3 years grouped by month. Then, how the code actually plot out the forecasted graph is basically takes in those input and plot, am I right? So, can I assumed that the graph that plotted out is meant for the prediction of next year?
Hey Jason, thanks so much for the replies! But just to check with you, which line of the code should I modify so that it will only predict for the next 12 months instead of 13?
Also, just to be sure, if I were to predict for the profit for next year, the value that I should take should be the predicted rather than expected, am I right?
Hey Jason, thanks so much but I am still confused as I am new to data analytic. The model above aims to make a prediction on what you already have or trying to forecast on what you do not have?
Also, may I check with you on how it works? Because I downloaded the sample dataset and the dataset contains the values of past 3 years grouped by months. So, can I assume the prediction takes all the values from past years into account in order to calculate for the prediction value? Or it simply takes the most recent one and calculate for the prediction?
Hey Jason, I am so sorry for the spams. But just a quick check with you again, let’s say I have some zero value for the profit, will it break the forecast function? Or the forecast function must take in all non-zero value. Because sometimes I am getting “numpy.linalg.linalg.LinAlgError: SVD did not converge” error message and I not sure if it is the zero values that is causing the problem. 🙂
Hi Jason, thanks so much for the share! The tutorial was good! However, when I am using my own data set, I am getting the same error message as one of the guy above. The error message is ‘numpy.linalg.linalg.LinAlgError: SVD did not converge’.
I tried to crack my head out trying to observe the data sets that caused the error message but I could not figure out anything. I tried with 0 value and very very very drastic drop or increase in the data, some seems okay but at some point, some data set will just fail and return the error message.
May I know what kind of data or condition will trigger the error above so I can take extra precaution when preparing the data?
I tried with multiple set of data without a single zero. I realized a problem but I not sure if my observation is correct as I am still trying to figure out how the code above works, for that part I might need your enlightenment.
Let’s say the data is 1000, 100, 10000 respectively to first, second and third year. This kind of data will throw out the error message above. So can I assume that, as long as there is a big drastic drop/increase in the data set, in this case from 100 to 10000, this kind of condition will execute with error?
Thank you for the tutorial, it’s great! I have a question about stationarity and differencing. If time series is non stationary but is made stationary with simple differencing, are you required to have d=1 in your selected model? Can I choose a Model with no differencing for this data if it gives me a better root mean square error and there is no evidence of autocorrelation?
@Jason, This article has helped me a lot for the training set predictions which i had managed to do earlier too, but could you help me with the future forecasting, let say your date data is till 10th November, 2017 and i want to predict the values for the next one week or next 3 days..
For future predictions, let say i have data till 10th November, and based on your analysis as shown above, can you help me with the future predictions for a week or so, need an idea of how to predict future data..
– We need to ensure that the residuals of our model are uncorrelated and normally distributed with zero mean.
What if the residuals are not normally distributed?
It would be very grateful if you could explain how to approach in such scenario.
@Jason, What if we don’t want Rolling forecast, which means, my forecast should only be based on the training data, and it should predict the test data..
I am using the below code:
X = ts.values
size = int(len(X) * 0.75)
train, test = X[0:size], X[size:len(X)]
model = ARIMA(train, order=(4, 1, 2))
results_AR = model.fit(disp=0)
preds=results_AR.predict(size+1,size+16)
pyplot.plot(test[0:17])
pyplot.plot(preds, color=’red’)
pyplot.show()
This prediction is giving me really bad results, need urgent help on this.
Hi Jason, I have two questions.
1. Let’s say I want to estimate an AR model like this: x(t)=a*x(t-2) + e. If I use ARIMA(2,0,0), it will add the term x(t-1) as well, which I don’t want. In SAS I would use p=(2) on the estimate statement of proc arima rather than p=2.
2. How do I incorporate covariates? For example, a simple model like this: x(t)=a*x(t-2) + b*f(t) + e, where f(t) e.g. is 1 if it’s the month of January and 0 otherwise.
Thanks.
I am getting the following error when loading the series dataframe in python
“ValueError: time data ‘190Sales of shampoo over a three year period’ does not match format ‘%Y-%m'”
Ive just copy pasted the code from this website but its not working. Any suggestions? Im using Sypder
Hello,
Is it possible to predict hourly temperature for upcoming 5 years based on hourly temperature data of last 5 years ?
I am trying this out with ARIMA model, its giving me vrey bad output ( attenuating curve ).
if the time series corresponds to brownian motion time series generated with different Hurst value (let’s say H1 = 0.6 and H2 = 0.7), is this model a good fit to classify if it is H1 or H2?
I have followed all of your posts related to Time Series to do my first data science project. I have done the parameter optimization also. The same code is working in my laptop but when i ran in Kaggle it shows “The computed initial AR coefficients are not stationary
You should induce stationarity, choose a different model order, or you can
pass your own start_params”. The python version is same in my environment and in Kaggle. Is this common?
Also, just to double confirm with you on my understanding, basically what the algorithm does is, take in all input in csv and fit into model, perform a forecast, append the forecast value into the model, then go thru the for loop again to recreate a new ARIMA model, forecast then append new forecast value, then go thru the for loop again?
In addition, the next row prediction is always depends on the past prediction values?
Thanks Jason for making it simple. I run the program but getting error
1st error :
TypeError: Cannot cast ufunc subtract output from dtype(‘float64’) to dtype(‘int64’) with casting rule ‘same_kind’
After changing code , i got 2nd error
model = ARIMA(series.astype(float), order=(5,1,0))
I m getting following error
LinAlgError: SVD did not converge
Looks like the data might have some issues. Perhaps calculate some summary stats, visualizations and look at the raw data to see if there is anything obvious.
Thanks Jason for the quick response. Now i tried for Sampoo dataset, getting following error :
ValueError: time data ‘1901-Jan’ does not match format ‘%d-%m’
When we use a recursive model for ARIMA, let say like saw in one of your examples:
1
2
3
4
5
6
7
8
9
10
11
12
fortinrange(len(test)):
try:
model=ARIMA(history,order=(4,0,2))
model_fit=model.fit(disp=0)
output=model_fit.forecast()
yhat=output[0]
predictions.append(yhat)
obs=test[t]
history.append(obs)
except(ValueError,LinAlgError):
pass
print('predicted=%f, expected=%f'%(yhat,obs))
Why my final test vs predicted graph is coming as if, the predictions are following the test values, it’s like if test is following a pattern, predictions is following similar pattern, hence ultimately our ARIMA predictions isn’t working properly, i hope you got my point.
For example: if test[0] keeps increasing till test[5] and decreases, then prediction[1] keeps increasing till predictions[5] and decreases..
Hello! Thank you for this great tutorial. It’d be a great help if you guide me through one of my problems.
I want to implement a machine learning model to predict(forecast) points scored by each player in the upcoming game week.
Say I have values for a player (Lukaku) for 28 game weeks and I train my model based on some selected features for those 28 weeks. How do I predict the outcome of the 29th week?
I am trying to predict total points to be scored by every player for the coming game week.
So basically what should be the input to my model for 29th game week? Since the game assigns points as per live football games happening during the week, I wont have any input data for 29th week.
I have a question on your Rolling Forecast ARIMA model.
When your are appending obs (test(t)) on each step to history, aren’t we getting data leakage?
The test set is supposed to be unseen data, right? Or are you using the test set as a validation set?
oh I see, i misunderstood this assumption, sorry. But how can I predict multiple steps? I used the predict() method from ARIMA model but the results were weird.
Very nice introduction! Thank you very much for always bringing us excellent ML knowledge.
Can you further explain why you chose (p,d,q) = (5,1,0)? Or you did gird search (which you show in other blogs) using training/test sets to find minimum msg appears at (5,1,0)? Did you know any good reference for diagnostic plots for the hyper-parameters grid searching?
Meanwhile, I am interested in both time-series book and LSTM book. If I purchased both, any further deal?
Thank you for your answer. I have purchased time series book.
I still have few more questions on ARIMA model:
(1) The shampoo sale data obviously shows non-stationary; strictly speaking, we should transform data until it becomes stationary data by taking logarithm and differencing (Box-Cox transformation), and then apply to ARIMA model. Is it correct?
(2) Does the time series data with first-order differencing on ARIMA (p,0,q) give the similar results to the time series data without differencing on ARIMA(p,1,q)? i.e. d = 1 in ARIMA(p,d,q)
equivalently process data with first-order difference?
(3) In this example, we chose ARIMA (5,1,0) and p=5 came from the autocorrelation plot. However, what I read from the book https://www.otexts.org/fpp/8/5 said to judge value of p, we should check PACF plot, instead ACF. Are there any things I missed or misunderstood?
I am also trying to figure out what the other elements of output represent but Jason the link you provided does not work. Could you provide a fresh link?
Thank you for your efforts … i have question
i’m using the following code as mentioned above
def parser(x):
return datetime.strptime(‘190’ +x, ‘%Y-%m’)
but the error appears :
ValueError: time data ‘1902-Jan’ does not match format ‘%Y-%m’
Hey Jason,
Best article I have ever seen. Currently I am working on data driven time series forecasting with PYTHON by ARIMA model. I have data of appliance energy which depends on 26 variables over period of 4 months. My question is how can I use 26 variables to forecast the future value?
Hey Jason, I am new to data analytics. From the chart, may I know how you determined it is stationary or non-stationary as well as how do you see whether it has a lagged value?
Hello! I think you may have made a mistake in the following paragraph.
“If we used 100 observations in the training dataset to fit the model, then the index of the next time step for making a prediction would be specified to the prediction function as start=101, end=101. This would return an array with one element containing the prediction.”
Since python is zero-indexed, the index of the next time step for making a prediction should be 100, I think.
Hi Jason,
great tutorial, as always! Thank you very much for providing your excellent knowledge to the vast community! You really helped me to get a better understanding of this ARIMA type of models.
Do you plan to make a tutorial on nonlinear time-series models such as SETAR? Would be great, because I could not really find anything in this region.
Hi Jason
I tried the code with my data. ACF, PACF plots aren’t showing me any significant correlations. Is there anything by which I can still try the forecast? What should be one’s steps on encounter of such data?
Hello Jason, I have been following your articles and it has been very helpful.
I am running the same code above and get following error:
ValueError Traceback (most recent call last)
in ()
7 pred=list()
8 for i in range(len(test)):
—-> 9 model=ARIMA(history,order=(5,1,0))
10 model_fit=model.fit(disp=0)
11 output=model_fit.forecast()
~\AppData\Local\Continuum\anaconda3\lib\site-packages\statsmodels\tsa\arima_model.py in __new__(cls, endog, order, exog, dates, freq, missing)
998 else:
999 mod = super(ARIMA, cls).__new__(cls)
-> 1000 mod.__init__(endog, order, exog, dates, freq, missing)
1001 return mod
1002
~\AppData\Local\Continuum\anaconda3\lib\site-packages\statsmodels\tsa\arima_model.py in __init__(self, endog, order, exog, dates, freq, missing)
1013 # in the predict method
1014 raise ValueError(“d > 2 is not supported”)
-> 1015 super(ARIMA, self).__init__(endog, (p, q), exog, dates, freq, missing)
1016 self.k_diff = d
1017 self._first_unintegrate = unintegrate_levels(self.endog[:d], d)
~\AppData\Local\Continuum\anaconda3\lib\site-packages\statsmodels\tsa\arima_model.py in __init__(self, endog, order, exog, dates, freq, missing)
452 super(ARMA, self).__init__(endog, exog, dates, freq, missing=missing)
453 exog = self.data.exog # get it after it’s gone through processing
–> 454 _check_estimable(len(self.endog), sum(order))
455 self.k_ar = k_ar = order[0]
456 self.k_ma = k_ma = order[1]
~\AppData\Local\Continuum\anaconda3\lib\site-packages\statsmodels\tsa\arima_model.py in _check_estimable(nobs, n_params)
438 def _check_estimable(nobs, n_params):
439 if nobs 440 raise ValueError(“Insufficient degrees of freedom to estimate”)
441
442
ValueError: Insufficient degrees of freedom to estimate
the code used
from sklearn.metrics import mean_squared_error
size = int(len(df) * 0.66)
train,test=df[0:size],df[size:len(df)]
print(train.shape)
print(test.shape)
history=[x for x in train]
pred=list()
for i in range(len(test)):
model=ARIMA(history,order=(5,1,0))
model_fit=model.fit(disp=0)
output=model_fit.forecast()
yhat=output[0]
pred.append(yhat)
obs=test[i]
history.append(obs)
print(‘predicted = %f,expected = %f’,(yhat,obs))
error=mean_squared_error(test,pred)
print(‘Test MSE: %.3f’ % error)
On;ly change I have made in code is date index. I have done something like this for dates
dt=pd.date_range(“2015-01-01”, “2017-12-1″, freq=”MS”)
Can you explain what is wrong?
also,
I was under impression that you use auto_corr function to determine Q parameter in ARIMA model. then in your code when you call ARIMA why have you used (5,1,0) assuming it is (p,d,q)? i thought it was suppose to be (0,1,5)?
Thanks for the helpful article.
My question is :
“A rolling forecast is required given the dependence on observations in prior time steps for differencing and the AR model.”
can you please elaborate?
How do we decide when to use Rolling forecast and when not to use rolling forecast?
what are the factors do you consider?
Great article! But I have a question. I have a daily time series, and I am following the steps from the time series forecasting book. How do I obtain the acf and pacf visually (for the Manually Congured ARIMA)? because I will have more than 1000 lag values (as my dataset is for many years), and after this I will need to search for the hyperparameters. I will really appreciate the help
However. I have some problem. Whenever I adopt your code for forcasting when no validation data is available, for t in range(93):
model = ARIMA(history, order=(5,1,0))
model_fit = model.fit(disp=0)
output = model_fit.forecast()
yhat = output[0]
predictions.append(yhat)
history.append(yhat)
print('predicted=%f' % (yhat))
my series converge to a constant number after a certain number of iterations, which is not right. What is the mistake?
Your articles are great to read as they give just the right amount of background and detail and are practical oriented. Please continue writing.
I have a question though, being not from the statistical background, i am having difficulty in interpreting the output that is displayed after the summary of the fit model under the heading of “ARIMA model results”. This summarizes the coefficient values used as well as the skill of the fit on the on the in-sample observations.
Can you please provide some explanation on their attributes and how the information assists us in the interpretation of the results
I am training on a dataset where I have to predict Traffic and Revenue during a campaign (weeks 53,54,55) driven by this marketing campaigns. I think I can only use data preceding the campaigns (weeks 1 to 52) even though I have the numbers for campaign and post campaign.
It seems like a statistical problem and I don’t know whether ARIMA is suitable for this use case (very few data, only 52 values to predict the following one). Do you think I can give it a shot with ARIMA or do you think there are other models that could be more suitable for such a use case please?
Hi Jason, the constant updates are great and very helpful. I need a bit of help with my work. Im trying to forecast solid waste generation in using ANN. But I’m finding challenges with data and modeling my problem. If you could at least get me a headway that can help me produce something in 2weeks I will be grateful. I want to consider variables such as already generated solid waste, population, income levels, educational levels, etc. I hope to hear from you soon.
Just one question, my data set contains some sales value = 0, would that affect the performance of ARIMA model? if there will be issues, anyway I can deal with the zero values in my data set? Thanks in advance for your advice!
Traceback (most recent call last):
File “/Library/Frameworks/Python.framework/Versions/3.7/lib/python3.7/site-packages/pandas/io/parsers.py”, line 3021, in converter
date_parser(*date_cols), errors=’ignore’)
File “/Users/Brian/PycharmProjects/MachineLearningMasteryTimeSeries1/ARIMA.py”, line 9, in parser
return datetime.strptime(‘190’ + x, ‘%Y-%m’)
TypeError: strptime() argument 1 must be str, not numpy.ndarray
During handling of the above exception, another exception occurred:
The formating of csv seems different for everyone who downloads it, here’s the format that is used by Jason (just copy pasted this into a shampoo-sales.csv file and save)
I’m trying to divide time series dataset into several dataset and select the best one as preprocessing dataset.I would like to use RMSE to evaluate each subset.In other word to select the window size and frame size before I do the training . Please let me know if you have any article on rows selection not column selection
Just to clarify my previous question that i have 700 rows of date and price and I would like select the best 70(window size) rows for prediction and decide on the frame size , frame step and extent of prediction.
Please let me know if you have an article help on specifying frame size , frame step and extent of prediction as data pre-processing step using RMSE and SEP.
So I did the for-loop and manage to get different windows.
Now to calculate the RMSE do I need to do linear regiression prediction for each window in order to calculate the RMSE or is there any other way around?
I would expect that you would fit a model for different sized windows and compare the RMSE of the models. The models could be anything you wish, try a few diffrent approaches even.
I got the following as example for two window size 360 days and 180 days
For 360 days
Window start after 0 days with windwo size 360 and step 100 have RMSE 734.1743876097737
Window start after 100 days with windwo size 360 and step 100 have RMSE 369.94549420288877
Window start after 200 days with windwo size 360 and step 100 have RMSE 105.70778076287142
For 180 days
Window start after 0 days with windwo size 180 and step 90 have RMSE 653.9070358902835
Window start after 90 days with windwo size 180 and step 90 have RMSE 326.7832188924093
Window start after 180 days with windwo size 180 and step 90 have RMSE 135.01118940666115
Window start after 270 days with windwo size 180 and step 90 have RMSE 38.422587695965746
Window start after 360 days with windwo size 180 and step 90 have RMSE 60.73374764651785
Window start after 450 days with windwo size 180 and step 90 have RMSE 52.386817309349176
Hey Jason, what model i can use to equipment fault detection and prediction? So have some variables that correlate with others and i need to identification which are. See you soon.
There is something that I struggle to understand, it would awesome if you could give me a hand.
In ARIMA models, the optimization fits the MA and AR parameters. Which can be summed up as parameters of linear combination of previous terms for the AR and previous errors for the MA. A quick math formula could be :
When the fit method is used, it takes the train values of the signal to fit the parameters (a and b)
When the forecast method is used, it forecast the next value of the signal using the fitted model and the train values
When the predict method is used, it forecast the next values of the signal from start to stop.
Let’s say I fit a model on n steps in the train set. Now I want to make predictions. I can predict step n+1. Now I am days n+1 and I have the exact signal value. I would like to actualize the model to predict n+2.
In the rolling forecast part of your code, you fit again the model with the expanded train set (up to n+1). But in that case the model parameters are changed. It’s not the same model anymore.
Is it possible to train one model and then actualize the signal values (the x and e) without changing the parameters (a and b)?
It seems to me that it is important to keep one unique model and evaluate it against different time steps instead of training n different models for each new time steps we get.
I hope I was clear enough. I miss probably a key to understand the problem.
Hi Jason – Very helpful post here, thanks for sharing. I’m curious why parameter ‘p’ should be equal to the number of significant lags from the auto correlation plot? Just was wondering if you could give any more context to this part of the problem. Thanks.
Generally, we want to know how may lag observations have a measurable relationship with the next step so that the model can work on using them effectively.
I used your code to forecast daily temperature (it has a lag of 365). The forecast is always a day behind, i.e. learning history cannot accurately forecast next day’s temperature. I’ve played with the params with AIC.
Thanks for sharing! Very helpful post.
Recently I am writing the methodology of ARIMA, but I can not find any reference (for example, some ARIMA formulas contain constant but some don’t have ). So could you please give me some reference (or ARIMA formula information) of “statsmodels.tsa.arima_model import ARIMA” used in Python?
If one has a time series where the time steps are not uniform, what should be done while fitting a model such as ARIMA? I have price data for a commodity for about 4 years. The prices are available only for days that a purchase was made. This is often, but not always, every day. So sometimes purchases are made after 2, 3 or even more days and the prices are therefore available only for those days I need to forecast the price for the next week.
1. is it necessary that we need to have always uni variate data set to predict for time series using ARIMA? What if i have couple of features that i want to pass along with the date time?
2. is it also necessary that we have a non-stationary data to use time series for modelling? what if the data is already stationary? can i still do the modelling using time series?
Hello sir,
This is a great article. But sir I have couple of questions?
1. Assume that if we have three inputs and one output with time period. Then how do we predict the next future value according to the past values to next time period using ARIMA model? (if we need to predict value next time interval period is 120min)
as a example
You could treat the other inputs as exogenous variables and use ARIMAX, or you could use another method like a machine learning algorithm or neural network that supports multivariate inputs.
I was wondering if you are aware of any auto arima functions to fine tune p,d,q parameters. I am aware that R has an auto.arima function to fine tune those parameters but was wondering if you’re familiar with any Python library.
Have followed your post : “How to Grid Search ARIMA Model Hyperparameters with Python” to fine tune the p,q and d value. Have come across the below point in the post.
“The first is to ensure the input data are floating point values (as opposed to integers or strings), as this can cause the ARIMA procedure to fail.”
My initial data is in the below format. Month and #Sales
With this log value, applied the grid search approach to decide the best value of p,q and d.
Howver, I got Best ARIMA(0, 1, 0) MSE=0.023. Looks good ? is it acceptable? Wondering if p=0 and q=0 is acceptable. Please confirm.
Next, I have 37 Observations from Nov 2014 to 31-Dec-2017. I want to do future predictions for 2018, 2019 etc.How to do this?
Also, do you have any Youtube videos explaining each of the steps in grid approach, how to make future forecatsts available ? It would be great if you can share the Youtube link. 🙂
Once again thanks a lot for the article and your help!
Kindly confirm if the p,q value is 0 is an acceptable scenario.
Perhaps try standardizing or normalizing the data as well : I am not sure how to proceed with this?
It would be great if you can share related article if you have any. 🙂
For now, I am going to implement the future forecasting using the above link with this ARIMA(0,1,0) and will check how it behaves. 🙂
Hi Jason, thanks for the tutorial i am new to the world of predictive analysis but i have a project to predict when a customer is likely to make next purchase. I have dataset which include historical transactions and amount.
Will this tutorial help me or is there any suggestion on material/resource i can use.
Used your epic tutorial to forecast bookings.
I used the whole of 2017 as my data set and after applying everything in your post the predicted graph seems to be one day off i.e. prediction graph looks spot on with each data point very close to the what it should be, the only thing is is that it’s a day late…is this normal? Is there something within the code that causes something like this?
Hi, i have had a question for a while, now this might be silly but I can’t figure out whats wrong here…
So I have a timeseries data and when i used order=(0,1,0) that is, differencing is 1 then i get a timeseries that is ahead of time by one.
example:
input: 10, 12, 11, 15
output: 8, 9.9, 12.02, 11.3, 14.9
Now if I shift the resulting series by one timeperiod, it’ll match quite well.
Also, similar output can be seen is (0,2,1) that is, differencing is 2 and MA is 1.
Could someone explain why is this happening and what am i missing here.
[numbers in example are representative not actual]
Thanks Jason, I went through the link and it helps me see a clear picture which should have been obvious to notice but i missed it.
If you please, could also share some thoughts on…
– My model uses order(0,1,0). i.e. differencing is 1. Do such model makes sense for a practical scenario where we are trying to predict inventory requirement for a part(based on past consumption) that may fail in coming future(where failing of a part is totally a random act of nature).
– Also, (0,2,1) and (0,1,0) gives very similar results. Is this expected in some sense. Is there any concept that i am missing here.
Thank you for the tutorial. It’s a good start to implementing an ARIMA model in Python. I have a question: You have used the actual data samples to update your training dataset after each prediction as given in “history.append(obs)”. Now let’s take a real life example when you don’t have any further actual data and you use your predictions only to update your training dataset which looks like “history.append(yhat)”. What will happen in this case? I am working on air quality prediction and in my case, the former scenario keeps the seasonal pattern in the test set but the latter does not show any seasonal pattern at all. Please let me know what’s your take on this.
Hi Jason ,
Thank you for the tutorial.
I have two questions :
first : why you set moving average “q” Parameter by 0 ?
second : why you set Lag value To 5 not 7 for example?
Thanks.
I know that the third output from model_fit.forecast() consists of the confidence interval. But how can I plot the confidence interval on the whole range automatically?
I’m running this with a separate data set. I’ve shaped my dataset, but when I run the error line, I’m getting this:
ValueError: Found array with dim 3. Estimator expected <= 2.
Code:
history = [x for x in X_train]
predictions = list()
for t in range(len(X_test)):
model = ARIMA(history, order=(10,0,3))
model_fit = model.fit(disp=0)
output = model_fit.forecast()
yhat = output[0]
predictions.append(yhat)
obs = X_test[t]
history.append(obs)
print('predicted=%f, expected=%f' % (yhat, obs))
Hi Jason,
Thanks for this great work!
If you allow me, I have a question: how was the confidence interval calculated in the above example? I know its equation, but I do not know what are the values to be used for (sigma) and (number of samples).
Thank you once more.
Thanks a lot Jason!
I am preparing a time series model for my capstone project, i have around 500 items and the p,d,q value is different for each item, how can i deploy this as a tool? do i have to create model each time for different items?
How many minimum data points do we require for creating accurate prediction using ARIMA model. We are predicting future cut-off values of colleges using previous records, how many years of records would we need to predict just the cutoff value of next year.
Hi Jason Brownlee!
I have been following your blog since some time and the concepts and code snippets here often come handy.
I’m totally new to time series analysis and have read some posts (mostly yours), a few lectures and of course questions from stackoverflow.
What confuses me is, to make a series stationary we difference it, double differencing in case seasonality and trend both are present in the series. Now while performing ARIMA, the parameter ‘I’ depicts what? Number of times we have performed differencing or lag value we chose for differencing (for the removal of seasonality).
For example, let say there is a dataset of monthly average temperatures of a place (possibly affected by global warming). Now there is seasonality (lag value of 12) and a global upward trend too.
before performing ARIMA I need to make the series stationary, right?
To do that I Difference twice like this:
differenced = series – series.shift(1) # to remove trend
double_differenced = differenced – differenced.shift(12) # to remove seasonality.
Now what should be passed as ‘I’ to ARIMA?
2? As we did double(2) differencing
or
1 or 12 as that’s the value we used for shifting.
Also if you’re kind enough, can you elaborate more how *exactly* did you decide the value of ‘p’ and ‘q’ from acf and pacf plots.
Or link me to some post if you have already explained that in layman terms somewhere else!
The computed initial MA coefficients are not invertible
You should induce invertibility, choose a different model order, or you can
pass your own start_params.
How do I fix this error? Best ARIMA params are (4,1,3)
Thank you very much, your blogs really come in handy for a beginner in python. when I run the ARIMA forecasting using above codes, getting some format error. I have tried to use Shampoo sales data too. below is the error note,
File “”, line 1, in
runfile(‘C:/Users/43819008/untitled2.py’, wdir=’C:/Users/43819008′)
File “C:\ProgramData\Anaconda3\lib\site-packages\spyder\utils\site\sitecustomize.py”, line 880, in runfile
execfile(filename, namespace)
ValueError: time data ‘19019-01-2019’ does not match format ‘%Y-%m’
I have tried all the format in excel and saved as CSV. but nothing helped me. hope you can help me.
Hi Jason, I recently came accross your blog and really like the things I have learned in a short period of time. Machine learning and AI are still relatively new to me, but I try to catch up with your information. As the ARIMA Model comes from the statistics field and predicts from past data, could it be used as the basis of a machine learning algorithm? For example: if you would create a system that would update the predictions as soon as the data of a new month arrives, can it be called a machine learning algorithm? Or are there better standarized machine learning solutions to make sales predictions?
>>the last line of the data set, at least in the current version that you can download, is the text line “Sales of shampoo over a three year period”. The parser barfs on this because it is not in the specified format for the data lines. Try using the “nrows” parameter in read_csv.
series = read_csv(‘~/Downloads/shampoo-sales.csv’, header=0, nrows=36, parse_dates=[0], index_col=0, squeeze=True, date_parser=parser)
worked for me.
Thank you for posting this. I was having the same issue. This solved it.
Your materials on Time Series have been extremely useful. I want to clarify a basic question on Model results. For an ARMA(3,0) , the statsmodel prints the output as
coef P>Z
If I want to convert the output to a linear equation will the Predicted Traffic for Jan10 be :Pred= c+ x1*85 + 0*x2 + x3*100 ?? Appreciate your thoughts
Thank you very much Jason. That post was very helpful. Putting the options no constant has given me the exact result for prediction. i.e., dot product of coefficients and the lagged values.
Hi Jason!
I have a compile error: insufficient degree of freedom to estimate, when finishing my program on ARIMA in Python. Could you tell me what leads to this error? Cuz I found little answer in other solution website like stack overflow.
Hoping to hear from you!
Thank you, Jason!
Hi, Jason.
Thanks for the writeup. When running your code with a small dataset (60-ish values) it runs without a hitch, but when I run it with an identically-formatted, much larger database (~1200 values) it throws this error:
“TypeError: must be str, not list”
Any idea why this is? Thanks in advance.
Hi Jason,
Do you know how predict from estimated ARIMA model with new data, preserving the parameters just fitted in the previus model?
I’m trying to accomplish in python something similar to R:
# Refit the old model with newData
new_model <- Arima(as.ts(Data), model = old_model)
Jason, great tutorial! I follow your blogs and book regularly and they help me a lot!
However I have some conceptual doubts that I hope you can help me with.
1. If you don’t do a rolling forecast and only use the predict function, it gives us various predicted values (number of predicted values are equal to length of training data). How are the predictions made in this case? Does it use the previous predicted values to make next predictions?
2. When I validate a neural network made of one or more LSTM layers, I pass actual test data to the predict function and hence it uses that data to make predictions, so is walk forward validation/ rolling forecast redundant there?
Hi Jason, thank you so much for all your tutorials. They have been of great help to me.
I had a question about the ARIMA model in statsmodels. If I want to select certain lags for the parameter p instead of all lags up until p how would I to do it ? I have not seen functionality for this in statsmodels, I wondered if you knew.
Yes, I totally understand why we use walk forward validation, but I see a major drawback of it i.e it works great with shorter time series, however when you have a longer time series and multiple variables, it takes a really really long time to re-fit a SARIMAX model and get the predictions.
That’s why what I intended to ask in the second point is, if instead of a SARIMA model, I use an LSTM model, do I still need to do walk forward validation, since it already uses the actual values up to the point of prediction.
Hi Jason, thanks for the great post. My time series problem is kind of different. The data lag I have is large and inconsistent. For example, I want to know for the order I received 6 pm today, how many hours we will use to fulfill this order. We might not know the fulfillment time for order received at 5 pm, 4 pm, or not even yesterday since they might not be fulfilled yet. We have no access to the future data in real life, do you have any suggestion on this? Thank you so much.
Hi Jason. Thank You very much for teach how ti make Forecast. Butaca i have a doubt, in this example only we have 12 prediction for 12 observations (or expected values).
Un this case, i would like yo know. What is the prediction to the short future.
Hi! Thank You for your teach.I have a problem when I use the ARIMA to build a model for the multivariate data,but appear some error”TypeError:must be str,not list”at”model=ARIMA(history,order=(5,1,0))”.The history data is a list of 500*2.
Hey man, great tutorial. I just wanted to ask you how does residual error or its graph fit into time series analysis, I mean i am not able to understand the importance of residual error, what does it show. I am still in the learning phase.
I’m considering buying your book. Will the code examples be up to date seeing as it is now 2019? Also, what success have you had forecasting several time series, lets say 30, with the same model. Would you suggest more of an ensemble approach?
Yes, I update the books frequently. After purchasing, you can email me any time to get the latest version.
Hmm, 30 is not a large number, it might be best developing a separate model for each and compare the results to any model that tries to learn across the series.
I still don’t understand why the forecast is one step ahead of the actual value. Why is this behavior expected, If for instance my model predicts very well the timeseries but with a lag, does this mean that my model is good or I should go on tuning to take off the lag?
In the case of the lag, the line print(‘predicted=%f, expected=%f’ % (yhat, obs)) isn’t it also lagged and not representative of the actual comparison?
Thanks Jason for overview of ARIMA model with example,
In below code, are you creating model again and fitting in each pass of for loop ?
In other algorithms we generally create model and fit model once and later use same to predict values from test dataset.
for t in range(len(test)):
model = ARIMA(history, order=(5,1,0))
model_fit = model.fit(disp=0)
I have a question regarding the practical use of ARIMA. Is it possible to use it (after fitting on some dataset), to test the prediction from any new input data, just like any regression algorithm ?
For instance, I have one year of temperature data on which I fit my model, using the last 7 points (say 1 point per day) for autoregression. Then, to use the model in production, I want to simply store the last 7 days and use them to predict the next one. (Without the need to fit my model again and again each day)
I am new to Auto Regression and Python. Great articles, I am finding them very helpful.
My question is around how much historical time series is enough to stand a chance of getting a good prediction? For example, if I have two years worth of data (adjusted to remove trends and seasonality) then does it really make a difference if I use all of it in a training set or use latest use latest subset e.g last 50 days (assuming lags would be less than 10?)?
Also, how should I think about accounting for seasonality. I understand I would need to remove it from the time series in order to get a reasonable prediction. Should I then have an overlay on top of predicted values to impalement the impact of seasonality?
It depends on the dataset, try different amounts of history to see how sensitive your model is to dataset size.
You can remove seasonality or let the model remove it for you in the case of SARIMA. Any structure removed must be added to predictions, it is easier to let the model do it for you perhaps.
Thank you for this. What are some good strategies to handle zeros (zero demand) in your time series. I know consecutive zeros can be a problem for AR algorithms (false collinearity) and for Triple exponential multiplicative version.. Is there any useful resource you can point to? Something like a normalizing/ denormalizing?
Also, if I have a lot of time series to forecast for, where I cannot really visualize each of them, what are some indicators that will be helpful to describe the time series and the path to follow?
Hi, thanks Mr.Brownlee for your great posts. I had a question, can ARIMA model be used to forecast NA values in a dataset? I mean can it handle missing values?
I am trying to fit an ARIMA model to an company invoices timeseries. It has a timestamp (not regulary spaced) and a value that can be negative or positive – with a large interval.
Do I have to interpolate in order to have regular intervals? If I use a naive solution, as group by day, I get a lot of zero values.
Hi Jason,
Thanks for writing such a detailed tutorial.
In your text, you mentioned that “A crude way to perform this rolling forecast is to re-create the ARIMA model after each new observation is received.” Is there another way to do so without retraining the model? Is there a way just to update the inputs (and not the parameters?
After our first prediction, we get the true value and the prediction error we now use the new information to predict the next step (without retraining)?
Thanks for the rapid reply, and sorry for not being clear.
If I understood it right, model.forecast() will forecast one step at a time.
I’ve 4 months’ worth of data sampled every 1 min. I’d like to test how well it predicts the next minute (or 10 minutes). If my training dataset ends at time t, after predicting t+1, the true value will be available and can help to predict t+2. I see 3 options to do so:
1. Use model.predict() for 2 samples, but then I don’t use the new information.
2. As in your example, retrain the model every timestamp – I’d like to avoid this as I’m considering running this in real-time and don’t want to retrain at every sample. I don’t think the model parameters have changed.
3. Update the model input without retraining the model. Meaning, update the time series samples by adding new observation but without updating the model parameters
Hey Jason, I’m currently doing my thesis on forecasting electricity load and am also using the ARIMA from statsmodels.
You mentioned, that the reestimation you are doing for forecasting is a crude way of doing this as you compute a new ARIMA for every step. What would be a nicer way to do this? Maybe with fitting the model on the training data and after each forecasting step appending the real value to the data and then forecasting the next step (without having to fit the model again)? I couldn’t figure out yet how to do this, might this work with the initialize() function of the ARIMAResults class?
Btw, thanks a lot for this excellent tutorial, it’s really well explained!
Hey Jason I’m doing a project on crime prediction and wanted to use ARIMA model could you help me in understanding what kind of factors would predict the trend
What made you choose 5 lags for this dataset? In other words, what is the threshold we should choose for autocorrelation? Is it above 0.5? What about negative correlation? So in this example, the absolute value of the negative correlation is <0.5. How would we choose the number of lags (p) if it was say -0.52?
Dongchan Christopher KimSeptember 7, 2019 at 5:34 pm#
Loving the post! It definitely helps me grab of ARIMA. I needed to find a technique forecasting sales of an object where the growth path jumps up and down drastically. And this was the point I needed to have some smoothing ways for the projection rather than stochastic process. Not to mention, the code is simple and efficient well enough. Thank you very much.
Hello Jason. I am new to Series Forecasting in Python. I would like to dig into it and learn how to forecast time series. I have recreated your ARIMA sample with my own data and it worked. I have a unix time series and would need to forecast the next 5 future values. I have not fully grasped the concept of predicted/expected and how I can get these future values. Did I misunderstand the model? I will buy your ebook, but maybe your response will help me proceed fast.
One more question: I am using a time series with a frequency of 1 minute. The series is correctly setting a DateTimeIndex in col 0 and there seem to be no values missing. When I call ARIMA I get this message: “ValueWarning: No frequency information was provided, so inferred frequency T will be used. % freq, ValueWarning)”. None of you examples are based in 1 minute frequencies. Is it not possible to work with 1 minute time series with ARIMA?
All sorted. I am using the unix time stamps and its working. I am almost through with your book and have already included the ARIMA model in my project. I have implemented the grid search and have generated the best order combination. I would assume that the order combination is the key to making the best possible forecast, right (considering that the dataset has been prepared and is suitable for modeling)?
Thank you for the link. This will defenitly help. I am half way through your book on Time Series Forecasting and will get there too, I guess. Your book is well written, hands on. Ta
Interested if you know what type of correlation pandas.plotting.autocorrelation_plot is using. I get a different result with this data set using pandas.Series.autocorr over 35 lags than I do from autocorrelation_plot.
This is a copy paste of the autocorrelation_plot code to retrieve the data:
from pandas.compat import lmap
series = shampoo_df.Sales
n = len(series)
data = np.asarray(series)
mean = np.mean(data)
c0 = np.sum((data – mean) ** 2) / float(n)
There isn’t any information I can find about why they wouldn’t be using pearson’s r. This almost looks like it could be it, but it isn’t. And mathematically float(n) cancels out in the equation above, which is odd that it wasn’t caught.
Anyway, if you could shed any light on why pandas.Series.autocorr is different than pandas.plotting.autocorrelation_plot that would be very helpful!
1) ARIMA model works on three parameters – Auto-regression, Differencing and Moving average. So does the ARIMA model makes three separate columns like – one for AR, another for Differencing and and other for Moving average separately or it does only one column and does all the above operations on the same column only (AR, I, MA) ?
2) If ARIMA makes separate columns like (AR, I and MA) for forecasting, then should we also do the same thing to forecast time series using supervised machine learning or we can create only one column with all the operation (AR, I and MA) done on that column only.
I mean to say if in ARIMA model our values for (p,d,q) is (2,1,2) then it will create variables – two variables for Auto Regression i.e for Lag 1 & Lag 2 and two variables for Moving Average i.e MA1 and MA2 and all the variables created i.e AR1, AR2, MA1 and MA2 will be differenced one time as value of d is 1.
do we need to difference the value for y variable also ?
to make the series stationary, we deseasonalize the series by dividing it with seasonal index and difference it for detrending it. Now the same stationary series need to be used for both x and y variables (Dependent and independent variables) and if so then we have to reverse the above process to get the original data.
I am following the below approach to make the series stationary. Is this the right approach ?
The process of deseasonalizing – dividing it with seasonal index and detrending by differencing x(t) – x(t-1)
It seems that the most of methods discribed in this tutorial are meant for testing on the data we already have. How about multi step prediction? Is there any simple way to extend some of the methods to perform multi step forecast? Thanks in advance.
Alexander DautzenbergNovember 24, 2019 at 2:51 am#
Hi Jason,
for my bachelors thesis I need to generate “Sample months of solar radiation”. The problems is as follows: Ive got ten years of historic hourly solar radiation. Its in a DataFrame where every column represents an hour of a day and every row is one day (so starting with the first of january of the first year and ending with the 31st of january of the last year). Now I need to feed my data into a SARIMA Model for each month of the year so that I can use it to generate a fictive month of solar radiation. I want to generate 1000 years and they should each be a bit different, have some kind of a random component to them.
Do you have any idea how to do this?
If I just feed it the DataFrame as is, it returns the “Invalid value for design matrix. Requires a 2- or 3-dimensional array, got 1 dimensions” error.
If I flatten the DataFrame (.values.flatten()), I think it doesnt “see” the seasonality and returns an array as long as the input data when the predict() method is called
In your example you re-fit the model every timestep to do a rolling forecast. This is horrendously inefficient of course–how can this be avoided? Can’t the model be applied to a window of the test set data, and a prediction of next step generated, without re-training it?
Thanks a lot for your reply. How do you do that? I just want to run inference with an ARIMA the same way I would with e.g. RNN–train it up, then feed it arbitrary subsequences from a test dataset and generate the predicted next item in each case. As obvious as a use case as this is, I haven’t been able to see how to effectively do this. The predict method, for example, doesn’t seem to take in the current subsequence, which seems bizarre. I must not be understanding something, but what?
You can fit the model once on the training dataset and make predictions by calling predict() and specifying the interval in the future (beyond the end of the training set) to predict.
Predict will take any future contiguous sequence of steps to predict.
Thanks for the link to your other tutorial, that also was very helpful. But it seems to confirm that Python’s ARIMA can only predict just the few samples after the data set! Using that example, let’s suppose I want to predict days 8-14 past the end of the training set–at this point I’d want to take the real data from days 1-7 into account. But apparently I’d have to retrain the model, with the training data now extended to include these days 1-7. This makes no sense to me, I would have thought that an ARIMA model, once all its coefficients are determined, could be applied to any arbritrary sequence. A (7,0,1) model should need just the prior seven days to make a prediction right? *Any* prior 7 days. Help.
Wow you have a tutorial for everything! Awesome. Thanks a lot. Btw a few years back I recommended your computer vision book to someone at work (on the strength of what I’d seen in the tutorials), who in fact went and bought it from you. Glad now more than ever that I did.
Anyway I’m surprised that what I want here isn’t more of a standard use case. But the idea of course is that to get a good sense of how well the model does, and compare with other models, then I need to generate lots of short-term predictions from a test set, and do so efficiently.
Suggestion–put a link to this tutorial in the original ARIMA blogpost that launched this thread.
PLS HELP!
I have a datetime stamp column and the Power consumed against it. I used ARIMA to forecast Load consumption using:
results_ARIMA = results_AR.forecast(steps=24)
Hello Jason Brwnlee! Congratulations on the article, it is very well explained and easy to understand! I know this is not the purpose of this publication, but I would like to share with you my lines of code, which I adapted from yours, trying to develop the study, but using AutoArima. I have not been very successful at forecasting and am unable to find what is missing so I can reproduce this study with AutoArima. Can you help me?
X = series.values
size = int(len(X) * 0.66)
train, test = X[0:size], X[size:len(X)]
history = [x for x in train]
predictions = list()
for t in range(len(test)):
model = auto_arima(train, trace = True, error_action=’ignore’, surpress_warnings=True)
model_fit = model.fit(train)
output = model_fit.predict(n_periods=len(teste + 7))
yhat = output[0]
predictions.append(yhat)
obs = test[t]
history.append(obs)
print(‘predicted=%f, expected=%f’ % (yhat, obs))
error = mean_squared_error(test, predictions)
print(‘Test MSE: %.3f’ % error)
#plot
pyplot.plot(test)
pyplot.plot(predictions, color=’red’)
pyplot.show()
Can i able to predict the job’s waiting time , i took a dataset from grid5000 and i feel really hard to handle the correlation of the dataset , Can you able to give any suggestion
hey Jason! when i do a predicition on my arima model it simply shows a straight line and no ups and downs. i tried both exponential smoothing and arima and same.. any ideas? thanks!
Perhaps try scaling the data?
Perhaps try alternate configurations of the model?
Perhaps try other models?
Perhaps compare results to a naive model?
Perhaps the series is not predictable?
i have this from the test file :
test[‘forecast’] = mod_fit.predict(start=1, end=51)
test[[‘Counts’,’forecast’]].plot(figsize=(12, 8)) and that plots fine but when i try to go beyond the size of the test file it doesnt work:
test[‘a’] = mod_fit.predict(start=51, end=81)
test[‘a’].plot(figsize=(12, 8))
what am i doing wrong?
that worked . a little better with arma but the exponential smoothing that i thought should be better cuz no trend or seasonality is a straight line again. thanks for the link- great tutorials!
Hi Jason, you have used test data in observation and used it further to train the algorithm, so, it might not be that helpful in situations where we have to predict values for a further couple of months without new observations.
Is this correct or am I missing something? If yes, can you give a few suggestions on how to proceed in this case?
In the above article, you set the AR parameter as 5. In my case, the line starts exactly from the dashed line on y-scale. What is AR parameter in that case?
I haven’t fit any model yet, It is just the beginning where I am plotting the autocorrelation of series to get the value of the AR parameter/lag. In the above article, after plotting the autocorrelation graph, you wrote ‘A good starting point for the AR parameter of the model maybe 5’. My question is ” Did you choose this value from the x-axis where the plot-line enters in the highlighted dashed region?
The auto correlation plot of my data looks like this. Could you please tell me what do I make of this and what should my p and q be according to you? and why?
Did you ever discuss how to predict ETA of production jobs? the jobs might dependent on the other jobs. So before prediction the current job ETA we need to predict the dependent jobs if they are not completed yet.
Thank you very much for this tutorial. I have got single input single output time series data for which I would like to develop a model. I have 4 different samples (single input-single output time series taken at 4 different happenings of the event). I want to model fit to this data. Should I use ARIMA? How will I handle 4 different samples? Many thanks
I am new to time series and have some doubt related to parameter estimation.
I have learnt that the p is estimated from pacf plot and q is estimated from acf plot.
So as per your explanation you have used only autocorrelation which states that lag =5 .But how about MA order which is estimated to 0.Please clarify on the same.
I’m applying an ARIMA model to perform predictions of power in an energy plant. When my time series increases or decreases drastically, my model gives predictions that might be lower than zero or higher than the maximum capacity of the energy plant, which is not physically possible.
Is it possible to configure my model so it doesn’t predict values lower or higher than certain pre-defined thresholds?
For making a prediction using any model containing residual(MA, ARIMA, etc,) We need actual(True) values, but in real life when we are using the model for forecasting we don’t have them (right?), then how do we generate the residuals to make the predictions ??
Thanks for your great tutorials and useful posts.
I would like to do stock price prediction with ARIMA model.
After training the model, I would like to do 5 days ahead prediction.
How to do 5 days ahead prediction?
from the following function
predictions = model_fit.forecast (steps=5) [0]
we will get 5 consecutive values such as [8.01553836, 8.02257257, 8.01886069, 7.85799964, 7.91102623].
the fifth value 7.91102623 is the 5 days ahead prediction?
But I am contineously getting the below error:
py:512: ConvergenceWarning: Maximum Likelihood optimization failed to converge.
Check mle_retvals “Check mle_retvals”, ConvergenceWarning)
I am not sure why it is not converging. I even treid changing solver but no luck.
Hi, Jason. I’ve read the article, but I still not sure why did you pick AR coeff. as 5 at the start? Autocorellation shows significance at first 5 lags, but Im not sure I see how it is related to the AR?
How did you use the ACF plot to determine the order of p at the beginning ? Do you not use a PACF plot to determine the order of p and ACF to determine the order of q?
Hi Jason,
Enjoyed this post, as usual. I believe, AIC and BIC are also good indicators of the ARIMA model fit. (lower the valuve, the better it is). Are there any direct indicators of Box-Jenkins method, built-in into the statsmodels or any other library?
Thanks
C:\Users\HP\Anaconda3\lib\site-packages\statsmodels\tsa\base\tsa_model.py:165: ValueWarning: No frequency information was provided, so inferred frequency MS will be used.
% freq, ValueWarning)
Thank you for helping a lot of people with your skill. Me in particular learned a lot from you.
I want to ask Jason if you recommend to let ARIMA do the differencing or do the differencing before fitting ARIMA? Does it make a significant difference if I do one over the other or vice versa?
Thank you very much and please continue helping people.
I have been stuck for days because I cannot find a way to fit a traditional regression model such as ARIMA giving multiple time series as input.
I have got thousand trajectories positions of different vehicles (xy coordinates for each position). Let’s say each sample (trajectory) is composed of 10 positions. It means I have got 10*N different time series (N is the total number of samples).
I want to fit the model with all samples for x coordinates and then predict the future position of any new trajectory that I give in input.
Then I plan to do the same with another model for y coordinates.
What I do not figure out is that one have to give sklearn models a sequence of observations as a list or a numpy array. But, in my problem, I do have multiple parts of trajectories from different vehicles. If I create a list with all trajectories of all vehicles, the data will be completely mixed up and the model will not be able to fit these data.
What I want to demonstrate is that a number of time series can be (or cannot be) modeled with a single model for my problem (i.e. the same parameters work for all the time series). I want to fit them all simultaneously.
Do you think it is possible to resolve the problem I am describing for multiple trajectories (having different length) from multiple vehicles using traditional regression model?
Do you think I have to assign each object a different variable, take trajectories of same length in a fixed window of observations (for example the 10 last values) and give these data to a sklearn model?
I want to forecast the 10th position of an object. To do that, I created windows of the 40 last positions for all vehicles. But now, I do not understand how to transform my dataset (thousands of trajectories, 40 positions per trajectory) to give to the model using statsmodels…
Consider I am only working with the x coordinate for the moment (I want to create one model for x coordinate and one for y coordinate).
What is the tuple returned by the model_fit.forecast() method? Statsmodels documentation is really poor… They just say it is the predicted values but does not explain what each dimension represent. What does the method return different values?
I am working on Project of prediction and forecasting of pharmacy store sales based on past sales data. Its more likely to forecast future sales , so does ARIMA MODEL is suitable for such according to you ? Whats your view on this? How can I work on this? Any links or suggestion plz.
I am working on project to predict ground water level on post ground water level dataset, does Arima model is suitable or there is another model more suitable than Arima model for ground water level ?
any link or suggestion??
Thanks a lot for your article, it’s very informative.
Do you know how can I have 2 dimensional input instead of one dimensional?
I have x,y coordinates of a robot and I would like to predict its position after K steps.
Just as a feedback. Mainly because you are able to answer challenger questions on the comment section, you are gaining my full trust. Not sure if there are many tested sources like yours. so pls. keep-up good work!
I hope you provide some Vector autoregression (VAR) use cases to utilize external features as well. Thanks!
Yes. I have already benefited greatly from the cheat sheat for VAR and VARMA. there are some details that require deeper understanding particularly tho. particularly in selecting features (as exog or endog, and select correlated ones.) and also correctly forecasting (with the right transformation,etc.)
I am interested in exploring the association between 2 time series (e.g. attitudes to vaccinatination and vaccination rates).
I am looking at survey data collected on a yearly basis and I have data available for ~17 time points. I am considering ARIMAX to explore my data but I am not sure whether it is the most appropriate tool. A lot of studies using ARIMAX seem to have more granualr data (monthly or quarterly). I also read you would need ~50 observations for aggregated data and this is not my case… I am new to this though so I would welcome some expert opinion.
Thanks for your prompt response,
Jason, i only have 1000 data points(in my training set) and i need to predict the next say (1001 to 10000) values. How can i use your code for the same?
So, I have this time series made of internet traffic. Initially, it was monthly data but I have taken samples from it based on the time it was registered on the network (weekly, daytime (from 05:58 – 17:59, evening(from 18:00 – 23:59)). Essentially I want to assess how sampling affects the series by quantifying their differences so that I can come up with some confidence interval of what one should expect if they just had lets day weekly data instead of the monthly traffic based unique source IP(this is my variable of interest). is this doable with arima?
I have tried a lot of the models(https://machinelearningmastery.com/time-series-forecasting-methods-in-python-cheat-sheet/) but each of them is giving values that I can’t really work with. What would suggest I do to quantify the differences between these subsamples in the series and what the best approach is. I am assuming if none of them is working I must be doing something wrong.
How can I get the confidence interval from this problem while considering all the statistical values that would quantify the differences between the main series and its sub samples?
Thank you for your response, You have answered the question in part:
Other than using models or ML, what other ways can one use to quantify(using well know statistical methods) the differences between two or more time-series?.
In other words without using ML or statsmodels how can I quantify the differences that exist between times series?
Hey Jason, Great tutorial. Literally saved me for my Masters’s Project. I have followed the same steps as yours but with my dataset and was able to compile it successfully in the Jupyter notebook. But my issue is my Website is made in the flask(python) and want to deploy this time series forecast into it. Any help on how to do it is highly appreciated.
When running the above code, you get an error that says:
“FutureWarning: statsmodels.tsa.arima_model.ARMA and statsmodels.tsa.arima_model.ARIMA have been deprecated in favor of statsmodels.tsa.arima.model.ARIMA (note the . between arima and model) and
statsmodels.tsa.SARIMAX. These will be removed after the 0.12 release.”
When you then modify the code as was mentioned above to
statsmodels.tsa.arima.model.ARIMA
you get another error later on that says :
\Anaconda\lib\site-packages\statsmodels\tsa\base\tsa_model.py:524: ValueWarning: No frequency information was provided, so inferred frequency MS will be used.
Here is the output of what happens when you modify the ARIMA library to the new one.
As you can see, the coefficients are no where near what you have and the mean of the residuals is now almost 22 instead of -5.
Can you please help?
Thanks for the tutorial !! It was very helpful.
Can you suggest how can I forecast for a dataset with multiple time series? I have a dataset with 1000 client codes having historical monthly revenue. I need to forecast revenue for all the clients.
Thanks in advance.
I have question:
I’m trying to develop an ARIMA model such as yours to predict a stock price. The procedure done is exact the same as yours, but when plotting the results, my predictions are practically the same than the step before.
Hi …… thanks for all
In university books we find
AR(p) —To determine the value of p we use- PACF
I(d) ———difference for stationary
MA(q)—–To determine the value of q we use-ACF.
But you used ACF to extract p = 5 and it should be q = 5, not p. Please explain more
Hi Jason, Thanks for posting this excellent article. I am a big fan of your articles.
I have one doubt. How to check if our data is seasonal or non-seasonal. Everyone says that if the data is seasonal we can use SARIMA model. But how do I check if the data is seasonal or not?
Is ETS the only way to check if data is seasonal/non-seasonal?
Also, how do we decide if we have to consider the seasonal components too?
Thanks in advance.
I would like to apply ARIMA (or better say VARIMA since I have multiple features) for replacing NaN in my data frame. In particular these NaN are past samples.
Do you have an article or references for the python implemention?
yes so far I use the last observation, but I was wandering whether this can be further improved by using VARIMA or even EM algorithm, but I cannot find complete reference for python implementation for those
As part of my master’s thesis I am applying an ARIMA model, this tutorial helps a lot. However, I have one difficulty. My test data set has 752 observations, however the predictions vector that is created as part of the ARIMA model contains 772 observations. So there are 20 predictions too much and I can’t calculate a RMSE either. Do you know what could be the reason for this?
Here are the most relevant lines of my code:
# Define that the dataset will be split into 67% training data and 33% test data
Traindatalen=math.ceil(len(Close)* .67)
print(Traindatalen)
# Split the data into train and Test Data
x_train = Close[0:Traindatalen]
x_test = Close[Traindatalen:]
# fit ARIMA Model
model = ARIMA(x_train, order=(2,1,1))
model_fit = model.fit()
# Print Model summary
print(model_fit.summary())
# Transform x_train and x_test into desired Data format
x_train_array=x_train.values
x_test_array=x_test.values
# Create list of x train values
history = [x for x in x_train_array]
# Establish list for predictions
predictions = list()
# Forecast
for x in range(len(x_test_array)):
model = ARIMA(history, order=(3,1,1))
model_fit = model.fit()
output = model_fit.forecast()
yhat = output[0]
predictions.append(yhat)
obs = x_test_array[x]
history.append(obs)
print(‘predicted=%f, expected=%f’ % (yhat, obs))
I am familiar with the calculation of the RMSE. The problem is not in the calculation of the RMSE, but in the fact that my ARIMA model makes 772 predictions, although it should make only 752. My test data set has only 752 observations. Even though I write in the for-loop “for x in range(len(x_test_array))” , not 752 predictions are made but 772.
So it makes 20 predictions too many and I can’t find the error in my code. So I would compare 772 predictions with 752 actual values, which makes no sense.
Have you ever heard of this problem and possibly how to fix it?
Perhaps there is a bug in your implementation or one of your assumptions is incorrect. I recommend carefully inspecting your code for the cause of the fault.
Thanks for your help. I found if I don’t use diff function before like:#df_diff = df_train_test.diff(1), when I use ARIMA model, and there was a error that ‘exog contains inf or nans’. indeed, when we did diff function, the first data will be Nan in result. but how to fix it when I directly use parameter in ARIMA model to diff origin data? thanks !
Thanks for your ARIMA program. I tried to apply the ARIMA model to a data in my own workspace. However, I encountered the following error. My data is a long data, daily data from 1963 to this day. How can I apply the ARIMA model to this data?
from pandas import read_excel
from pandas import datetime
from matplotlib import pyplot
def parser(x):
return datetime.strptime(x, ‘%d-%m-%Y ‘)
series = read_excel(‘/content/data.xlsx’, header=0, parse_dates=[0], index_col=0, squeeze=True, date_parser=parser)
print(series.head())
series.plot()
pyplot.show()
TypeError: strptime() argument 1 must be str, not datetime.datetime
Hi Jason
When making predictions against a training set, the forecast looks relatively close to the actual data. however, when i make a forecast on data outside of the training set, the forecast looks more like a trend line and doesnt have the same spikes as the test data does
Hello Jason,
Thanks for the article.
If I want to genereate a sample of an ARIMA(7,1,9) from scratch (i.e. I have no data to fit the model), how can I do? I know that for an ARMA process I can use the method ‘generate_sample’. But I didn’t find the same thing for the ARIMA class.
I realise under your example of rolling forecast ARIMA model, you didn’t include time variable into your ARIMA model but just plain sales values. Can you do an example for the ARIMA model to take into consideration of the time variable as well? Thanks
Ive used many of your tutorials on using and improving ARIMA models for a Univariate time series one step ahead prediction.
So far the best results come from p,d,q values of 0,1,1 but then all its doing is using values from the previous time step for the next prediction. Is there anyway to fix this problem?
Perhaps try alternate data preparation, alternate model types, and alternate configurations in order to discover what works well or best for your dataset.
I had a question regarding the “ARIMA Rolling Forecast Line Plot” at the end of the tutorial.
I was wondering what the labels are for X and Y axis. I understand the Y axis are the actual values, but I was a bit lost about what the X axis represents?
Apologies if this is a repeat question, I wasn’t able to find it in the comments.
By “try some machine learning algorithms” you mean that, convert the time series into supervised learning and then apply some kind of Random Forest algorithms?
Ordinal Encoding doesn’t work in my case because the categorical variables have no inherent order. For example, my categorical value will be something like zip code or state name.
I have a question that may sound silly: What would be the approach to link a time series to an element in a set of possible outcomes ? not predicting but picking
Thank you in advance for any information/help we can provide on that subject
Hi Jason,
I have the rolling ARIMA forecasting models functioning for my data, but how do I use this training method to then predict years in the future? I tried to use model_fit.forecast, but it gives me nearly constant values for every step, unlike what should be expected.
Thanks so much for this article- it is so helpful!
Hi
Thank you for your attention from beginning.
I am a beginner in Python and machine learning .I have a practice that is on messenger or Twitter data and I have to build a model for predicting the posting time of a channel’s next post by giving a specific time on a specific day of the week.
For example, we give the model “seven o’clock on Wednesday” and expect it to return us the time to send the next post into “minutes”
Did you work on this example or did you have or see an tutorial video or example about it ?? To guide me. Preferably with pyspark or with Python
please woulde you help me. I have only 2 days that do this practice.
Do you think this can be done with k-means or Logistics Regression, Naive Bayes, Decision Tree?
I have separated post time, comments and hashtags.
But I have no idea at all about it for continuing this work.
Thank you for your guide and comment.
Hi Jason. I want to choose a best Investment option in Gold Bonds using forecasting model for predicting future returns of the bond. Please guide me with best model and code.
As a toy example, you can follow the sample code in this post. But you may want to see if some preprocessing helps. For example, as it is bonds, do you want to model the yield or model the price? That gives you different perspective and you may have a better model one way or the other.
Hi Jason,
Your blog is truly an inspiration and a real help to newbies like me.
I had a question on ARIMA.
I want to forecast height at age 10 based on data collected in the past. My dataset has height for different ages(0-6 year) for 100 different individuals. Can I apply ARIMA on such a dataset? if yes, how?
You better check if it makes sense from a biology expert. Assume it is so, then you just follow the steps to find the best fit parameters. You may need to use grid search for the optimal (p,d,q) parameters for the ARIMA.
I believe that would be string! So you can’t use it directly, but you need to clean it. For example, take first four character of the year column and convert it to integer before applying ARIMA.
I am trying to compare the performance of an ARIMA model with more advanced neural network models. I used the auto_arima function in the pmdarima package to estimate the optimal lags, order of differencing and moving average parameters which I then store and use in the walk-forward procedure.
However, I was wondering whether the approach in this tutorial is directly comparable with the “sliding window” approach taken in the neural network tutorials. For example, if it turns out that the optimal lag value is p=10, would that be equivalent to setting the input time steps to 10 in the sliding window neural network models?
One last thing, how would this work with an ARIMAX model? I know you can add the exog option to the ARIMA function, but I am not sure how to reshape the exogenous data matrix. Do I need to create an n-dimensional list of arrays (where n is the number of features)?
Hope you see this and many congratulations on your website, really useful stuff!
I am not so confident that 10 you got there means 10 you should use here. After all there are two different models. But I am not saying unrelated, because that might mean some hidden information can last up to 10 lags, just it is not so easy to confirm.
Hey, thanks for your reply! I had a look at the documentation you linked on SARIMAX but it does not address how to do out-of-sample forecasting with the one-step-ahead method as explained in this tutorial. I’ve tried to modify the above loop for walk-forward-validation to include exogenous variables
predictions = list()
for i, t in zip(test_endog, test_exog):
model = SARIMAX(train_endog, exog=train_exog, order(order),enforce_stationarity=False)
model_fit = model.fit()
output = model_fit.forecast(exog=test_exog[t])
yhat = output[0]
predictions.append(yhat)
endog_obs = test_endog[i]
train_endog.append(endog_obs)
exog_obs = test_x[t]
train_exog.append(exog_obs)
However, it keeps throwing me this error:
TypeError: list indices must be integers or slices, not list
Would you happen to know how to fix it?
Thanks again
From your code, it seems to me it is wrong to do “for i, t in zip(test_endog, test_exog)” while later use “test_exog[t]” and “test_endog[i]” because i and t are already elements of test_endog and test_exog.
Sorry, cannot. Usually lag is chose by trial-and-error to get the best score (e.g., AIC and BIC). Try to read the link on Box-Jenkins methodology for how people determine the different ARIMA parameters.
Here it means lags 1 to 10 are positive (can’t be very accurate because the autocorrelation coefficient is varying with the input data) while lags 1 to 5 are significantly positive.
In train-validation-test split, validation is to tell how good your model is. If you don’t have any models to compare against each other, it is not necessary to use validation. Or put it the other way, if you think the test set is good enough to compare models, you don’t need the validation. This is especially common in case of time series problems, which the data are scarce.
I need a few clarifications regarding ARIMA and Exponential(ES) smoothing. Like machine learning model, in ARIMA also we are splitting the data into train and test and fitting the model then error metrics are used exactly like ML. so can we call these ARIMA and ES models are statistical machine learning models?
Hi Vanitha…ARIMA and ES are considered “classical” or “statistical” methods in contrast to “machine learning” methods. The following resource provides an excellent overview and comparison of these two categories applied to time series forecasting.
In the Rolling forecast method, you are appending the actual test value to the training set in each iteration. In a real-time scenario, we will not get future data. so we need to append the predicted value in each iteration right?
Thanks for the article. I have a query. I have a dataset which was not stationary, so I did the first order differencing and performed the Augmented Dickey Fuller and then found the series to be stationary. After that I performed the Auto ARIMA, to select the model with the lowest AIC value. I found one. But we need to check for the residuals too. For that I performed the Ljung Box Test to determine whether the residuals are auto correlated or not. But I found that the p-value for the Ljung Box test is quite less than 0.05 whereas it should have been more than 0.05. Please let me know how to proceed. Any help will be appreciated.
train, test = df99[0:size], df99[size:len(df99)].reset_index()
as
Hi Jason,
Great article as usual. It really helped me also.
One tiny code issue I encountered:
The code block under “Rolling Forecast ARIMA Model”
has:
obs = test[t]
I think it should be:
obs = test[size + t]
The test data array does not have a zero element.
Hi Jason,
Thankyou for the great article.
I have two questions:
1. When we have to predict for multiple steps ahead of our data range, we might not have testing data for it. The one step forecast method is viable for accuracy while testing, but when forecasting for multiple steps ahead of the data range it would be missing. In this case, should we append predictions and continue doing one step forecasts? Or use 12 steps in forecast (for each month an year) and avoid appending previous step predictions?
2. Does Grid search cover majority of the areas for calculating p,d,q values? I cannot do ACF, PACF as i have to forecast 100s of products.
Thanks very much for your page, it is really informative.
One thing I have seen after trying your example out however is the evaluation metrics and how they actually get worse when you increase the training set which I would think to be typically incorrect?
For example, your train test split is 66:34, and you get a RMSE of 89. I increased the split to 70:30 and the RMSE increased to 95. Similarly, if I decreased the split to say 50:50 which is unusually low, the RMSE decreases to 87 and this happens for all increasing/decreasing values.
Would you be able to possibly explain why this might be?
Thanks very much for your help
I read this post however I still don’t quite understand how it answers my question. Because I used the Shampoo dataset from this example for my tests and kept the total sample constant, only varying how much I split the train and test data so I don’t think the ‘total’ amount of data trained is the problem?
My confusion is coming from when we obtain the train, test ratio so that the training data is much more than the test data. For some reason the accuracy decreases a lot even though typically, we know that training too much training data compared to test data would lead to overfitting and high accuracy result?
Hello Sir, Thanks for this excellent resource on ARIMA, as well as the grid search for hyperparameters for ARIMA.
Your explanation on choosing ‘p’ was great. I request you to kindly give some simple pointers on what ‘d’ and ‘q’ physically mean, or how they can be chosen, as a first guess. It will be great to have good physical understanding of p, d, q before grid search can be adopted as a range around them.
Another doubt Sir.
For the rolling forecast, aren’t we supposed to append the newest data point as well as remove the earliest data point, in order to keep the most recent, but SAME size “training data”?
I’m trying to use arima from the statsmodel package in python to fit and perform an out-of-sample prediction. First I found the order=(i,d,j) considering training data. With the parameters defined, I perform a for loop with the size of the test data to forecast for an out-of-sample period. At each iteration I add the t position of the test data to the training data (eg hist.append(test[t])) and then plot the test and prediction data to perform a comparison. But it looks like the prediction is off, what I’m suspecting is that maybe the function is predicting from iteration 0 to the last position of the train data instead of predicting out of the training sample. Has anyone had a similar problem?
I suspect that when using forecast at each iteration of the for loop the prediction does not correspond to a step outside the training sample, but the prediction to the last position of the training vector. I’m thinking that this is happening because when plotting the validation and prediction data, it’s visible that the prediction data follows the behavior of the validation data, but it’s as if the prediction was shifted in one iteration forward, as if it were the shadow of the validation data.
I have the data plotted but I can’t post it here. Is there any way to post the plot? Maybe it’s clearer what I’m talking about.
Are we guaranteed that using forecast gives us an out-of-sample prediction?
I have tried both your “rolling forecast” and “out-of-sample forecast” method on the test dataset, and I think it has been mentioned by a number of people above:
Rolling Forecast (forecast 1 day then adding back to train dataset then re-train) is much more accurate in my case vs Out-of-sample Forecast (forecast 10 weeks using existing trained model )
Therefore I want to use Rolling Forecast as my standard methodology but I can only forecast for 1 day???
This is not very useful as I want to forecast future 10-weeks but with the accuracy level I achieved in Rolling forecast…
Do you have any suggestion to use Rolling Forecast for longer in the horizon while not having actuals available?
Thanks so much
Hi James, thanks so much.
I have read through all the relevent post ref LSTM and it seems to much for what I am doing.
My case is literally using a historical Absence actuals to forecast what could the future Absence be.
And during the back testing, the “Rolling ARIMA” model has given me some amazing results.
Unfortunately it’s when there is an “Actual” to gauge it’s error…
So now I am testing:
1. I am using last week’s actuals as “Pseudo Acutals” for next 2-3 weeks
2. I am using past year’s actual for the same time as “Pseudo Acutals” for next 2-3 weeks
Let see how it goes this way to forecast the future when there is no Actual to gauge in each step
Meanwhile if you could give me some other advice on how to use “Rolling ARIMA” when there is no Actuals to gauge in each step, that would be much appreciated!
HI JONSON
Ihave 6 attributes to forcast the next water consumption depending on the current consumption using time series regression ARIMA model.The attributes are
id, month , year, customer type, consumption, population
private
commertial
public
please support and send some related documents in my email.
thank you
I have a question for instance I have time series which is not stationary in nature.
Hence convert into log form but still not stationary. However, after 1 differencing the time series becomes stationary as per adf test. Then should be using acf and pacf on dfferenced data or into an original data for estimation of p and q
Thank you for this post. It’s really helped me out a lot.
I have a question – I followed the steps laid out above and I generated some predictions by iterating through my test set and fitting an ARIMA model on the updated training/history set. I would now like to generate predictions beyond my test set.
I noticed you mentioned this other post in a different comment, however, I notice you don’t follow the same steps you did here (i.e., you don’t generate rolling forecasts). You fit the model on the training data and then simply predict x steps into the future.
Is there any way to generate predictions beyond the test set using rolling forecasts? The reason I ask this is because my rolling forecasts are really well compared to my test set, however, once I generate forecasts outside of my test set, the predictions aren’t good at all
can you give us any tips on using arima to attempt to predict apple stocks in the future? Me and my team are first time users and would welcome any tips.
Hi Dani…Sorry, I cannot help you with machine learning for predicting the stock market, foreign exchange, or bitcoin prices.
I do not have a background or interest in finance.
I’m really skeptical.
I understand that unless you are operating at the highest level, that you will be eaten for lunch by the fees, by other algorithms, or by people that are operating at the highest level.
To get an idea of how brilliant some of these mathematicians are that apply machine learning to the stock market, I recommend reading this book:
The Man Who Solved the Market, 2019.
I love this quote from a recent Freakonomics podcast, asking about people picking stocks:
It’s a tax on smart people who don’t realize their propensity for doing stupid things.
— Barry Ritholtz, The Stupidest Thing You Can Do With Your Money, 2017.
I also understand that short-range movements of security prices (stocks) are a random walk and that the best that you can do is to use a persistence model.
I love this quote from the book “A Random Walk Down Wall Street“:
A random walk is one in which future steps or directions cannot be predicted on the basis of past history. When the term is applied to the stock market, it means that short-run changes in stock prices are unpredictable.
— Page 26, A Random Walk down Wall Street: The Time-tested Strategy for Successful Investing, 2016.
You can discover more about random walks here:
A Gentle Introduction to the Random Walk for Times Series Forecasting with Python
But we can be rich!?!
I remain really skeptical.
Maybe you know more about forecasting in finance than I do, and I wish you the best of luck.
What about finance data for self-study?
There is a wealth of financial data available.
If you are thinking of using this data to learn machine learning, rather than making money, then this sounds like an excellent idea.
Much of the data in finance is in the form of a time series. I recommend getting started with time series forecasting here:
Hi jason, thanks for the tutorials, it helps me a lot. can you help me with my error? when i follow your steps from
history = [x for x in df_train]
predictions = list()
# walk-forward validation
for t in range(len(df_test)):
model = ARIMA(history, order=(0,1,1))
model_fit = model.fit()
output = model_fit.forecast()
yhat = output[0]
predictions.append(yhat)
obs = df_test[t]
history.append(obs)
print(‘predicted=%f, expected=%f’ % (yhat, obs))
I got some error :
TypeError Traceback (most recent call last)
Cell In[26], line 5
3 # walk-forward validation
4 for t in range(len(df_test)):
—-> 5 model = ARIMA(history, order=(0,1,1))
6 model_fit = model.fit()
7 output = model_fit.forecast()
File ~\AppData\Roaming\Python\Python310\site-packages\statsmodels\tsa\arima\model.py:158, in ARIMA.__init__(self, endog, exog, order, seasonal_order, trend, enforce_stationarity, enforce_invertibility, concentrate_scale, trend_offset, dates, freq, missing, validate_specification)
151 trend = ‘n’
153 # Construct the specification
154 # (don’t pass specific values of enforce stationarity/invertibility,
155 # because we don’t actually want to restrict the estimators based on
156 # this criteria. Instead, we’ll just make sure that the parameter
157 # estimates from those methods satisfy the criteria.)
–> 158 self._spec_arima = SARIMAXSpecification(
159 endog, exog=exog, order=order, seasonal_order=seasonal_order,
160 trend=trend, enforce_stationarity=None, enforce_invertibility=None,
161 concentrate_scale=concentrate_scale, trend_offset=trend_offset,
162 dates=dates, freq=freq, missing=missing,
163 validate_specification=validate_specification)
164 exog = self._spec_arima._model.data.orig_exog
166 # Raise an error if we have a constant in an integrated model
…
455 ‘ shape %s.’ % str(self.endog.shape))
457 self._has_missing = (
–> 458 None if faux_endog else np.any(np.isnan(self.endog)))
TypeError: ufunc ‘isnan’ not supported for the input types, and the inputs could not be safely coerced to any supported types according to the casting rule ”safe”
what should i do with this error? I already searched it in stack overflow but I am still confused about what I should do with my code. Thanks!
Hi james, thank you for the tutorials. it help me a lot. can u help me with my error? i follow your step until
history = [x for x in df_train]
predictions = list()
# walk-forward validation
for t in range(len(df_test)):
model = ARIMA(history, order=(0,1,1))
model_fit = model.fit()
output = model_fit.forecast()
yhat = output[0]
predictions.append(yhat)
obs = df_test[t]
history.append(obs)
print(‘predicted=%f, expected=%f’ % (yhat, obs))
but I got some error:
TypeError Traceback (most recent call last)
Cell In[26], line 5
3 # walk-forward validation
4 for t in range(len(df_test)):
—-> 5 model = ARIMA(history, order=(0,1,1))
6 model_fit = model.fit()
7 output = model_fit.forecast()
File ~\AppData\Roaming\Python\Python310\site-packages\statsmodels\tsa\arima\model.py:158, in ARIMA.__init__(self, endog, exog, order, seasonal_order, trend, enforce_stationarity, enforce_invertibility, concentrate_scale, trend_offset, dates, freq, missing, validate_specification)
151 trend = ‘n’
153 # Construct the specification
154 # (don’t pass specific values of enforce stationarity/invertibility,
155 # because we don’t actually want to restrict the estimators based on
156 # this criteria. Instead, we’ll just make sure that the parameter
157 # estimates from those methods satisfy the criteria.)
–> 158 self._spec_arima = SARIMAXSpecification(
159 endog, exog=exog, order=order, seasonal_order=seasonal_order,
160 trend=trend, enforce_stationarity=None, enforce_invertibility=None,
161 concentrate_scale=concentrate_scale, trend_offset=trend_offset,
162 dates=dates, freq=freq, missing=missing,
163 validate_specification=validate_specification)
164 exog = self._spec_arima._model.data.orig_exog
166 # Raise an error if we have a constant in an integrated model
…
455 ‘ shape %s.’ % str(self.endog.shape))
457 self._has_missing = (
–> 458 None if faux_endog else np.any(np.isnan(self.endog)))
TypeError: ufunc ‘isnan’ not supported for the input types, and the inputs could not be safely coerced to any supported types according to the casting rule ”safe”
I already searched it in stack overflow but I still confused about what I should do with the code. can you help me figure out whats wrong with the code? thanks!
ist there also a way to not do a rolling forecast?,
meaning i want to fit() the model just once and then only give it one new data point and get one prediction without changing the model?

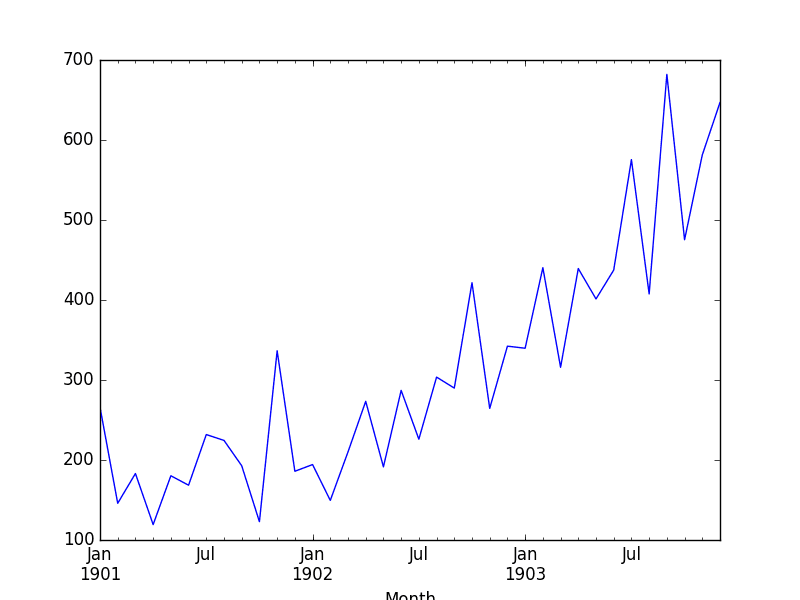
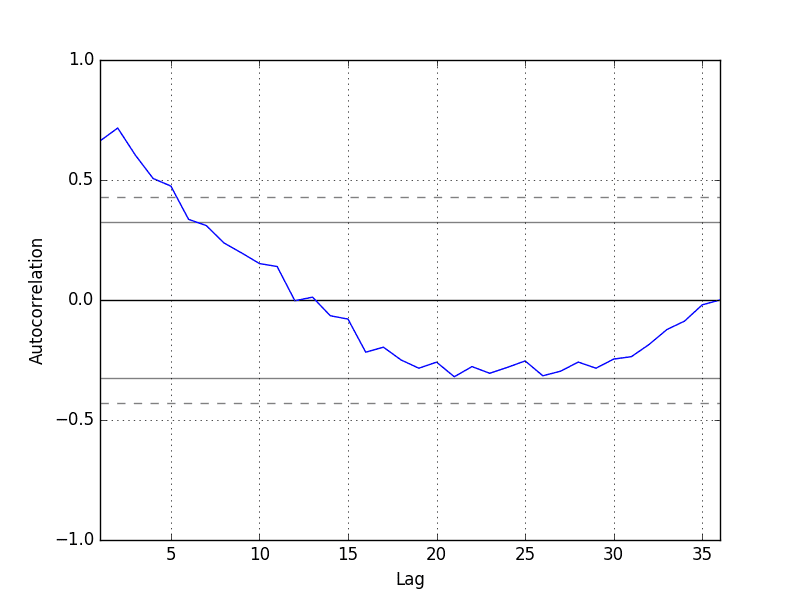
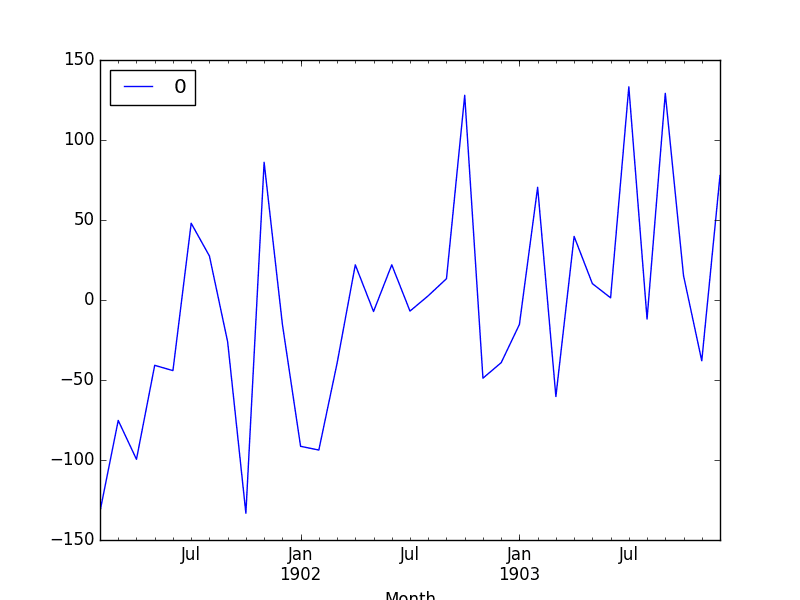
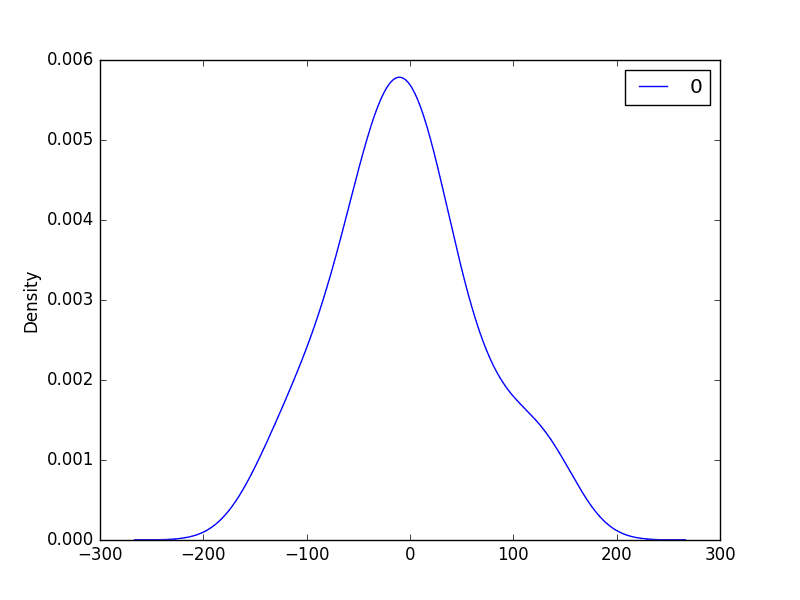
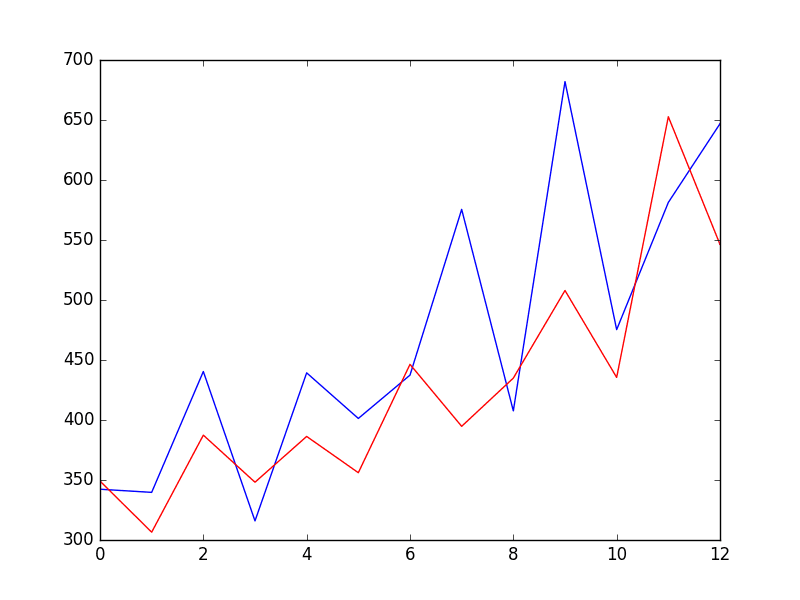


Many thank
You’re welcome.
Hi Jason! Great tutorial.
Just a reeal quick question ..how can I fit and run the last code for multiple varialbles?..the dataset that looks like this:
Date,CO,NO2,O3,PM10,SO2,Temperature
2016-01-01 00:00:00,0.615,0.01966,0.00761,49.92,0.00055,18.1
You can model the target variable alone.
Alternately you can provide the other variables as exog variables, such as SARIMAX.
https://machinelearningmastery.com/time-series-forecasting-methods-in-python-cheat-sheet/
Finally, you could use a neural network:
https://machinelearningmastery.com/start-here/#deep_learning_time_series
Hey,
Nice article, it helped me a lot.
I have a question as to how to make predictions in a scenario where you are attempting to make new predictions not included in the dataset.
For each item in the test set, after a prediction is made, the correct data point, taken from test, is added to the history.
How can I make predictions when I don’t have a test set to extract the right data points from?
Good question, see this tutorial:
https://machinelearningmastery.com/make-sample-forecasts-arima-python/
Hi Jason,
can we apply this for stock or crypto? Can you try develop a code on tradingview platform?
Why not! But caution: doing ARIMA on stock market usually not providing good enough result to invest in it.
have a question am doing a project concerning data analytics insights for retail company sales case study certain supermarket in my area and am proposing to use ARIMA can it be appropriate and how can i apply it
Perhaps start by modeling one product?
Hi Jason! Great Tutorial!!
I have a usecase of timeseries forecasting where I have to predict sales of different products out of the electronics store. There are around 300 types of different products. And I have to predict the sales on the next day for each of the product based on previous one year data. But not every product is being sold each day.
My guess is I have to create a tsa for each product. but the data quality for each product is low as not each product is being sold each day. And my use case is that I have to predict sales of each product.
Any way I can use time series on whole data without using tsa on each product individually?
Good question, I have some suggestions here (replace “sites” with “products”):
https://machinelearningmastery.com/faq/single-faq/how-to-develop-forecast-models-for-multiple-sites
If I want to predict on New values out of the data set how should I do
Hi Grace…The following discussion may be of interest:
https://stats.stackexchange.com/questions/223457/predict-from-estimated-arima-model-with-new-data
Hi I am trying to understand data set related to daily return of a stock. I calculated autocorrelation and partial autocorrelation function as a function of lag. I am observing
that ACF lies within two standard error limits. But I find PACF to be large value at few non-zero lags, one and two. I want to ask you is this behaviour strange ? ACF zero and PACF large and non-zero. If this behaviour not strange, then how does one arrive at the correct order of ARIMA model for this data.
Stock prices are not predictable:
https://machinelearningmastery.com/faq/single-faq/can-you-help-me-with-machine-learning-for-finance-or-the-stock-market
hi. great tutorial.
what’s your advice for finding correlation between two data sets.
I have two csv file, one showing amount of money spent on advertising and one showing amount of sale. and I wanna find out effect of advertisement on sale and forecasting future sale with different amount of advertisement. I know one way is finding correlation with panda like:
sales_df[‘colx’].corr(spend_df[‘coly’])
but I wanna know is there a better way?
It is better if you take the lag of spending into consideration. Advertising affects future sales, not the sales at the time of advertising.
Hi Razi…Review the following and let me know if you have any further questions.
https://machinelearningmastery.com/how-to-use-correlation-to-understand-the-relationship-between-variables/
Hi Jason! Great tutorial.
I got a question that needs your kind help.
For some reason, I need to calculate residuals of a fitted ARMA-GARCH model manually, but found that the calculated residuals are different of those directly from the R package such rugarh. I put the estimated parameters back to the model and use the training data to back out the residuals. How to get the staring residuals at t=0, t=-1 etc. Should I treat the fitted ARMA-GARCH just as an fitted ARMA model? In that case why we need to fit an ARMA-GARCH model to the training data.
Sorry, I’m not familiar wit the “rugarh” package or how it functions.
Hi Jason,
Could you do a GaussianProcess example with the same data. And compare the two- those two methods seem to be applicable to similar problems- I would love to see your insights.
Thanks for the great suggestion. I hope to cover Gaussian Processes in the future.
Thanks. If you also did a comparative study of the two, that would be great- I realize that might be out of the regular, thought I’d still ask. Also can I sign up for email notification?
Thanks.
You can sign-up for notification about all new tutorials here:
https://machinelearningmastery.com/newsletter/
Hi, appreciate your great explanations, awesome! I wonder how will you load a statistics feature-engineered time series dataset/dataframe into ARIMA? Would appreciate if you have example or article. Thanks!
Perhaps as exog variables?
Perhaps try an alternate ml model instead?
Hello,
I have climate change data for the past 8 years and I need to do a regression model using climate as a factor so I need at least climate data for 30 years which I can’t find online. Is it possible to get the previous 22 years climate change using ARIMA based on the last 8 years data.
Thank you
No, that would be way too much data. ARIMA is for small datasets – or at least the python implementation cannot handle much data.
Perhaps explore using a linear regression or other ML methods as a first step.
ARIMA model can be used for any number of observations, yes its performance is more better if one used it for short-term forecasting.
Generally, yes.
Much appreciated, Jason. Keep them coming, please.
Sure thing! I’m glad you’re finding them useful.
What else would you like to see?
Hi Jason ,can you suggest how one can solve time series problem if the target variable is categorical having around 500 categories.
Thanks
That is a lot of categories.
Perhaps moving to a neural network type model with a lot of capacity. You may also require a vast amount of data to learn this problem.
Hi Jason and Utkarsh,
I am also working on a similar dataset which is univariate with a timestamp and a categorical value (around 150 distinct categories). Can we use an ARIMA model for this task?
Not sure if ARIMA supports categorical exog variables.
Perhaps check the documentation?
Perhaps encode the categorical variable and try modeling anyway?
Perhaps try an alternate model?
What if there are multiple columns in dataset. For example: Instead of only 1 items like the shampoo, there could be a column with item numbers ranging from 1 – 20 and a column with number of stores and finally a column with respective sales?
If you have parallel input time series, you can use the other variables as exogenous variables. If you want to predict all variables, you can use VAR.
If you want to support multiple series generally as input, you can use ML methods, this will help as a start:
https://machinelearningmastery.com/convert-time-series-supervised-learning-problem-python/
OMG. Searching for weeks, never found an article like this one. Thank a lot.
I need your advice please,
I need to predict Retail sales data with variables like weather, sales Discount’, holiday etc.
Which is the best model is to use? And why?
How can decide the best fit model?
(Can I use SARIMAX for this?)
Love from Sri Lanka
Sorry for bad English
You’re welcome.
Perhaps test a few diffrent models and discover what works best for your dataset.
But I’m your suggestion tour pointed out, we can’t use arimax for multivariate forecasting.
What is your suggestion??
Any link I could follow to find a solution
Thanks again
Perhaps try some of the techniques listed here:
https://machinelearningmastery.com/start-here/#deep_learning_time_series
Hi Jason,
Recently I am working on time series prediction, but my research is a little bit complicated for me to understand how to fix a time series models to predict future values of multi targets.
Recently I read your post in multi-step and multivariate time series prediction with LSTM. But my problem have a series input values for every time (for each second we have recorded more than 500 samples). We have 22 inputs and 3 targets. All the data has been collected during 600 seconds and then predict 3 targets for 600 next seconds. Please help me how can solve this problem?
It is noticed we have trend and seasonality pulses for targets during the time.
do you find a solution to this problem?
good,Has been paid close attention to your blog.
Thanks!
Gives me loads of errors:
Traceback (most recent call last):
File “/Users/kevinoost/anaconda/lib/python3.5/site-packages/pandas/io/parsers.py”, line 2276, in converter
date_parser(*date_cols), errors=’ignore’)
File “/Users/kevinoost/PycharmProjects/ARIMA/main.py”, line 6, in parser
return datetime.strptime(‘190’+x, ‘%Y-%m’)
TypeError: strptime() argument 1 must be str, not numpy.ndarray
During handling of the above exception, another exception occurred:
Traceback (most recent call last):
File “/Users/kevinoost/anaconda/lib/python3.5/site-packages/pandas/io/parsers.py”, line 2285, in converter
dayfirst=dayfirst),
File “pandas/src/inference.pyx”, line 841, in pandas.lib.try_parse_dates (pandas/lib.c:57884)
File “pandas/src/inference.pyx”, line 838, in pandas.lib.try_parse_dates (pandas/lib.c:57802)
File “/Users/kevinoost/PycharmProjects/ARIMA/main.py”, line 6, in parser
return datetime.strptime(‘190’+x, ‘%Y-%m’)
File “/Users/kevinoost/anaconda/lib/python3.5/_strptime.py”, line 510, in _strptime_datetime
tt, fraction = _strptime(data_string, format)
File “/Users/kevinoost/anaconda/lib/python3.5/_strptime.py”, line 343, in _strptime
(data_string, format))
ValueError: time data ‘190Sales of shampoo over a three year period’ does not match format ‘%Y-%m’
During handling of the above exception, another exception occurred:
Traceback (most recent call last):
File “/Users/kevinoost/PycharmProjects/ARIMA/main.py”, line 8, in
series = read_csv(‘shampoo-sales.csv’, header=0, parse_dates=[0], index_col=0, squeeze=True, date_parser=parser)
File “/Users/kevinoost/anaconda/lib/python3.5/site-packages/pandas/io/parsers.py”, line 562, in parser_f
return _read(filepath_or_buffer, kwds)
File “/Users/kevinoost/anaconda/lib/python3.5/site-packages/pandas/io/parsers.py”, line 325, in _read
return parser.read()
File “/Users/kevinoost/anaconda/lib/python3.5/site-packages/pandas/io/parsers.py”, line 815, in read
ret = self._engine.read(nrows)
File “/Users/kevinoost/anaconda/lib/python3.5/site-packages/pandas/io/parsers.py”, line 1387, in read
index, names = self._make_index(data, alldata, names)
File “/Users/kevinoost/anaconda/lib/python3.5/site-packages/pandas/io/parsers.py”, line 1030, in _make_index
index = self._agg_index(index)
File “/Users/kevinoost/anaconda/lib/python3.5/site-packages/pandas/io/parsers.py”, line 1111, in _agg_index
arr = self._date_conv(arr)
File “/Users/kevinoost/anaconda/lib/python3.5/site-packages/pandas/io/parsers.py”, line 2288, in converter
return generic_parser(date_parser, *date_cols)
File “/Users/kevinoost/anaconda/lib/python3.5/site-packages/pandas/io/date_converters.py”, line 38, in generic_parser
results[i] = parse_func(*args)
File “/Users/kevinoost/PycharmProjects/ARIMA/main.py”, line 6, in parser
return datetime.strptime(‘190’+x, ‘%Y-%m’)
File “/Users/kevinoost/anaconda/lib/python3.5/_strptime.py”, line 510, in _strptime_datetime
tt, fraction = _strptime(data_string, format)
File “/Users/kevinoost/anaconda/lib/python3.5/_strptime.py”, line 343, in _strptime
(data_string, format))
ValueError: time data ‘190Sales of shampoo over a three year period’ does not match format ‘%Y-%m’
Process finished with exit code 1
Help would be much appreciated.
It looks like there might be an issue with your data file.
Open the csv in a text editor and confirm the header line looks sensible.
Also confirm that you have no extra data at the end of the file. Sometimes the datamarket files download with footer data that you need to delete.
Hi Jason,
I’m getting this same error. I checked the data and looks fine. I not sure what else to do, still learning. Please help.
Data
“Month”;”Sales of shampoo over a three year period”
“1-01”;266.0
“1-02”;145.9
“1-03”;183.1
“1-04”;119.3
“1-05”;180.3
“1-06”;168.5
“1-07”;231.8
“1-08”;224.5
“1-09”;192.8
“1-10”;122.9
“1-11”;336.5
“1-12”;185.9
“2-01”;194.3
“2-02”;149.5
“2-03”;210.1
“2-04”;273.3
“2-05”;191.4
“2-06”;287.0
“2-07”;226.0
“2-08”;303.6
“2-09”;289.9
“2-10”;421.6
“2-11”;264.5
“2-12”;342.3
“3-01”;339.7
“3-02”;440.4
“3-03”;315.9
“3-04”;439.3
“3-05”;401.3
“3-06”;437.4
“3-07”;575.5
“3-08”;407.6
“3-09”;682.0
“3-10”;475.3
“3-11”;581.3
“3-12”;646.9
The data you have pasted is separated by semicolons, not commas as expected.
Hi Kevin,
the last line of the data set, at least in the current version that you can download, is the text line “Sales of shampoo over a three year period”. The parser barfs on this because it is not in the specified format for the data lines. Try using the “nrows” parameter in read_csv.
series = read_csv(‘~/Downloads/shampoo-sales.csv’, header=0, nrows=36, parse_dates=[0], index_col=0, squeeze=True, date_parser=parser)
worked for me.
Great tip!
Thanks for your excellent tip
Thanks, had the same problem, worked!
Let say I have a time series data with many attribute. For example a row will have (speed, fuel, tire_pressure), how could we made a model out of this ? the value of each column may affect each other, so we cannot do forecasting on solely 1 column. I google a lot but all the example I’ve found so far only work on time series of 1 attribute.
This is called multivariate time series forecasting. Linear models like ARIMA were not designed for this type of problem.
generally, you can use the lag-based representation of each feature and then apply a standard machine learning algorithm.
I hope to have some tutorials on this soon.
Wanted to check in on this, do you have any tutorials on multivariate time series forecasting?
Also, when you say standard machine learning algorithm, would a random forest model work?
Thanks!
Update: the
statsmodels.tsa.arima_model.ARIMA()function documentation says it takes the optional parameterexog, which is described in the documentation as ‘an optional array of exogenous variables’. This sounds like multivariate analysis to me, would you agree?I am trying to predict number of cases of a mosquito-borne disease, over time, given weather data. So I believe the ARIMA model should work for this, correct?
Thank you!
I have not experimented with this argument.
No multivariate examples at this stage.
Yes, any supervised learning method.
Can tensorflow do the job with multiple attributes.
Hi XiongCat…You may find the following of interest:
https://machinelearningmastery.com/multivariate-time-series-forecasting-lstms-keras/
Hello Ng,
Your problem fits what VAR (Vector Autoregression) models is designed for. See the following links for more information. I hope this helps your work.
https://en.wikipedia.org/wiki/Vector_autoregression
http://statsmodels.sourceforge.net/devel/vector_ar.html
Hi, would you have a example for the seasonal ARIMA post? I have installed latest statsmodels module, but there is an error of import the SARIMAX. Do help if you manage to figure it out. Thanks.
Hi Kelvid, I don’t have one at the moment. I ‘ll prepare an example of SARIMAX and post it soon.
It is so informative..thankyou
I’m glad to hear that Muhammad.
Great post Jason!
I have a couple of questions:
– Just to be sure. model_fit.forecast() is single step ahead forecasts and model_fit.predict() is for multiple step ahead forecasts?
– I am working with a series that seems at least quite similar to the shampoo series (by inspection). When I use predict on the training data, I get this zig-zag pattern in the prediction as well. But for the test data, the prediction is much smoother and seems to saturate at some level. Would you expect this? If not, what could be wrong?
Hi Sebastian,
Yes, forecast() is for one step forecasts. You can do one step forecasts with predict() also, but it is more work.
I would not expect prediction beyond a few time steps to be very accurate, if that is your question?
Thanks for the reply!
Concerning the second question. Yes, you are right the prediction is not very accurate. But moreover, the predicted time series has a totally different frequency content. As I said, it is smooth and not zig-zaggy as the original data. Is this normal or am I doing something wrong. I also tried the multiple step prediction (model_fit.predict()) on the training data and then the forecast seem to have more or less the same frequency content (more zig-zaggy) as the data I am trying to predict.
Hi Sebastian, I see.
In the case of predicting on the training dataset, the model has access to real observations. For example, if you predict the next 5 obs somewhere in the training dataset, it will use obs(t+4) to predict t+5 rather than prediction(t+4).
In the case of predicting beyond the end of the model data, it does not have obs to make predictions (unless you provide them), it only has access to the predictions it made for prior time steps. The result is the errors compound and things go off the rails fast (flat forecast).
Does that make sense/help?
That helped!
Thanks!
Glad to hear it Sebastian.
Hi Jason,
suppose my training set is 1949 to 1961. Can I get the data for 1970 with using Forecast or Predict function
Thanks
Satya
Yes, you would have to predict 10 years worth of data though. The predictions after 10 years would likely have a lot of error.
Hi Jason,
Continuing on this note, how far ahead can you forecast using something like ARIMA or AR or GARCH in Python? I’m guessing most of these utilize some sort of Kalman filter forecasting mechanism?
To give you a sense of my data, given between 60k and 80k data points, how far ahead in terms of number of predictions can we make reliably? Similar to Sebastian, I have pretty jagged predictions in-sample, but essentially as soon as the valid/test area begins, I have no semblance of that behavior and instead just get a pretty flat curve. Let me know what you think. Thanks!
The skill of AR+GARH (or either) really depends on the choice of model parameters and on the specifics of the problem.
Perhaps you can try grid searching different parameters?
Perhaps you can review ACF/PACF plots for your data that may suggest better parameters?
Perhaps you can try non-linear methods?
Perhaps your problem is truly challenging/not predictable?
I hope that helps as a start.
Dear Jason,
One question. I need to perform in-sample one-step forecast using a ARMA model without re-train it. How can I start?
Best regards.
You should look for get_prediction() function, see https://www.statsmodels.org/stable/generated/statsmodels.tsa.arima.model.ARIMAResults.html
So this is building a model and then checking it off of the given data right?
-How can I predict what would come next after the last data point? Am I misunderstanding the code?
Hi Elliot,
You can predict the next data point at the end of the data by training on all of the available data then calling model.forecast().
I have a post on how to make predictions here:
https://machinelearningmastery.com/make-predictions-time-series-forecasting-python/
Does that help?
I tried the model.forecast at the end of the program.
“AttributeError: ‘ARIMA’ object has no attribute ‘forecast'”
Also on your article: https://machinelearningmastery.com/make-predictions-time-series-forecasting-python/
In step 3, when it says “Prediction: 46.755211”, is that meaning after it fit the model on the dataset, it uses the model to predict what would happen next from the dataset, right?
Hi Elliot, the forecast() function is on the ARIMAResults object. You can learn more about it here:
http://statsmodels.sourceforge.net/stable/generated/statsmodels.tsa.arima_model.ARIMAResults.forecast.html
Thanks Jason for this post!
It was really useful. And your blogs are becoming a must read for me because of the applicable and piecemeal nature of your tutorials.
Keep up the good work!
You’re welcome, I’m glad to hear that.
Hi,
This is not the first post on ARIMA, but it is the best so far. Thank you.
I’m glad to hear you say that Kalin.
Hey Jason,
thank you very much for the post, very good written! I have a question: so I used your approach to build the model, but when I try to forecast the data that are out of sample, I commented out the obs = test[t] and change history.append(obs) to history.append(yhat), and I got a flat prediction… so what could be the reason? and how do you actually do the out-of-sample predictions based on the model fitted on train dataset? Thank you very much!
Hi james,
Each loop in the rolling forecast shows you how to make a one-step out of sample forecast.
Train your ARIMA on all available data and call forecast().
If you want to perform a multi-step forecast, indeed, you will need to treat prior forecasts as “observations” and use them for subsequent forecasts. You can do this automatically using the predict() function. Depending on the problem, this approach is often not skillful (e.g. a flat forecast).
Does that help?
Hi Jason,
thank you for you reply! so what could be the reason a flat forecast occurs and how to avoid it?
Hi James,
The model may not have enough information to make a good forecast.
Consider exploring alternate methods that can perform multi-step forecasts in one step – like neural nets or recurrent neural nets.
Hi Jason,
thanks a lot for your information! still need to learn a lot from people like you! 😀 nice day!
I’m here to help James!
when i calculate train and test error , train rmse is greater than test rmse.. why is it so?
I see this happen sometimes Supriya.
It suggests the model may not be well suited for the data.
Hello Jason, thanks for this amazing post.
I was wondering how does the “size” work here. For example lets say i want to forecast only 30 days ahead. I keep getting problems with the degrees of freedom.
Could you please explain this to me.
Thanks
Hi Matias, the “size” in the example is used to split the data into train/test sets for model evaluation using walk forward validation.
You can set this any way you like or evaluate your model different ways.
To forecast 30 days ahead, you are going to need a robust model and enough historic data to evaluate this model effectively.
I get it. Thanks Jason.
I was thinking, in this particular example, ¿will the prediction change if we keep adding data?
Great question Matias.
The amount of history is one variable to test with your model.
Design experiments to test if having more or less history improves performance.
Dear Jason,
Thank you for explaining the ARIMA model in such clear detail.
It helped me to make my own model to get numerical forrcasts and store it in a database.
So nice that we live in an era where knowledge is de-mystified .
I’m glad to here it!
Hi Jason. Very good work!
It would be great to see how forecasting models can be used to detect anomalies in time series. thanks.
Great suggestion, thanks Jacques.
Hi there. Many thanks. I think you need to change the way you parse the datetime to:
datetime.strptime(’19’+x, ‘%Y-%b’)
Many thanks
Are you sure?
See this list of abbreviations:
https://docs.python.org/3/library/datetime.html#strftime-and-strptime-behavior
The “%m” refers to “Month as a zero-padded decimal number.” which is exactly what we have here.
See a sample of the raw data file:
The “%b” refers to “Month as locale’s abbreviated name.” which we do not have here.
Hi Jason,
Lucky i found this at the begining of my project.. Its a great start point and enriching.
Keep it coming :).
This can also be used for non linear time series as well?
Thanks,
niri
Glad to hear it Niirkshith.
Try and see.
Dear Dr Jason,
In the above example of the rolling forecast, you used the rmse of the predicted and the actual value.
Another way of getting the residuals of the model is to get the std devs of the residuals of the fitted model
Question, is the std dev of the residuals the same as the root_mean_squared(actual, predicted)?
Thank you
Anthony of Sydney NSW
what is the difference between measuring the std deviation of the residuals of a fitted model and the rmse of the rolling forecast will
No, they are not the same.
See this post on performance measures:
https://machinelearningmastery.com/time-series-forecasting-performance-measures-with-python/
The RMSE is like the average residual error, but not quite because of the square and square root that makes the result positive.
Hi Jason,
Great writeup, had a query, when u have a seasonal data and do seasonal differencing. i.e for exy(t)=y(t)-y(t-12) for yearly data. What will be the value of d in ARIMA(p,d,q).
typo, ex y(t)=y(t)-y(t-12) for monthly data not yearly
Great question Niirkshith.
ARIMA will not do seasonal differencing (there is a version that will called SARIMA). The d value on ARIMA will be unrelated to the seasonal differencing and will assume the input data is already seasonally adjusted.
Thanks for getting back.
Hi, Jason
thanks for this example. My question how is chosen the parameter q ?
best Ivan
You can use ACF and PACF plots to help choose the values for p and q.
See this post:
https://machinelearningmastery.com/gentle-introduction-autocorrelation-partial-autocorrelation/
Hi Jason, I am wondering if you did a similar tutorial on multi-variate time series forecasting?
Not yet, I am working on some.
Hi Jason,
any updates on the same
Hi Jason,
Nice post.
Can you please suggest how should I resolve this error: LinAlgError: SVD did not converge
I have a univariate time series.
Sounds like the data is not a good fit for the method, it may have all zeros or some other quirk.
Hi Jason,
Thanks for the great post! It was very helpful. I’m currently trying to forecast with the ARIMA model using order (4, 1, 5) and I’m getting an error message “The computed initial MA coefficients are not invertible. You should induce invertibility, choose a different model order, or you can pass your own start_params.” The model works when fitting, but seems to error out when I move to model_fit = model.fit(disp=0). The forecast works well when using your parameters of (0, 1, 5) and I used ACF and PACF plots to find my initial p and q parameters. Any ideas on the cause/fix for the error? Any tips would be much appreciated.
i have the same problem as yours, i use ARIMA with order (5,1,2) and i have been searching for a solution, but still couldn’t find it.
Hi, I have exactly the same problem. Have you already found any solution to that?
Thank you for any information,
Vit
Perhaps try a different model configuration?
Sorry, it is difficult for (3,1,3) as well.
It worked for prediction for the first step of the test data, but gave out the error on the second prediction step.
My code is as follow:
It’s a great blog that you have, but the PACF determines the AR order not the ACF.
Thanks Tom.
I believe ACF and PACF both inform values for q and p:
https://machinelearningmastery.com/gentle-introduction-autocorrelation-partial-autocorrelation/
Good afternoon!
Is there an analog to the function auto.arima in the package for python from the package of the language R.
For automatic selection of ARIMA parameters?
Thank you!
Yes, you can grid search yourself, see how here:
https://machinelearningmastery.com/grid-search-arima-hyperparameters-with-python/
Hi. Great one. Suppose I have multiple airlines data number of passengers for two years recorded on daily basis. Now I want to predict for each airline number of possible passangers on next few months. How can I fit these time series models. Separate model for each airline or one single model?
Try both approaches and double down on what works best.
Hi Jason, if in my dataset, my first column is date (YYYYMMDD) and second column is time (hhmmss) and third column is value at given date and time. So could I use ARIMA model for forecasting such type of time series ?
Yes, use a custom parse function to combine the date and time into one index column.
I have very similar data set. So how to train arima/sarima single model with above kind of data, i.e.. multiple data points at each timestep?
I’m not sure these models can support data of that type.
Perhaps start here:
https://machinelearningmastery.com/start-here/#deep_learning_time_series
Hi Sir, Do you have tutorial about vector auto regression model (for multi-variate time series forecasting?)
Not at the moment.
Thanks a lot, Dr. Jason. This tutorial explained a lot. But I tried to run it on an oil prices data set from Bp and I get the following error:
SVD did not converge
I used (p,d,q) = (5, 1, 0)
Would you please help me on solving or at least understanding this error?
Perhaps consider rescaling your input data and explore other configurations?
Hi Jason,
I have a general question about ARIMA model in the case of multiple Time Series:
suppose you have not only one time series but many (i.e. the power generated per hour at 1000 different wind farms). So you have a dataset of 1000 time series of N points each and you want to predict the next N+M points for each of the time series.
Analyzing each time series separately with the ARIMA could be a waste. Maybe there are similarities in the time evolution of these 1000 different patterns which could help my predictions. What approach would you suggest in this case?
You could not use ARIMA.
For linear models, you could use vector autoregressions (VAR).
For nonlinear methods, I’d recommend a neural network.
I hope that helps as a start.
Hi Jeson, it’s possible to training the ARIMA with more files? Thanks!
Do you mean multiple series?
See VAR:
http://www.statsmodels.org/dev/vector_ar.html
“First, we get a line plot of the residual errors, suggesting that there may still be some trend information not captured by the model.”
So are you looking for a smooth flat line in the curve?
No, the upward trend that appears to exist in the plot of residuals.
At the end of the code, when I tried to print the predictions, it printed as the array, how do I convert it to the data points???
print(predictions)
[array([ 309.59070719]), array([ 388.64159699]), array([ 348.77807261]), array([ 383.60202178]), array([ 360.99214813]), array([ 449.34210105]), array([ 395.44928401]), array([ 434.86484106]), array([ 512.30201612]), array([ 428.59722583]), array([ 625.99359188]), array([ 543.53887362])]
Never mind.. I figured it out…
forecasts = numpy.array(predictions)
[[ 309.59070719]
[ 388.64159699]
[ 348.77807261]
[ 383.60202178]
[ 360.99214813]
[ 449.34210105]
[ 395.44928401]
[ 434.86484106]
[ 512.30201612]
[ 428.59722583]
[ 625.99359188]
[ 543.53887362]]
Keep up the good work Jason.. Your blogs are extremely helpful and easy to follow.. Loads of appreciation..
Glad to hear it.
Hi Jason and thank you for this post, its really helpful!
I have one question regarding ARIMA computation time.
I’m working on a dataset of 10K samples, and I’ve tried rolling and “non rolling” (where coefficients are only estimated once or at least not every new sample) forecasting with ARIMA :
– rolling forecast produces good results but takes a big amount of time (I’m working with an old computer, around 3/6h depending on the ARMA model);
– “non rolling” doesn’t forecast well at all.
Re-estimating the coefficients for each new sample is the only possibility for proper ARIMA forecasting?
Thanks for your help!
I would focus on the approach that gives the best results on your problem and is robust. Don’t get caught up on “proper”.
Dear Respected Sir, I have tried to use ARIMA model for my dataset, some samples of my dataset are following,
YYYYMMDD hhmmss Duration
20100916 130748 18
20100916 131131 99
20100916 131324 214
20100916 131735 72
20100916 135342 37
20100916 144059 250
20100916 150148 87
20100916 150339 0
20100916 150401 180
20100916 154652 248
20100916 183403 0
20100916 210148 0
20100917 71222 179
20100917 73320 0
20100917 81718 25
20100917 93715 15
But when I used ARIMA model for such type of dataset, the prediction was very bad and test MSE was very high as well, My dataset has irregular pattern and autocorrelation is also very low. so could ARIMA model be used for such type of dataset ? or I have to do some modification in my dataset for using ARIMA model?
Looking forward.
Thanks
Perhaps try data transforms?
Perhaps try other algorithms?
Perhaps try gathering more data.
Here are more ideas:
https://machinelearningmastery.com/machine-learning-performance-improvement-cheat-sheet/
Hi Jason,
def parser(x):
return datetime.strptime(‘190’+x, ‘%Y-%m’)
series = read_csv(‘/home/administrator/Downloads/shampoo.csv’, header=0, parse_dates=[0], index_col=0, squeeze=True, date_parser=parser)
print(series.head())
for these lines of code, I’m getting the following error
ValueError: time data ‘190Sales of shampoo over a three year period’ does not match format ‘%Y-%m’
Please help.
Thanks
Check that you have deleted the footer in the raw data file.
Hi Jason
Does ARIMA have any limitations for size of the sample. I have a dataset with 18k rows of data, ARIMA just doesn’t complete.
Thanks
Kushal
Yes, it does not work well with lots of data (linalg methods under the covers blow up) and it can take forever as you see.
You could fit the model using gradient descent, but not with statsmodels, you may need to code it yourself.
Love this. The code is very straightforward and the explanations are nice.
I would like to see a HMM model on here. I have been struggling with a few different packages (pomegranate and hmmlearn) for some time now. would like to see what you can do with it! (particularly a stock market example)
Thanks Olivia, I hope to cover HMMs in the future.
Good evening,
In what I am doing, I have a training set and a test set. In the training set, I am fitting an ARIMA model, let’s say ARIMA(0,1,1) to the training set. What I want to do is use this model and apply it to the test set to get the residuals.
So far I have:
model = ARIMA(data,order = (0,1,1))
model_fit = model.fit(disp=0)
res = model_fit.resid
This gives me the residuals for the training set. So I want to apply the ARIMA model in ‘model’ to the test data.
Is there a function to do this?
Thank you
Hi Ben,
You could use your fit model to make a prediction for the test dataset then compare the predictions vs the real values to calculate the residual errors.
Could you give me an example of the syntax? I understand that idea, but when I would try the results were very poor.
I provide a suite of examples, please search the blog for ARIMA or start here:
https://machinelearningmastery.com/start-here/#timeseries
Hi Jason,
In your example, you append the real data set to the history list- aren’t you supposed to append the prediction?
history.append(obs), where obs is test[t].
in a real example, you don’t have access to the real “future” data. if you were to continue your example with dates beyond the data given in the csv, the results are poor. Can you elaborate?
We are doing walk-forward validation.
In this case, we are assuming that the real ob is made available after the prediction is made and before the next prediction is required.
Hi,
How i do fix following error ?
—————————————————————————
ImportError Traceback (most recent call last)
in ()
6 #fix deprecated – end
7 from pandas import DataFrame
—-> 8 from statsmodels.tsa.arima_model import ARIMA
9
10 def parser(x):
ImportError: No module named ‘statsmodels’
i have already install the statsmodels module.
(py_env) E:\WinPython-64bit-3.5.3.1Qt5_2\virtual_env\scikit-learn>pip3 install –
-upgrade “E:\WinPython\packages\statsmodels-0.8.0-cp35-cp35m-win_amd64.whl”
Processing e:\winpython\packages\statsmodels-0.8.0-cp35-cp35m-win_amd64.whl
Installing collected packages: statsmodels
Successfully installed statsmodels-0.8.0
http://www.lfd.uci.edu/~gohlke/pythonlibs/
problem fixed,
from statsmodels.tsa.arima_model import ARIMA
#this must come after statsmodels.tsa.arima_model, not before
from matplotlib import pyplot
Glad to hear it.
It looks like statsmodels was not installed correctly or is not available in your current environment.
You installed using pip3, are you running a python3 env to run the code?
interestingly, under your Rolling Forecast ARIMA Model explanation, matplotlib was above statsmodels.
from matplotlib import pyplot
from statsmodels.tsa.arima_model import ARIMA
i am using jupyter notebook from WinPython-64bit-3.5.3.1Qt5 to run your examples. i keep getting ImportError: No module named ‘statsmodels’ if i declare import this way in ARIMA with Python explanation
from matplotlib import pyplot
from pandas import DataFrame
from statsmodels.tsa.arima_model import ARIMA
i think it could be i need to restart the virtual environment to let the environment recognize it, today i re-test the following declarations it is ok.
from matplotlib import pyplot
from pandas import DataFrame
from statsmodels.tsa.arima_model import ARIMA
thanks for the replies. case close
Glad to hear it.
You will need to install statsmodels.
Great explanation
can anyone help me to write code in R about forecasting such as (50,52,50,55,57) i need to forecasting the next 3 hour, kindly help me to write code using R with ARIMA and SARIMA Model
thanks in advance
I have a good list of books to help you with ARIMA in R here:
https://machinelearningmastery.com/books-on-time-series-forecasting-with-r/
Dear :sir
i hope all of you fine
could any help me to analysis my data I will pay for him
if u can help me plz contact me fathi_nias@yahoo.com
thanks
Consider hiring someone on upwork.com
Can the ACF be shown using bars so you can look to see where it drops off when estimating order of MA model? Or have you done a tutorial on interpreting ACF/PACF plots please elsewhere?
Yes, consider using the blog search. Here it is:
https://machinelearningmastery.com/gentle-introduction-autocorrelation-partial-autocorrelation/
Hi Jason
I am getting the error when trying to run the code:
from matplotlib import pyplot
from pandas import DataFrame
from pandas.core import datetools
from pandas import read_csv
from statsmodels.tsa.arima_model import ARIMA
series = read_csv(‘sales-of-shampoo-over-a-three-year.csv’, header=0, parse_dates=[0], index_col=0)
# fit model
model = ARIMA(series, order=(0, 0, 0))
model_fit = model.fit(disp=0)
print(model_fit.summary())
# plot residual errors
residuals = DataFrame(model_fit.resid)
residuals.plot()
pyplot.show()
residuals.plot(kind=’kde’)
pyplot.show()
print(residuals.describe())
Error Mesg on Console :
C:\Python36\python.exe C:/Users/aamrit/Desktop/untitled1/am.py
C:/Users/aamrit/Desktop/untitled1/am.py:3: FutureWarning: The pandas.core.datetools module is deprecated and will be removed in a future version. Please use the pandas.tseries module instead.
from pandas.core import datetools
Traceback (most recent call last):
File “C:\Python36\lib\site-packages\pandas\core\tools\datetimes.py”, line 444, in _convert_listlike
values, tz = tslib.datetime_to_datetime64(arg)
File “pandas\_libs\tslib.pyx”, line 1810, in pandas._libs.tslib.datetime_to_datetime64 (pandas\_libs\tslib.c:33275)
TypeError: Unrecognized value type:
During handling of the above exception, another exception occurred:
Traceback (most recent call last):
File “C:\Python36\lib\site-packages\statsmodels\tsa\base\tsa_model.py”, line 56, in _init_dates
dates = to_datetime(dates)
File “C:\Python36\lib\site-packages\pandas\core\tools\datetimes.py”, line 514, in to_datetime
result = _convert_listlike(arg, box, format, name=arg.name)
File “C:\Python36\lib\site-packages\pandas\core\tools\datetimes.py”, line 447, in _convert_listlike
raise e
File “C:\Python36\lib\site-packages\pandas\core\tools\datetimes.py”, line 435, in _convert_listlike
require_iso8601=require_iso8601
File “pandas\_libs\tslib.pyx”, line 2355, in pandas._libs.tslib.array_to_datetime (pandas\_libs\tslib.c:46617)
File “pandas\_libs\tslib.pyx”, line 2538, in pandas._libs.tslib.array_to_datetime (pandas\_libs\tslib.c:45511)
File “pandas\_libs\tslib.pyx”, line 2506, in pandas._libs.tslib.array_to_datetime (pandas\_libs\tslib.c:44978)
File “pandas\_libs\tslib.pyx”, line 2500, in pandas._libs.tslib.array_to_datetime (pandas\_libs\tslib.c:44859)
File “pandas\_libs\tslib.pyx”, line 1517, in pandas._libs.tslib.convert_to_tsobject (pandas\_libs\tslib.c:28598)
File “pandas\_libs\tslib.pyx”, line 1774, in pandas._libs.tslib._check_dts_bounds (pandas\_libs\tslib.c:32752)
pandas._libs.tslib.OutOfBoundsDatetime: Out of bounds nanosecond timestamp: 1-01-01 00:00:00
During handling of the above exception, another exception occurred:
Traceback (most recent call last):
File “C:/Users/aamrit/Desktop/untitled1/am.py”, line 9, in
model = ARIMA(series, order=(0, 0, 0))
File “C:\Python36\lib\site-packages\statsmodels\tsa\arima_model.py”, line 997, in __new__
return ARMA(endog, (p, q), exog, dates, freq, missing)
File “C:\Python36\lib\site-packages\statsmodels\tsa\arima_model.py”, line 452, in __init__
super(ARMA, self).__init__(endog, exog, dates, freq, missing=missing)
File “C:\Python36\lib\site-packages\statsmodels\tsa\base\tsa_model.py”, line 44, in __init__
self._init_dates(dates, freq)
File “C:\Python36\lib\site-packages\statsmodels\tsa\base\tsa_model.py”, line 58, in _init_dates
raise ValueError(“Given a pandas object and the index does ”
ValueError: Given a pandas object and the index does not contain dates
Process finished with exit code 1
Ensure you have removed the footer data from the CSV data file.
Hi Jason
Please help me to resolve the error
I am getting error :
Traceback (most recent call last):
File “C:/Users/aamrit/Desktop/untitled1/am.py”, line 10, in
model_fit = model.fit(disp=0)
File “C:\Python36\lib\site-packages\statsmodels\tsa\arima_model.py”, line 1151, in fit
callback, start_ar_lags, **kwargs)
File “C:\Python36\lib\site-packages\statsmodels\tsa\arima_model.py”, line 956, in fit
start_ar_lags)
File “C:\Python36\lib\site-packages\statsmodels\tsa\arima_model.py”, line 578, in _fit_start_params
start_params = self._fit_start_params_hr(order, start_ar_lags)
File “C:\Python36\lib\site-packages\statsmodels\tsa\arima_model.py”, line 508, in _fit_start_params_hr
endog -= np.dot(exog, ols_params).squeeze()
TypeError: Cannot cast ufunc subtract output from dtype(‘float64’) to dtype(‘int64’) with casting rule ‘same_kind’
Code :
import pandas as pd
import numpy as np
import matplotlib.pylab as plt
from datetime import datetime
from statsmodels.tsa.arima_model import ARIMA
data = pd.read_csv(‘AirPassengers.csv’, header=0, parse_dates=[0], index_col=0)
model = ARIMA(data, order=(1,1,0),exog=None, dates=None, freq=None, missing=’none’)
model_fit = model.fit(disp=0)
print(model_fit.summary())
Sorry, I have not seen this error before, consider posting to stack overflow.
It is a bug in statsmodels. You should convert the integer values in ‘data’ to float first (e.g., by using np.float()).
Great tip.
@kyci is correct as you can check in https://github.com/statsmodels/statsmodels/issues/3504.
I was following this tutorial for my dataset, and what fixed my problem was just converting to float, like this:
X = series.values
X = X.astype(‘float32’)
How can I add multiple EXOG variales in the model?
Jason, I am able to implement the model but the results are very vague for the predicted….
how to find the exact values for p,d and q ?
My best advice is to use a grid search for those parameters:
https://machinelearningmastery.com/grid-search-arima-hyperparameters-with-python/
Thanks a lot Jason…. if value of d=0 then we should not bother about using differncing methods ?
It depends.
The d only does a 1-step difference. You may still want to perform a seasonal difference.
Jason, Can I get a link to understand it in a better way ? I am a bit confused on this.
You can get started with time series here:
https://machinelearningmastery.com/start-here/#timeseries
Hi Jason
I am trying to predict values for the future. I am facing issue.
My data is till 31st July and I want to have prediction of 20 days…..
My Date format in excel file for the model is 4/22/17 –MM-DD-YY
output = model_fit.predict(start=’2017-01-08′,end=’2017-20-08′)
Error :
Traceback (most recent call last):
File “C:/untitled1/prediction_new.py”, line 31, in
output = model_fit.predict(start=’2017-01-08′,end=’2017-20-08′)
File “C:\Python36\lib\site-packages\statsmodels\base\wrapper.py”, line 95, in wrapper
obj = data.wrap_output(func(results, *args, **kwargs), how)
File “C:\Python36\lib\site-packages\statsmodels\tsa\arima_model.py”, line 1492, in predict
return self.model.predict(self.params, start, end, exog, dynamic)
File “C:\Python36\lib\site-packages\statsmodels\tsa\arima_model.py”, line 733, in predict
start = self._get_predict_start(start, dynamic)
File “C:\Python36\lib\site-packages\statsmodels\tsa\arima_model.py”, line 668, in _get_predict_start
method)
File “C:\Python36\lib\site-packages\statsmodels\tsa\arima_model.py”, line 375, in _validate
start = _index_date(start, dates)
File “C:\Python36\lib\site-packages\statsmodels\tsa\base\datetools.py”, line 52, in _index_date
date = dates.get_loc(date)
AttributeError: ‘NoneType’ object has no attribute ‘get_loc’
Can you please help ?
Sorry, I’m not sure about the cause of this error. Perhaps try predicting one day and go from there?
Not working … can you please help ?
Hi Sir
Please help me to resolve this error
from pandas import read_csv
from pandas import datetime
from matplotlib import pyplot
def parser(x):
return datetime.strptime(‘190’+x, ‘%Y-%m’)
series = read_csv(‘E:/data/csv/shampoo-sales.csv’, header=0, parse_dates=[0], index_col=0, squeeze=True, date_parser=parser)
print(series.head())
series.plot()
pyplot.show()
ERROR is
runfile(‘C:/Users/kashi/Desktop/prog/Date_time.py’, wdir=’C:/Users/kashi/Desktop/prog’)
Traceback (most recent call last):
File “”, line 1, in
runfile(‘C:/Users/kashi/Desktop/prog/Date_time.py’, wdir=’C:/Users/kashi/Desktop/prog’)
File “C:\Users\kashi\Anaconda3\lib\site-packages\spyder\utils\site\sitecustomize.py”, line 866, in runfile
execfile(filename, namespace)
File “C:\Users\kashi\Anaconda3\lib\site-packages\spyder\utils\site\sitecustomize.py”, line 102, in execfile
exec(compile(f.read(), filename, ‘exec’), namespace)
File “C:/Users/kashi/Desktop/prog/Date_time.py”, line 10, in
series = read_csv(‘E:/data/csv/shampoo-sales.csv’, header=0, parse_dates=[0], index_col=0, squeeze=True, date_parser=parser)
File “C:\Users\kashi\Anaconda3\lib\site-packages\pandas\io\parsers.py”, line 562, in parser_f
return _read(filepath_or_buffer, kwds)
File “C:\Users\kashi\Anaconda3\lib\site-packages\pandas\io\parsers.py”, line 325, in _read
return parser.read()
File “C:\Users\kashi\Anaconda3\lib\site-packages\pandas\io\parsers.py”, line 815, in read
ret = self._engine.read(nrows)
File “C:\Users\kashi\Anaconda3\lib\site-packages\pandas\io\parsers.py”, line 1387, in read
index, names = self._make_index(data, alldata, names)
File “C:\Users\kashi\Anaconda3\lib\site-packages\pandas\io\parsers.py”, line 1030, in _make_index
index = self._agg_index(index)
File “C:\Users\kashi\Anaconda3\lib\site-packages\pandas\io\parsers.py”, line 1111, in _agg_index
arr = self._date_conv(arr)
File “C:\Users\kashi\Anaconda3\lib\site-packages\pandas\io\parsers.py”, line 2288, in converter
return generic_parser(date_parser, *date_cols)
File “C:\Users\kashi\Anaconda3\lib\site-packages\pandas\io\date_converters.py”, line 38, in generic_parser
results[i] = parse_func(*args)
File “C:/Users/kashi/Desktop/prog/Date_time.py”, line 8, in parser
return datetime.strptime(‘190’+x, ‘%Y-%m’)
File “C:\Users\kashi\Anaconda3\lib\_strptime.py”, line 510, in _strptime_datetime
tt, fraction = _strptime(data_string, format)
File “C:\Users\kashi\Anaconda3\lib\_strptime.py”, line 343, in _strptime
(data_string, format))
ValueError: time data ‘1901-Jan’ does not match format ‘%Y-%m’
I have already removed the footer note from the dataset and I also open dataset in text editor. But I couldn’t remove this error. But when I comment ”date_parser=parser” my code runs but doesn’t show years,
How to resolve it?
Thanks
Perhaps %m should be %b?
Getting this problem:
File “/shampoo.py”, line 6, in parser
return datetime.strptime(‘190’+x, ‘%Y-%m’)
TypeError: ufunc ‘add’ did not contain a loop with signature matching types dtype(‘<U32') dtype('<U32') dtype('<U32')
I've tried '%Y-%b' but that only gives me the "does not match format" error.
Any ideas?
/ Thanks
Hi Alex, sorry to hear that.
Confirm that you downloaded the CSV version of the dataset and that you have deleted the footer information from the file.
Hey,
I got it to work right after I wrote the post…
The header in the .csv was written as “Month,””Sales” and that caused the error, so I just changed it to “month”, “sales” and it worked.
Thanks for putting in the effort to follow up on posts!
Glad to hear that Alec!
Hey,
I’ve two years monthly data of different products and their sales at different stores. How can I perform Time series forecasting on each product at each location?
Thanks in advance.
You could explore modeling products separately, stores separately, and try models that combine the data. See what works best.
Hey Jason,
You mentioned that since the residuals doesn’t have mean = 0, there is a bias. I have same situation. But the spread of the residuals is in the order of 10^5. So i thought it is okay to have non-zero mean. Your thoughts please?
Btw my mean is ~400
For those who came with an error of ValueError: time data ‘1901-Jan’ does not match format ‘%Y-%m’
please replace the month column with following:
Month
1-1
1-2
1-3
1-4
1-5
1-6
1-7
1-8
1-9
1-10
1-11
1-12
2-1
2-2
2-3
2-4
2-5
2-6
2-7
2-8
2-9
2-10
2-11
2-12
3-1
3-2
3-3
3-4
3-5
3-6
3-7
3-8
3-9
3-10
3-11
3-12
Dear Jason,
Firstly, I would like to thanks about your sharing
Secondly, I have a small question about ARIMA with Python. I have about 700 variables need to be forecasted with ARIMA model. How Python supports this issuse Jason
For example, I have data of total orders in a country, and it will be contributte to each districts
So I need to forecast for each districts (about 700 districts)
Thanks you so much
Generally, ARIMA only supports univariate time series, you may need to use another method.
That is a lot of variables, perhaps you could explore a multilayer perceptron model?
The result of model_fit.forecast() is like (array([ 242.03176448]), array([ 91.37721802]), array([[ 62.93570815, 421.12782081]])). The first number is yhat, can you explain what the other number means in the result? thank you!
It may be the confidence interval:
https://machinelearningmastery.com/time-series-forecast-uncertainty-using-confidence-intervals-python/
Great blogpost Jason!
Had a follow up question on the same topic.
Is it possible to do the forecast with the ARIMA model at a higher frequency than the training dataset?
For instance, let’s say the training dataset is sampled at 15min interval and after building the model, can I forecast at 1second level intervals?
If not directly as is, any ideas on what approaches can be taken? One approach I am entertaining is creating a Kernel Density Estimator and sampling it to create higher frequency samples on top of the forecasts.
Thanks, much appreciate your help!
Hmm, it might not be the best tool. You might need something like a neural net so that you can design a one-to-many mapping function for data points over time.
Hi Jason,
Your tutorial was really helpful to understand the concept of solving time series forecasting problem. But I have small doubt regarding the steps you followed at the very end. I’m pasting your code down below-
X = series.values
size = int(len(X) * 0.66)
train, test = X[0:size], X[size:len(X)]
history = [x for x in train]
predictions = list()
for t in range(len(test)):
model = ARIMA(history, order=(5,1,0))
model_fit = model.fit(disp=0)
output = model_fit.forecast()
yhat = output[0]
predictions.append(yhat)
obs = test[t]
history.append(obs)
print(‘predicted=%f, expected=%f’ % (yhat, obs))
error = mean_squared_error(test, predictions)
Note:1) here in the above for each iteration you’re adding the elements from the “test” and the forecasted value because in real forecasting we don’t have future data to include in test, isn’t it? Or is it that your’re trying to explain something and I’m not getting it.
2) Second doubt, aren’t you suppose to perform “reverse difference” for that you have used first order differencing in the model?
Kindly, please clear my doubt
Note: I have also went through one of your other tutorial where you have forecasted the average daily temperature in Australia.
https://machinelearningmastery.com/make-sample-forecasts-arima-python/
here the steps you followed were convincing, also you have performed “inverse difference” step to scale the prediction to original scale.
I have followed the steps from the one above but I m unable to forecast correctly.
In this case, we are assuming the real observation is available after prediction. This is often the case, but perhaps over days, weeks, months, etc.
The differencing and reverse differencing were performed by the ARIMA model itself.
Hi Jason,
Recently I am working on time series prediction, but my research is a little bit complicated for me to understand how to fix a time series models to predict future values of multi targets.
Recently I read your post in multi-step and multivariate time series prediction with LSTM. But my problem have a series input values for every time (for each second we have recorded more than 500 samples). We have 22 inputs and 3 targets. All the data has been collected during 600 seconds and then predict 3 targets for 600 next seconds. Please help me how can solve this problem?
It is noticed we have trend and seasonality pulses for targets during the time.
Perhaps here would be a good place to start:
https://machinelearningmastery.com/start-here/#timeseries
Hey just a quick check with you regarding the prediction part. I need to do some forecast of future profit based on the data from past profit. Let’s say I got the data for the past 3 years, and then I wanted to perform a forecast on the next 12 months in next year. Does the model above applicable in this case?
Thanks!
This post will help you make predictions that are out of sample:
https://machinelearningmastery.com/make-sample-forecasts-arima-python/
Hey Jason thanks so much for the clarification! But just to clarify, when I run the example above, my inputs are the past records for the past 3 years grouped by month. Then, how the code actually plot out the forecasted graph is basically takes in those input and plot, am I right? So, can I assumed that the graph that plotted out is meant for the prediction of next year?
I don’t follow, sorry. You can plot anything you wish.
Sorry but what does the expected and predicted means actually?
The expected value is the real observation from your dataset. The predicted value is the value predicted by your model.
Also, why the prediction has 13 points (start from 0 to 12) when each year only have 12 months? Looking forward to hear from you soon and thanks!
I arbitrarily chose to make predictions for 33% of the data which turned out to be 13 months.
You’re right, it would have been clearer if I only predicted the final year.
Hey Jason, thanks so much for the replies! But just to check with you, which line of the code should I modify so that it will only predict for the next 12 months instead of 13?
Also, just to be sure, if I were to predict for the profit for next year, the value that I should take should be the predicted rather than expected, am I right?
Thanks!!
Sorry, I cannot prepare a code example for you, the URLs I have provided show you exactly what to do.
Hey Jason, thanks so much but I am still confused as I am new to data analytic. The model above aims to make a prediction on what you already have or trying to forecast on what you do not have?
Also, may I check with you on how it works? Because I downloaded the sample dataset and the dataset contains the values of past 3 years grouped by months. So, can I assume the prediction takes all the values from past years into account in order to calculate for the prediction value? Or it simply takes the most recent one and calculate for the prediction?
Thanks!
Hey Jason, I am so sorry for the spams. But just a quick check with you again, let’s say I have some zero value for the profit, will it break the forecast function? Or the forecast function must take in all non-zero value. Because sometimes I am getting “numpy.linalg.linalg.LinAlgError: SVD did not converge” error message and I not sure if it is the zero values that is causing the problem. 🙂
Good question, it might depend on the model.
Perhaps spot check some values and see how the model behaves?
May I know what kind of situation will cause the error above? Is it because of drastic up and down from 3 different dataset?
Hi Jason,
Thanks for this post. I am getting following error while running the very first code:
ValueError: time data ‘1901-Jan’ does not match format ‘%Y-%m’
Ensure your data is in CSV format and that the footer was removed.
Hi Jason, thanks so much for the share! The tutorial was good! However, when I am using my own data set, I am getting the same error message as one of the guy above. The error message is ‘numpy.linalg.linalg.LinAlgError: SVD did not converge’.
I tried to crack my head out trying to observe the data sets that caused the error message but I could not figure out anything. I tried with 0 value and very very very drastic drop or increase in the data, some seems okay but at some point, some data set will just fail and return the error message.
May I know what kind of data or condition will trigger the error above so I can take extra precaution when preparing the data?
Perhaps try manually differencing the data first?
Perhaps there are a lot of 0 values in your data that the model does not like?
I tried with multiple set of data without a single zero. I realized a problem but I not sure if my observation is correct as I am still trying to figure out how the code above works, for that part I might need your enlightenment.
Let’s say the data is 1000, 100, 10000 respectively to first, second and third year. This kind of data will throw out the error message above. So can I assume that, as long as there is a big drastic drop/increase in the data set, in this case from 100 to 10000, this kind of condition will execute with error?
Sorry Denise, I’m not sure I follow.
Hey Denise, i got the same issue. did you get any solution for this problem??
Hi Jason,
Thank you for the tutorial, it’s great! I have a question about stationarity and differencing. If time series is non stationary but is made stationary with simple differencing, are you required to have d=1 in your selected model? Can I choose a Model with no differencing for this data if it gives me a better root mean square error and there is no evidence of autocorrelation?
Yes, you can let the ARIMA difference or perform it yourself.
But ARIMA will do it automatically for you which might be easier.
@Jason, This article has helped me a lot for the training set predictions which i had managed to do earlier too, but could you help me with the future forecasting, let say your date data is till 10th November, 2017 and i want to predict the values for the next one week or next 3 days..
If we get help for this, that would be amazing 🙂
See this post on how to make predictions:
https://machinelearningmastery.com/make-sample-forecasts-arima-python/
@Jason,
For future predictions, let say i have data till 10th November, and based on your analysis as shown above, can you help me with the future predictions for a week or so, need an idea of how to predict future data..
Yes, see this post:
https://machinelearningmastery.com/make-sample-forecasts-arima-python/
Great post Jason!
I have a question:
– We need to ensure that the residuals of our model are uncorrelated and normally distributed with zero mean.
What if the residuals are not normally distributed?
It would be very grateful if you could explain how to approach in such scenario.
Thanks
Shariq
It may mean that you could improve your model with some data transform, perhaps something like a boxcox?
@Jason, What if we don’t want Rolling forecast, which means, my forecast should only be based on the training data, and it should predict the test data..
I am using the below code:
X = ts.values
size = int(len(X) * 0.75)
train, test = X[0:size], X[size:len(X)]
model = ARIMA(train, order=(4, 1, 2))
results_AR = model.fit(disp=0)
preds=results_AR.predict(size+1,size+16)
pyplot.plot(test[0:17])
pyplot.plot(preds, color=’red’)
pyplot.show()
This prediction is giving me really bad results, need urgent help on this.
This is called a multi-step forecast and it is very challenging. You may need a different model.
More here:
https://machinelearningmastery.com/multi-step-time-series-forecasting/
Hi Jason, I have two questions.
1. Let’s say I want to estimate an AR model like this: x(t)=a*x(t-2) + e. If I use ARIMA(2,0,0), it will add the term x(t-1) as well, which I don’t want. In SAS I would use p=(2) on the estimate statement of proc arima rather than p=2.
2. How do I incorporate covariates? For example, a simple model like this: x(t)=a*x(t-2) + b*f(t) + e, where f(t) e.g. is 1 if it’s the month of January and 0 otherwise.
Thanks.
Re the first question, it’s good. I don’t know how to do this with statsmodels off the cuff, some google searchers are needed.
Re multivariates, you may need to use ARIMAX or SARIMAX or similar method.
Hi,
I am getting the following error when loading the series dataframe in python
“ValueError: time data ‘190Sales of shampoo over a three year period’ does not match format ‘%Y-%m'”
Ive just copy pasted the code from this website but its not working. Any suggestions? Im using Sypder
Ensure you remove the footer from the data file.
Hi, may I know what are the yhat, obs and error variable are for? As for the error, is it better with greater value or the other way around? Thanks!
yhat are the predictions. obs are the observations or the actual real data.
Thanks! Then what about the MSE? Is it the greater the better or the other way around?
A smaller error is better.
Could you please have a blog on Anomaly detection using timeseries data, may be from the above example itself.
Thanks for the suggestion.
hey sir , thanks for that , Is ARIMA good for predictions of currencies exchange rate or not ?
I don’t know about currency exchange problems sorry. Try it and see.
Hello,
Is it possible to predict hourly temperature for upcoming 5 years based on hourly temperature data of last 5 years ?
I am trying this out with ARIMA model, its giving me vrey bad output ( attenuating curve ).
You could model that, but I expect the skill to be very poor. The further in the future you want to predict, the worse the skill.
if the time series corresponds to brownian motion time series generated with different Hurst value (let’s say H1 = 0.6 and H2 = 0.7), is this model a good fit to classify if it is H1 or H2?
Hi Jason,
I have followed all of your posts related to Time Series to do my first data science project. I have done the parameter optimization also. The same code is working in my laptop but when i ran in Kaggle it shows “The computed initial AR coefficients are not stationary
You should induce stationarity, choose a different model order, or you can
pass your own start_params”. The python version is same in my environment and in Kaggle. Is this common?
Sorry, I don’t know about “running code in kaggle”.
I get the same error when I run the code in my local PC. Not for every p and q though, but for higher values.
Perhaps try using a “d” term to make the data stationary.
Hello, may I know what is the purpose for these two lines?
size = int(len(X) * 0.66)
train, test = X[0:size], X[size:len(X)]
Thanks!
Also, just to double confirm with you on my understanding, basically what the algorithm does is, take in all input in csv and fit into model, perform a forecast, append the forecast value into the model, then go thru the for loop again to recreate a new ARIMA model, forecast then append new forecast value, then go thru the for loop again?
In addition, the next row prediction is always depends on the past prediction values?
Yes, I believe so. Note, this is just one framing of the problem.
To split the dataset into train and test sets.
Is there a specific reason for you to multiply with 0.66? Thanks!
No reason, just an arbitrarily chosen 66%/37% split of the data.
I need to forecasting the next x hour. How can i do this?
This post might help:
https://machinelearningmastery.com/make-sample-forecasts-arima-python/
Thanks Jason for making it simple. I run the program but getting error
1st error :
TypeError: Cannot cast ufunc subtract output from dtype(‘float64’) to dtype(‘int64’) with casting rule ‘same_kind’
After changing code , i got 2nd error
model = ARIMA(series.astype(float), order=(5,1,0))
I m getting following error
LinAlgError: SVD did not converge
Looks like the data might have some issues. Perhaps calculate some summary stats, visualizations and look at the raw data to see if there is anything obvious.
Thanks Jason for the quick response. Now i tried for Sampoo dataset, getting following error :
ValueError: time data ‘1901-Jan’ does not match format ‘%d-%m’
Code :
def parser(x): return datetime.strptime(‘190’+x, ‘%d-%m’)
series = read_csv(‘shampoo-sales.csv’, header=0, parse_dates=[0], index_col=0, squeeze=True, date_parser=parser)
print(series.head())
series.plot()
pyplot.show()
Perhaps your data contains the footer. Here is a clean version of the data ready to go:
https://raw.githubusercontent.com/jbrownlee/Datasets/master/shampoo.csv
When we use a recursive model for ARIMA, let say like saw in one of your examples:
Why my final test vs predicted graph is coming as if, the predictions are following the test values, it’s like if test is following a pattern, predictions is following similar pattern, hence ultimately our ARIMA predictions isn’t working properly, i hope you got my point.
For example: if test[0] keeps increasing till test[5] and decreases, then prediction[1] keeps increasing till predictions[5] and decreases..
It suggests the model is not skilful and is acting like a persistence model.
It may also be possible that persistence is the best that can be achieved on your problem.
Does that mean, ARIMA isn’t giving good results for my problem?
What are different ways of solving this problem by ARIMA, can differencing or Log approach be a good solution?
You can use ACF/PACF plots to help choose ARIMA parameters, or you can grid search ARIMA parametres on your test set.
Hello! Thank you for this great tutorial. It’d be a great help if you guide me through one of my problems.
I want to implement a machine learning model to predict(forecast) points scored by each player in the upcoming game week.
Say I have values for a player (Lukaku) for 28 game weeks and I train my model based on some selected features for those 28 weeks. How do I predict the outcome of the 29th week?
I am trying to predict total points to be scored by every player for the coming game week.
So basically what should be the input to my model for 29th game week? Since the game assigns points as per live football games happening during the week, I wont have any input data for 29th week.
Thank you 🙂
I would recommend looking into rating systems:
https://en.wikipedia.org/wiki/Elo_rating_system
Hi Jason,
Great tutorial once again!
I have a question on your Rolling Forecast ARIMA model.
When your are appending obs (test(t)) on each step to history, aren’t we getting data leakage?
The test set is supposed to be unseen data, right? Or are you using the test set as a validation set?
In this case no, we are assuming the real observation is available at the end of each iteration.
You can change the assumptions and therefore the test setup if you like.
oh I see, i misunderstood this assumption, sorry. But how can I predict multiple steps? I used the predict() method from ARIMA model but the results were weird.
Yes, you can use the predict() function. Performance may be poor as predicting multiple steps into the future is very challenging.
Hi,
In case we try to introduce more than one input, then how can fit the model and make prediction?
Thanks
We don’t fit one point, we fit a series of points.
Hi Jason,
Very nice introduction! Thank you very much for always bringing us excellent ML knowledge.
Can you further explain why you chose (p,d,q) = (5,1,0)? Or you did gird search (which you show in other blogs) using training/test sets to find minimum msg appears at (5,1,0)? Did you know any good reference for diagnostic plots for the hyper-parameters grid searching?
Meanwhile, I am interested in both time-series book and LSTM book. If I purchased both, any further deal?
I recommend using both a PACF/ACF interpretation and grid searching approaches. I have tutorials on both.
Sorry, I cannot create custom bundles of books, you can see the full catalog here:
https://machinelearningmastery.com/products
Hi Jason,
Thank you for your answer. I have purchased time series book.
I still have few more questions on ARIMA model:
(1) The shampoo sale data obviously shows non-stationary; strictly speaking, we should transform data until it becomes stationary data by taking logarithm and differencing (Box-Cox transformation), and then apply to ARIMA model. Is it correct?
(2) Does the time series data with first-order differencing on ARIMA (p,0,q) give the similar results to the time series data without differencing on ARIMA(p,1,q)? i.e. d = 1 in ARIMA(p,d,q)
equivalently process data with first-order difference?
(3) In this example, we chose ARIMA (5,1,0) and p=5 came from the autocorrelation plot. However, what I read from the book https://www.otexts.org/fpp/8/5 said to judge value of p, we should check PACF plot, instead ACF. Are there any things I missed or misunderstood?
The shampoo data is non stationary and should be differenced, this can happen before modeling or as part of the ARIMA.
No, 0 and 1 for d mean no differencing and first order differencing respectively.
Yes, you can check ACF and PACF for configuring the p and q variables, see this post:
https://machinelearningmastery.com/gentle-introduction-autocorrelation-partial-autocorrelation/
Hi Jason,
In your code you use :
yhat=output[0]
So you take the first element of output, what are the other elements of output represent?
Thank you
You can see all of the returned elements here:
http://www.statsmodels.org/dev/generated/statsmodels.tsa.arima_model.ARMAResults.forecast.html
I am also trying to figure out what the other elements of output represent but Jason the link you provided does not work. Could you provide a fresh link?
See here:
https://www.statsmodels.org/stable/generated/statsmodels.tsa.arima_model.ARMAResults.forecast.html#statsmodels.tsa.arima_model.ARMAResults.forecast
Thank you for your efforts … i have question
i’m using the following code as mentioned above
def parser(x):
return datetime.strptime(‘190’ +x, ‘%Y-%m’)
but the error appears :
ValueError: time data ‘1902-Jan’ does not match format ‘%Y-%m’
could you please help me ….
It looks like you downloaded the dataset in a different format.
You can get the correct dataset here:
https://raw.githubusercontent.com/jbrownlee/Datasets/master/shampoo.csv
Hey Jason,
Best article I have ever seen. Currently I am working on data driven time series forecasting with PYTHON by ARIMA model. I have data of appliance energy which depends on 26 variables over period of 4 months. My question is how can I use 26 variables to forecast the future value?
Thanks.
Sorry, I don’t have an example of ARIMA with multiple input variables.
Hello Jason,
Thanks for your reply.
Can I solve my problem with ARIMA model?
Perhaps a variant that supports multiple series.
Hey Jason, I am new to data analytics. From the chart, may I know how you determined it is stationary or non-stationary as well as how do you see whether it has a lagged value?
Thanks!
Yes, you can learn more about ACF and PACF and their interpretation here:
https://machinelearningmastery.com/gentle-introduction-autocorrelation-partial-autocorrelation/
Hello Jason,
can Autoregression model be used for forecasting stock price ?
Yes, but it will likely do worse than a persistence model.
Learn more here:
https://machinelearningmastery.com/gentle-introduction-random-walk-times-series-forecasting-python/
Hello! I think you may have made a mistake in the following paragraph.
“If we used 100 observations in the training dataset to fit the model, then the index of the next time step for making a prediction would be specified to the prediction function as start=101, end=101. This would return an array with one element containing the prediction.”
Since python is zero-indexed, the index of the next time step for making a prediction should be 100, I think.
Not in this case. Try it and see.
Hello Jason!
I’m stuck at this error when i execute these lines of code:
from pandas import read_csv
from pandas import datetime
from matplotlib import pyplot
def parser(x):
return datetime.strptime(‘190’+x, ‘%Y-%m’)
series = read_csv(‘shampoo_time_series.csv’, header=0, parse_dates=[0], index_col=0, squeeze=True, date_parser=parser)
print(series.head())
series.plot()
pyplot.show().
Error:-
time data ‘19001-Jan’ does not match format ‘%Y-%m’
Perhaps you downloaded a different version of the dataset. Here is a direct link:
https://raw.githubusercontent.com/jbrownlee/Datasets/master/shampoo.csv
Does that help?
hi dear,
can ask you please what is the meaning of the arrow that cant be copied, thank you.
Sorry, what arrow?
Hi Jason,
great tutorial, as always! Thank you very much for providing your excellent knowledge to the vast community! You really helped me to get a better understanding of this ARIMA type of models.
Do you plan to make a tutorial on nonlinear time-series models such as SETAR? Would be great, because I could not really find anything in this region.
Thanks for the suggestion.
I do hope to cover more methods for nonlinear time series in the future.
Hi Jason
I tried the code with my data. ACF, PACF plots aren’t showing me any significant correlations. Is there anything by which I can still try the forecast? What should be one’s steps on encounter of such data?
Perhaps try a grid search on ARIMA parameters and see what comes up?
Hi Jason,
Is it possible to make a forecast with xgboost for a time series data with categorical variables?
Yes.
Hello Jason, I have been following your articles and it has been very helpful.
I am running the same code above and get following error:
ValueError Traceback (most recent call last)
in ()
7 pred=list()
8 for i in range(len(test)):
—-> 9 model=ARIMA(history,order=(5,1,0))
10 model_fit=model.fit(disp=0)
11 output=model_fit.forecast()
~\AppData\Local\Continuum\anaconda3\lib\site-packages\statsmodels\tsa\arima_model.py in __new__(cls, endog, order, exog, dates, freq, missing)
998 else:
999 mod = super(ARIMA, cls).__new__(cls)
-> 1000 mod.__init__(endog, order, exog, dates, freq, missing)
1001 return mod
1002
~\AppData\Local\Continuum\anaconda3\lib\site-packages\statsmodels\tsa\arima_model.py in __init__(self, endog, order, exog, dates, freq, missing)
1013 # in the predict method
1014 raise ValueError(“d > 2 is not supported”)
-> 1015 super(ARIMA, self).__init__(endog, (p, q), exog, dates, freq, missing)
1016 self.k_diff = d
1017 self._first_unintegrate = unintegrate_levels(self.endog[:d], d)
~\AppData\Local\Continuum\anaconda3\lib\site-packages\statsmodels\tsa\arima_model.py in __init__(self, endog, order, exog, dates, freq, missing)
452 super(ARMA, self).__init__(endog, exog, dates, freq, missing=missing)
453 exog = self.data.exog # get it after it’s gone through processing
–> 454 _check_estimable(len(self.endog), sum(order))
455 self.k_ar = k_ar = order[0]
456 self.k_ma = k_ma = order[1]
~\AppData\Local\Continuum\anaconda3\lib\site-packages\statsmodels\tsa\arima_model.py in _check_estimable(nobs, n_params)
438 def _check_estimable(nobs, n_params):
439 if nobs 440 raise ValueError(“Insufficient degrees of freedom to estimate”)
441
442
ValueError: Insufficient degrees of freedom to estimate
the code used
from sklearn.metrics import mean_squared_error
size = int(len(df) * 0.66)
train,test=df[0:size],df[size:len(df)]
print(train.shape)
print(test.shape)
history=[x for x in train]
pred=list()
for i in range(len(test)):
model=ARIMA(history,order=(5,1,0))
model_fit=model.fit(disp=0)
output=model_fit.forecast()
yhat=output[0]
pred.append(yhat)
obs=test[i]
history.append(obs)
print(‘predicted = %f,expected = %f’,(yhat,obs))
error=mean_squared_error(test,pred)
print(‘Test MSE: %.3f’ % error)
plt.plot(test)
plt.plot(pred,color=’red’)
plt.show()
On;ly change I have made in code is date index. I have done something like this for dates
dt=pd.date_range(“2015-01-01”, “2017-12-1″, freq=”MS”)
Can you explain what is wrong?
also,
I was under impression that you use auto_corr function to determine Q parameter in ARIMA model. then in your code when you call ARIMA why have you used (5,1,0) assuming it is (p,d,q)? i thought it was suppose to be (0,1,5)?
I have more on the ACF/PACF plots and how to interpret them here:
https://machinelearningmastery.com/gentle-introduction-autocorrelation-partial-autocorrelation/
Hello Jason, I posted a problem earlier today that I have successfully resolved. thanks for your help.
Glad to hear it.
Hello Jason,
Thanks for the helpful article.
My question is :
“A rolling forecast is required given the dependence on observations in prior time steps for differencing and the AR model.”
can you please elaborate?
How do we decide when to use Rolling forecast and when not to use rolling forecast?
what are the factors do you consider?
Thanks
I believe I mean a walk-forward validation. More here:
https://machinelearningmastery.com/backtest-machine-learning-models-time-series-forecasting/
Hello,
My company is supermaket , which have 30 stores and over 2000 products. My boss want me to predict each product sale number in next 7 days.
I think below features would affect sales count much
1. a day is festival
2. a day is weekend
3. a day’s weather
4. a day is coupon day
But I don’t know how to embed above features with ARIMA model.
And also our data is from 2017-12 to now, there is no history season data。
Could you please give me a some advice?
Thank you.
They could be exogenous binary variables that the statsmodels ARIMA does support.
Great article! But I have a question. I have a daily time series, and I am following the steps from the time series forecasting book. How do I obtain the acf and pacf visually (for the Manually Congured ARIMA)? because I will have more than 1000 lag values (as my dataset is for many years), and after this I will need to search for the hyperparameters. I will really appreciate the help
An ARIMA might not be appropriate for 1000 lags.
Great
Thanks.
thank you very much, Jason.
However. I have some problem. Whenever I adopt your code for forcasting when no validation data is available,
for t in range(93):model = ARIMA(history, order=(5,1,0))
model_fit = model.fit(disp=0)
output = model_fit.forecast()
yhat = output[0]
predictions.append(yhat)
history.append(yhat)
print('predicted=%f' % (yhat))
my series converge to a constant number after a certain number of iterations, which is not right. What is the mistake?
You can fit a final model and make a prediction by calling forecast().
Here’s an example:
https://machinelearningmastery.com/make-sample-forecasts-arima-python/
Hi Jason,
Your articles are great to read as they give just the right amount of background and detail and are practical oriented. Please continue writing.
I have a question though, being not from the statistical background, i am having difficulty in interpreting the output that is displayed after the summary of the fit model under the heading of “ARIMA model results”. This summarizes the coefficient values used as well as the skill of the fit on the on the in-sample observations.
Can you please provide some explanation on their attributes and how the information assists us in the interpretation of the results
Thanks.
Perhaps focus on the skill of the model and using the forecast of the model?
Hi Jason,
Thanks a lot for this awesome tutorial.
I am training on a dataset where I have to predict Traffic and Revenue during a campaign (weeks 53,54,55) driven by this marketing campaigns. I think I can only use data preceding the campaigns (weeks 1 to 52) even though I have the numbers for campaign and post campaign.
I have a file as follows:
week// campaign-period // TV-traffic // Revenue Trafiic
1 //pre-campaign // 108567 // 184196,63
2 //pre-campaign // 99358 // 166628,38
…
53 // Campaign // 135058 //240163,25
54 // Campaign // 129275 //238369,88
…
56 // post-campaign //94062 // 141284,88
…
62 // post-campaign // 86695 // 130153,38
It seems like a statistical problem and I don’t know whether ARIMA is suitable for this use case (very few data, only 52 values to predict the following one). Do you think I can give it a shot with ARIMA or do you think there are other models that could be more suitable for such a use case please?
Thanks a lot for your help.
Perhaps list out 10 or more different framings of the problem, then try fitting models to a few to see what works best?
Hi Jason,
Thanks a lot for this awesome tutorial.
I am training on a dataset where I have to predict Traffic and Revenue during a campaign (weeks 53,54,55) driven by this marketing campaigns. I think I can only use data preceding the campaigns (weeks 1 to 52) even though I have the numbers for campaign and post campaign.
I have a file as follows:
week// campaign-period // TV-traffic // Revenue Trafiic
1 //pre-campaign // 108567 // 184196,63
2 //pre-campaign // 99358 // 166628,38
…
53 // Campaign // 135058 //240163,25
54 // Campaign // 129275 //238369,88
…
56 // post-campaign //94062 // 141284,88
…
62 // post-campaign // 86695 // 130153,38
It seems like a statistical problem and I don’t know whether ARIMA is suitable for this use case (very few data, only 52 values to predict the following one). Do you think I can give it a shot with ARIMA or do you think there are other models that could be more suitable for such a use case please?
Thanks a lot for your help.
Thank you for your help
Perhaps try it and see how you go?
Hi Jason, the constant updates are great and very helpful. I need a bit of help with my work. Im trying to forecast solid waste generation in using ANN. But I’m finding challenges with data and modeling my problem. If you could at least get me a headway that can help me produce something in 2weeks I will be grateful. I want to consider variables such as already generated solid waste, population, income levels, educational levels, etc. I hope to hear from you soon.
This is a good place to start for deep learning:
https://machinelearningmastery.com/start-here/#deeplearning
Many thanks Jason, it’s really helpful!
Just one question, my data set contains some sales value = 0, would that affect the performance of ARIMA model? if there will be issues, anyway I can deal with the zero values in my data set? Thanks in advance for your advice!
It can deal with zero values.
Hello Jason,
Any idea why I am having issues with datetime?
This is the error that I have received
Traceback (most recent call last):
File “/Library/Frameworks/Python.framework/Versions/3.7/lib/python3.7/site-packages/pandas/io/parsers.py”, line 3021, in converter
date_parser(*date_cols), errors=’ignore’)
File “/Users/Brian/PycharmProjects/MachineLearningMasteryTimeSeries1/ARIMA.py”, line 9, in parser
return datetime.strptime(‘190’ + x, ‘%Y-%m’)
TypeError: strptime() argument 1 must be str, not numpy.ndarray
During handling of the above exception, another exception occurred:
Thank You
Brian
Perhaps your data file, try this one instead:
https://raw.githubusercontent.com/jbrownlee/Datasets/master/shampoo.csv
The formating of csv seems different for everyone who downloads it, here’s the format that is used by Jason (just copy pasted this into a shampoo-sales.csv file and save)
– thanks to the person above for the tip
1-1,266
1-2,145.9
1-3,183.1
1-4,119.3
1-5,180.3
1-6,168.5
1-7,231.8
1-8,224.5
1-9,192.8
1-10,122.9
1-11,336.5
1-12,185.9
2-1,194.3
2-2,149.5
2-3,210.1
2-4,273.3
2-5,191.4
2-6,287
2-7,226
2-8,303.6
2-9,289.9
2-10,421.6
2-11,264.5
2-12,342.3
3-1,339.7
3-2,440.4
3-3,315.9
3-4,439.3
3-5,401.3
3-6,437.4
3-7,575.5
3-8,407.6
3-9,682
3-10,475.3
3-11,581.3
3-12,646.9
It is also available on my github:
https://github.com/jbrownlee/Datasets
Hello Jason
I’m trying to divide time series dataset into several dataset and select the best one as preprocessing dataset.I would like to use RMSE to evaluate each subset.In other word to select the window size and frame size before I do the training . Please let me know if you have any article on rows selection not column selection
Yes, this post will help tune the parameters of ARIMA that will include tuning the size of the window for each aspect of the ARIMA model:
https://machinelearningmastery.com/grid-search-arima-hyperparameters-with-python/
Hello Jason
Many thanks for your reply. I have tried the code on the following data set and got “Best ARIMANone MSE=inf”
date price
0 20160227 427.1
1 20161118 750.9
2 20160613 690.9
3 20160808 588.7
4 20170206 1047.3
RangeIndex: 657 entries, 0 to 656
Data columns (total 2 columns):
date 657 non-null int64
price 657 non-null float64
dtypes: float64(1), int64(1)
memory usage: 10.3 KB
Hello Jason
Just to clarify my previous question that i have 700 rows of date and price and I would like select the best 70(window size) rows for prediction and decide on the frame size , frame step and extent of prediction.
Sounds great, let me know how you go!
Hi Jason
Please let me know if you have an article help on specifying frame size , frame step and extent of prediction as data pre-processing step using RMSE and SEP.
I do, the grid search of the ARIMA algorithm I linked to above does that.
Perhaps try working through it first?
Thanks Jason. Your post in Grid search is great. I have already applied the Grid Search and got best Arima model .
Now I want to use the result and train the window in LSTM
RIMA(1, 0, 0) MSE=39.723
ARIMA(1, 0, 1) MSE=39.735
ARIMA(1, 1, 0) MSE=36.148
ARIMA(3, 0, 0) MSE=39.749
ARIMA(3, 1, 0) MSE=36.141
ARIMA(3, 1, 1) MSE=36.131
ARIMA(6, 0, 0) MSE=39.806
ARIMA(6, 1, 0) MSE=36.134
ARIMA(6, 1, 1) MSE=36.128
Best ARIMA(6, 1, 1) MSE=36.128
An LSTM is a very different algorithm. Perhaps difference the series and use at least 6 time steps as input?
I have 5 years of time series data .Will 6 time steps (6 days) be enough as window size.I want to get the best optimal window as input to LSTM !
Appreciate your feedback.
Test many different sized subsequence lengths and see what works best.
Can I use Gridsearch for the testing purpose to specify the window size for LSTM?And if yes what would be the paramerters equal to 60/90/120 days ?
I would recommend running the grid search yourself with a for-loop.
Try time periods that might make sense for your problem.
So I did the for-loop and manage to get different windows.
Now to calculate the RMSE do I need to do linear regiression prediction for each window in order to calculate the RMSE or is there any other way around?
I would expect that you would fit a model for different sized windows and compare the RMSE of the models. The models could be anything you wish, try a few diffrent approaches even.
I got the following as example for two window size 360 days and 180 days
For 360 days
Window start after 0 days with windwo size 360 and step 100 have RMSE 734.1743876097737
Window start after 100 days with windwo size 360 and step 100 have RMSE 369.94549420288877
Window start after 200 days with windwo size 360 and step 100 have RMSE 105.70778076287142
For 180 days
Window start after 0 days with windwo size 180 and step 90 have RMSE 653.9070358902835
Window start after 90 days with windwo size 180 and step 90 have RMSE 326.7832188924093
Window start after 180 days with windwo size 180 and step 90 have RMSE 135.01118940666115
Window start after 270 days with windwo size 180 and step 90 have RMSE 38.422587695965746
Window start after 360 days with windwo size 180 and step 90 have RMSE 60.73374764651785
Window start after 450 days with windwo size 180 and step 90 have RMSE 52.386817309349176
Well done!
Thanks Jason
Appreciate your support.
Your posts are really great and well organized.
I’m excited to ready your publications 🙂
Thanks for your support!
Hi Jason! Here client and time series forecaster!
When forecasting, I very often get this error:
LinAlgError: SVD did not converge
Any ideas how to solve this in general?
Thanks!
This is common.
Sounds like the linear algebra library used to solve the linear regression equation for a given configuration failed.
Try other configurations?
Try fitting a linear regression model manually to the lag obs?
Try normalizing the data beforehand?
Let me know how you go.
Hey Jason, what model i can use to equipment fault detection and prediction? So have some variables that correlate with others and i need to identification which are. See you soon.
Try a suite of methods in order to discover what works best for your specific problem.
Hello Jason,
There is something that I struggle to understand, it would awesome if you could give me a hand.
In ARIMA models, the optimization fits the MA and AR parameters. Which can be summed up as parameters of linear combination of previous terms for the AR and previous errors for the MA. A quick math formula could be :
X_t – a_1 X_t-1 … – a_p X_t-p … = e_t + b_1 e_t-1 + … + b_q e_t-q
When the fit method is used, it takes the train values of the signal to fit the parameters (a and b)
When the forecast method is used, it forecast the next value of the signal using the fitted model and the train values
When the predict method is used, it forecast the next values of the signal from start to stop.
Let’s say I fit a model on n steps in the train set. Now I want to make predictions. I can predict step n+1. Now I am days n+1 and I have the exact signal value. I would like to actualize the model to predict n+2.
In the rolling forecast part of your code, you fit again the model with the expanded train set (up to n+1). But in that case the model parameters are changed. It’s not the same model anymore.
Is it possible to train one model and then actualize the signal values (the x and e) without changing the parameters (a and b)?
It seems to me that it is important to keep one unique model and evaluate it against different time steps instead of training n different models for each new time steps we get.
I hope I was clear enough. I miss probably a key to understand the problem.
Thanks
Romain
The model will use the prediction as the input to predict t+2.
Hi Jason – Very helpful post here, thanks for sharing. I’m curious why parameter ‘p’ should be equal to the number of significant lags from the auto correlation plot? Just was wondering if you could give any more context to this part of the problem. Thanks.
Generally, we want to know how may lag observations have a measurable relationship with the next step so that the model can work on using them effectively.
I used your code to forecast daily temperature (it has a lag of 365). The forecast is always a day behind, i.e. learning history cannot accurately forecast next day’s temperature. I’ve played with the params with AIC.
Perhaps try alternate configurations?
Perhaps try alternate algorithms?
Perhaps try additional transforms to the data?
This might help:
https://machinelearningmastery.com/how-to-develop-a-skilful-time-series-forecasting-model/
How to use ARIMA model in SPSS with few sample as 6 years data and according to this data for how many years we can forecast the future.
Sorry, I don’t have examples of SPSS.
Hi Jason,
Thanks for sharing! Very helpful post.
Recently I am writing the methodology of ARIMA, but I can not find any reference (for example, some ARIMA formulas contain constant but some don’t have ). So could you please give me some reference (or ARIMA formula information) of “statsmodels.tsa.arima_model import ARIMA” used in Python?
Thank you in advance.
The best textbook on ARIMA is:
https://amzn.to/2MD9lKw
Hi Qianqian,
Prof. Hyndman’s textbook: https://otexts.com/fpp2/arima.html
Hope this helps.
If one has a time series where the time steps are not uniform, what should be done while fitting a model such as ARIMA? I have price data for a commodity for about 4 years. The prices are available only for days that a purchase was made. This is often, but not always, every day. So sometimes purchases are made after 2, 3 or even more days and the prices are therefore available only for those days I need to forecast the price for the next week.
Thanks for any advice on this.
Perhaps try modeling anyway?
Perhaps try an alternative model?
Perhaps try imputing the missing values?
Thank you, Dr Jason!
Hi Jason,
Thanks for this post.
I am working on finding an anomaly using arima. Will I be able to find from the difference in actual & predicted value shown above ?
Thanks,
Kruthika
Sorry, I don’t have examples of using ARIMA for anomaly detection.
Hi Jason,
I have couple of questions.
1. is it necessary that we need to have always uni variate data set to predict for time series using ARIMA? What if i have couple of features that i want to pass along with the date time?
2. is it also necessary that we have a non-stationary data to use time series for modelling? what if the data is already stationary? can i still do the modelling using time series?
Thanks
Bhadri
ARIMA can support exogenous variables, this is called ARIMAX.
If the data is already stationary, you can begin modeling without transforms.
Thanks Jason!! do u have any examples related to ARIMAX or point me to some articles..
Yes, there are examples here:
https://machinelearningmastery.com/time-series-forecasting-methods-in-python-cheat-sheet/
Hello sir,
This is a great article. But sir I have couple of questions?
1. Assume that if we have three inputs and one output with time period. Then how do we predict the next future value according to the past values to next time period using ARIMA model? (if we need to predict value next time interval period is 120min)
as a example
6:00:00 63 0 0 63
7:00:00 63 0 2 104
8:00:00 104 11 0 93
9:00:00 93 0 50 177
2. To predict value should I have to do time forecast according to the data that I mentioned earlier?
You could treat the other inputs as exogenous variables and use ARIMAX, or you could use another method like a machine learning algorithm or neural network that supports multivariate inputs.
This is a great post, thank you very much.
I’m new in this field, and I look for simple introduction to ARIMA models in general then an article about multivariate ARIMA.
Could you please help me.
Thanks.
I don’t think I have an example of a multivariate ARIMA, maybe ARIMAX/SARIMAX would be useful as a start:
https://machinelearningmastery.com/time-series-forecasting-methods-in-python-cheat-sheet/
Hey Jason,
I was wondering if you are aware of any auto arima functions to fine tune p,d,q parameters. I am aware that R has an auto.arima function to fine tune those parameters but was wondering if you’re familiar with any Python library.
Yes, I wrote one in Python here:
https://machinelearningmastery.com/how-to-grid-search-sarima-model-hyperparameters-for-time-series-forecasting-in-python/
Hi Jaosn.
Thanks a lot for the great tutorial!
Have followed your post : “How to Grid Search ARIMA Model Hyperparameters with Python” to fine tune the p,q and d value. Have come across the below point in the post.
“The first is to ensure the input data are floating point values (as opposed to integers or strings), as this can cause the ARIMA procedure to fail.”
My initial data is in the below format. Month and #Sales
2014-11 4504794
2014-12 7656479
2015-01 9340428
2015-02 7229578
2015-03 7092866
2015-04 14514074
2015-05 9995460
2015-06 8593406
2015-07 8774430
2015-08 8448562
I applied a log transofrmation on the above data set to convert the numbers to flot as below:-
dateparse = lambda dates: pd.datetime.strptime(dates, ‘%Y-%m’)
salessataparsed = pd.read_csv(‘sales.csv’, parse_dates=[‘Month’], index_col=’Month’,date_parser=dateparse)
salessataparsed.head()
ts_log = np.log(salessataparsed[‘#Sales’])
Below is the ts_log.head() output.
2014-11-01 15.320654
2014-12-01 15.851037
2015-01-01 16.049873
2015-02-01 15.793691
2015-03-01 15.774600
2015-04-01 16.490560
2015-05-01 16.117632
2015-06-01 15.966517
With this log value, applied the grid search approach to decide the best value of p,q and d.
Howver, I got Best ARIMA(0, 1, 0) MSE=0.023. Looks good ? is it acceptable? Wondering if p=0 and q=0 is acceptable. Please confirm.
Next, I have 37 Observations from Nov 2014 to 31-Dec-2017. I want to do future predictions for 2018, 2019 etc.How to do this?
Also, do you have any Youtube videos explaining each of the steps in grid approach, how to make future forecatsts available ? It would be great if you can share the Youtube link. 🙂
Once again thanks a lot for the article and your help!
You can discover if your model is skillful by comparing its performance to a naive model:
https://machinelearningmastery.com/faq/single-faq/how-to-know-if-a-model-has-good-performance
Perhaps try standardizing or normalizing the data as well.
I don’t make videos, only text-based tutorials, sorry.
I show how to use an ARIMA model to make forecasts here:
https://machinelearningmastery.com/make-sample-forecasts-arima-python/
Great ! Thanks a ton Jason.
Kindly confirm if the p,q value is 0 is an acceptable scenario.
Perhaps try standardizing or normalizing the data as well : I am not sure how to proceed with this?
It would be great if you can share related article if you have any. 🙂
For now, I am going to implement the future forecasting using the above link with this ARIMA(0,1,0) and will check how it behaves. 🙂
See this post:
https://machinelearningmastery.com/machine-learning-data-transforms-for-time-series-forecasting/
Hi Jason, thanks for the tutorial i am new to the world of predictive analysis but i have a project to predict when a customer is likely to make next purchase. I have dataset which include historical transactions and amount.
Will this tutorial help me or is there any suggestion on material/resource i can use.
Could you please advice
I recommend following this process:
https://machinelearningmastery.com/start-here/#process
Hi Jason,
Used your epic tutorial to forecast bookings.
I used the whole of 2017 as my data set and after applying everything in your post the predicted graph seems to be one day off i.e. prediction graph looks spot on with each data point very close to the what it should be, the only thing is is that it’s a day late…is this normal? Is there something within the code that causes something like this?
Thanks
This is a common problem, I explain more here:
https://machinelearningmastery.com/faq/single-faq/why-is-my-forecasted-time-series-right-behind-the-actual-time-series
Hi, i have had a question for a while, now this might be silly but I can’t figure out whats wrong here…
So I have a timeseries data and when i used order=(0,1,0) that is, differencing is 1 then i get a timeseries that is ahead of time by one.
example:
input: 10, 12, 11, 15
output: 8, 9.9, 12.02, 11.3, 14.9
Now if I shift the resulting series by one timeperiod, it’ll match quite well.
Also, similar output can be seen is (0,2,1) that is, differencing is 2 and MA is 1.
Could someone explain why is this happening and what am i missing here.
[numbers in example are representative not actual]
It suggest that the model is using the input as the output, this is called a persistence model:
https://machinelearningmastery.com/faq/single-faq/why-is-my-forecasted-time-series-right-behind-the-actual-time-series
Thanks Jason, I went through the link and it helps me see a clear picture which should have been obvious to notice but i missed it.
If you please, could also share some thoughts on…
– My model uses order(0,1,0). i.e. differencing is 1. Do such model makes sense for a practical scenario where we are trying to predict inventory requirement for a part(based on past consumption) that may fail in coming future(where failing of a part is totally a random act of nature).
– Also, (0,2,1) and (0,1,0) gives very similar results. Is this expected in some sense. Is there any concept that i am missing here.
Thanks a lot again, for your help.
I generally recommend using the model that gives the best performance and is the simplest.
Hello Jason!
Thank you for the tutorial. It’s a good start to implementing an ARIMA model in Python. I have a question: You have used the actual data samples to update your training dataset after each prediction as given in “history.append(obs)”. Now let’s take a real life example when you don’t have any further actual data and you use your predictions only to update your training dataset which looks like “history.append(yhat)”. What will happen in this case? I am working on air quality prediction and in my case, the former scenario keeps the seasonal pattern in the test set but the latter does not show any seasonal pattern at all. Please let me know what’s your take on this.
Regards,
Dhananjai
—
You can re-fit the model using predictions as obs and/or predictions as inputs for subsequent predictions (recursive).
Perhaps evaluate a few approaches on your dataset and see how it impacts model performance.
Hi Jason ,
Thank you for the tutorial.
I have two questions :
first : why you set moving average “q” Parameter by 0 ?
second : why you set Lag value To 5 not 7 for example?
Thanks.
They are an arbitrary configuration.
Perhaps try other configurations and compare results.
Thank you for your great tutorial.
I know that the third output from model_fit.forecast() consists of the confidence interval. But how can I plot the confidence interval on the whole range automatically?
Thanks
I believe this tutorial will help:
https://machinelearningmastery.com/time-series-forecast-uncertainty-using-confidence-intervals-python/
What’s the difference of predicted and expected? Sorry I’m a just a novice.
“Predicted” is what is output by the model.
“Expected” or “actual” are the true observations.
Hey Jason,
Amazing blog, subscribed and loving it. I had a question about how you would send the output of the model to a data table in CSV?
Ramy
You can save a Numpy array as a csv directly:
https://docs.scipy.org/doc/numpy-1.14.0/reference/generated/numpy.savetxt.html
Hi Jason, man I love this blog.
I’m running this with a separate data set. I’ve shaped my dataset, but when I run the error line, I’m getting this:
ValueError: Found array with dim 3. Estimator expected <= 2.
What are you thoughts?
Thanks,
Benny
Shaping:
X_train = np.reshape(X_train, (len(X_train), 1, X_train.shape[1]))
X_test = np.reshape(X_test, (len(X_test), 1, X_test.shape[1]))
Code:
history = [x for x in X_train]
predictions = list()
for t in range(len(X_test)):
model = ARIMA(history, order=(10,0,3))
model_fit = model.fit(disp=0)
output = model_fit.forecast()
yhat = output[0]
predictions.append(yhat)
obs = X_test[t]
history.append(obs)
print('predicted=%f, expected=%f' % (yhat, obs))
error = mean_squared_error(X_test, predictions)
print('Test MSE: %.3f' % error)
You’re data has too many dimensions. It should be 2D, but you have given it 3D data, perhaps change it to 2d!
Oh. I thought that’s what I did with reshaping. Whoops =)
I’ll hunt up some code. Thank you.
Hi Jason,
Thanks for this great work!
If you allow me, I have a question: how was the confidence interval calculated in the above example? I know its equation, but I do not know what are the values to be used for (sigma) and (number of samples).
Thank you once more.
You can review the statsmodels source code to see exactly how it was calculated. The API documentation may also be helpful.
Thanks a lot Jason!
I am preparing a time series model for my capstone project, i have around 500 items and the p,d,q value is different for each item, how can i deploy this as a tool? do i have to create model each time for different items?
Thanks in advance.
Perhaps model each series separately?
How many minimum data points do we require for creating accurate prediction using ARIMA model. We are predicting future cut-off values of colleges using previous records, how many years of records would we need to predict just the cutoff value of next year.
I recommend testing with different amounts of history on your specific dataset and discover the right amount of data for modeling.
If I am not wrong, ACF plot is used to get MA value for ARIMA. But here, you have taken AR value as 5 using ACF plot?
Hi Jason Brownlee!
I have been following your blog since some time and the concepts and code snippets here often come handy.
I’m totally new to time series analysis and have read some posts (mostly yours), a few lectures and of course questions from stackoverflow.
What confuses me is, to make a series stationary we difference it, double differencing in case seasonality and trend both are present in the series. Now while performing ARIMA, the parameter ‘I’ depicts what? Number of times we have performed differencing or lag value we chose for differencing (for the removal of seasonality).
For example, let say there is a dataset of monthly average temperatures of a place (possibly affected by global warming). Now there is seasonality (lag value of 12) and a global upward trend too.
before performing ARIMA I need to make the series stationary, right?
To do that I Difference twice like this:
differenced = series – series.shift(1) # to remove trend
double_differenced = differenced – differenced.shift(12) # to remove seasonality.
Now what should be passed as ‘I’ to ARIMA?
2? As we did double(2) differencing
or
1 or 12 as that’s the value we used for shifting.
Also if you’re kind enough, can you elaborate more how *exactly* did you decide the value of ‘p’ and ‘q’ from acf and pacf plots.
Or link me to some post if you have already explained that in layman terms somewhere else!
Extremely thankful for your time and effort!
It might be better to let the ARIMA model perform the differencing rather than do it manually.
And, if you have seasonality, you can use SARIMA to difference the trend and seasonality for you.
If you difference manually, you don’t need the model to do it again.
The computed initial MA coefficients are not invertible
You should induce invertibility, choose a different model order, or you can
pass your own start_params.
How do I fix this error? Best ARIMA params are (4,1,3)
Perhaps try a different configuration or try to prepare the data before modeling.
Do we have a similar function in python like we have auto.arima in R?
I wrote one here:
https://machinelearningmastery.com/how-to-grid-search-sarima-model-hyperparameters-for-time-series-forecasting-in-python/
And another here:
https://machinelearningmastery.com/grid-search-arima-hyperparameters-with-python/
Thank you very much, your blogs really come in handy for a beginner in python. when I run the ARIMA forecasting using above codes, getting some format error. I have tried to use Shampoo sales data too. below is the error note,
File “”, line 1, in
runfile(‘C:/Users/43819008/untitled2.py’, wdir=’C:/Users/43819008′)
File “C:\ProgramData\Anaconda3\lib\site-packages\spyder\utils\site\sitecustomize.py”, line 880, in runfile
execfile(filename, namespace)
ValueError: time data ‘19019-01-2019’ does not match format ‘%Y-%m’
I have tried all the format in excel and saved as CSV. but nothing helped me. hope you can help me.
Looks like an issue loading the data.
You could try removing the date column and changing the load function call to not use the custom function?
Hello Everyone , I want to implement ARIMA model but this error is not leaving me.
from . import kalman_loglike
ImportError: cannot import name ‘kalman_loglike’
Looks like you’re trying to import a module that does not exist or is not installed.
I got that.
Thank you very very much ,
Hi Jason, I recently came accross your blog and really like the things I have learned in a short period of time. Machine learning and AI are still relatively new to me, but I try to catch up with your information. As the ARIMA Model comes from the statistics field and predicts from past data, could it be used as the basis of a machine learning algorithm? For example: if you would create a system that would update the predictions as soon as the data of a new month arrives, can it be called a machine learning algorithm? Or are there better standarized machine learning solutions to make sales predictions?
Sure.
Yes, ARIMA is a great place to start.
Hello AI,
>>the last line of the data set, at least in the current version that you can download, is the text line “Sales of shampoo over a three year period”. The parser barfs on this because it is not in the specified format for the data lines. Try using the “nrows” parameter in read_csv.
series = read_csv(‘~/Downloads/shampoo-sales.csv’, header=0, nrows=36, parse_dates=[0], index_col=0, squeeze=True, date_parser=parser)
worked for me.
Thank you for posting this. I was having the same issue. This solved it.
Thanks Jason for another great tutorial.
Thanks, I’m glad it helped.
Jason,
thank you it was very helpful in many different ways. I just want to know how you predict and how far you can predict in the future.
Thanks, good question. This post will show you how to predict:
https://machinelearningmastery.com/make-sample-forecasts-arima-python/
Hi Jason,
Thanks for your write-up. I’ve tried all the suggestions here but still getting these two errors.
in parser(x)
5 def parser(x):
—-> 6 return datetime.strptime(‘190’+x, ‘%Y-%m’)
7
TypeError: strptime() argument 1 must be str, not numpy.ndarray
ValueError: time data ‘1901-Jan’ does not match format ‘%Y-%m
I removed the footer, tried with your csv file , tried with nrows but nothing worked. Please give me your valuable feedback.Thanks.
Perhaps confirm that you downloaded the dataset in the correct format?
i use R to get the p,q but it does work in the statsmodel’s arima model which always raise SVD did not converge even i set the p,q very small
Hmm, maybe the R version is preparing the data automatically before modelling in some way?
how can I get future forecast value with arima?
See this tutorial:
https://machinelearningmastery.com/make-sample-forecasts-arima-python/
Hi Jason,
Your materials on Time Series have been extremely useful. I want to clarify a basic question on Model results. For an ARMA(3,0) , the statsmodel prints the output as
coef P>Z
const c 0.00
ar.L1 x1 0.003
ar.L2 x2 0.10
ar.L3 x3 0.0001
And the Data is:
Actual Daily Traffic Predicted Traffic
Jan7 100
Jan8 95
Jan9 85
Jan10 105
If I want to convert the output to a linear equation will the Predicted Traffic for Jan10 be :Pred= c+ x1*85 + 0*x2 + x3*100 ?? Appreciate your thoughts
Great question, I have an example of making a manual prediction here:
https://machinelearningmastery.com/make-manual-predictions-arima-models-python/
Thank you very much Jason. That post was very helpful. Putting the options no constant has given me the exact result for prediction. i.e., dot product of coefficients and the lagged values.
Glad it hear it.
i am newbie and trying to learn time series. getting following error, please help.
series = read_csv(‘sales.csv’, delimiter=’,’, header=0, parse_dates=[0], index_col=0, squeeze=True, date_parser=parser)
Traceback (most recent call last):
File “”, line 1, in
series = read_csv(‘sales.csv’, delimiter=’,’, header=0, parse_dates=[0], index_col=0, squeeze=True, date_parser=parser)
File “E:\ProgramData\Anaconda3\lib\site-packages\pandas\io\parsers.py”, line 678, in parser_f
return _read(filepath_or_buffer, kwds)
File “E:\ProgramData\Anaconda3\lib\site-packages\pandas\io\parsers.py”, line 446, in _read
data = parser.read(nrows)
File “E:\ProgramData\Anaconda3\lib\site-packages\pandas\io\parsers.py”, line 1036, in read
ret = self._engine.read(nrows)
File “E:\ProgramData\Anaconda3\lib\site-packages\pandas\io\parsers.py”, line 1922, in read
index, names = self._make_index(data, alldata, names)
File “E:\ProgramData\Anaconda3\lib\site-packages\pandas\io\parsers.py”, line 1426, in _make_index
index = self._agg_index(index)
File “E:\ProgramData\Anaconda3\lib\site-packages\pandas\io\parsers.py”, line 1504, in _agg_index
arr = self._date_conv(arr)
File “E:\ProgramData\Anaconda3\lib\site-packages\pandas\io\parsers.py”, line 3033, in converter
return generic_parser(date_parser, *date_cols)
File “E:\ProgramData\Anaconda3\lib\site-packages\pandas\io\date_converters.py”, line 39, in generic_parser
results[i] = parse_func(*args)
File “”, line 2, in parser
return datetime.strptime(‘190’+x, ‘%Y-%m’)
File “E:\ProgramData\Anaconda3\lib\_strptime.py”, line 565, in _strptime_datetime
tt, fraction = _strptime(data_string, format)
File “E:\ProgramData\Anaconda3\lib\_strptime.py”, line 362, in _strptime
(data_string, format))
ValueError: time data ‘1901-Jan’ does not match format ‘%Y-%m’
Looks like you need to download the data with numeric date format, or change the data parsing string.
Thanks, it is resolved, i have to download another file.
Glad to hear that.
Hi Jason!
I have a compile error: insufficient degree of freedom to estimate, when finishing my program on ARIMA in Python. Could you tell me what leads to this error? Cuz I found little answer in other solution website like stack overflow.
Hoping to hear from you!
Thank you, Jason!
Perhaps your data requires further preparation – it can happen if you have lots of zero values or observations with the same value.
Hi, Jason.
Thanks for the writeup. When running your code with a small dataset (60-ish values) it runs without a hitch, but when I run it with an identically-formatted, much larger database (~1200 values) it throws this error:
“TypeError: must be str, not list”
Any idea why this is? Thanks in advance.
Perhaps confirm that you have loaded your data correctly, as a floating point values?
Hi Jason,
Do you know how predict from estimated ARIMA model with new data, preserving the parameters just fitted in the previus model?
I’m trying to accomplish in python something similar to R:
# Refit the old model with newData
new_model <- Arima(as.ts(Data), model = old_model)
Yes, you can use the forecast() or predict() functions.
More here:
https://machinelearningmastery.com/make-sample-forecasts-arima-python/
Jason, great tutorial! I follow your blogs and book regularly and they help me a lot!
However I have some conceptual doubts that I hope you can help me with.
1. If you don’t do a rolling forecast and only use the predict function, it gives us various predicted values (number of predicted values are equal to length of training data). How are the predictions made in this case? Does it use the previous predicted values to make next predictions?
2. When I validate a neural network made of one or more LSTM layers, I pass actual test data to the predict function and hence it uses that data to make predictions, so is walk forward validation/ rolling forecast redundant there?
Good question, ideally you want to fit the ARIMA model on all available data – up to the point of prediction.
So, in a walk-forward validation you might want to re-fit the ARIMA each iteration.
Hi Jason, thank you so much for all your tutorials. They have been of great help to me.
I had a question about the ARIMA model in statsmodels. If I want to select certain lags for the parameter p instead of all lags up until p how would I to do it ? I have not seen functionality for this in statsmodels, I wondered if you knew.
Whenever you find the time. Kind regards Karl
You might have to write a custom implementation I’m afraid.
Yes, I totally understand why we use walk forward validation, but I see a major drawback of it i.e it works great with shorter time series, however when you have a longer time series and multiple variables, it takes a really really long time to re-fit a SARIMAX model and get the predictions.
That’s why what I intended to ask in the second point is, if instead of a SARIMA model, I use an LSTM model, do I still need to do walk forward validation, since it already uses the actual values up to the point of prediction.
Yes. But you may not have to refit the model each step. I often do not.
Hi Jason, thanks for the great post. My time series problem is kind of different. The data lag I have is large and inconsistent. For example, I want to know for the order I received 6 pm today, how many hours we will use to fulfill this order. We might not know the fulfillment time for order received at 5 pm, 4 pm, or not even yesterday since they might not be fulfilled yet. We have no access to the future data in real life, do you have any suggestion on this? Thank you so much.
That sounds like a great problem.
I recommend using this framework to help think about different ways you can frame the problem for prediction:
https://machinelearningmastery.com/how-to-define-your-machine-learning-problem/
Ok, Have you covered it in any of your articles? Can you refer me to it?
Hi Jason. Thank You very much for teach how ti make Forecast. Butaca i have a doubt, in this example only we have 12 prediction for 12 observations (or expected values).
Un this case, i would like yo know. What is the prediction to the short future.
Thank so much.
Atte. Luis
Perhaps this post will help:
https://machinelearningmastery.com/make-sample-forecasts-arima-python/
Hi! Thank You for your teach.I have a problem when I use the ARIMA to build a model for the multivariate data,but appear some error”TypeError:must be str,not list”at”model=ARIMA(history,order=(5,1,0))”.The history data is a list of 500*2.
Sounds like you might not have loaded the dataset correctly.
Perhaps confirm it was loaded as real values, not strings.
Hi can you please show us some plots ,spcific to ARIMA ?
thank you
Like what exactly?
Hi Jason:
Thanks for this tutorial.
Just wondering how was a value of 0 was decided for q? For that don’t you need the PACF plot?
Any help will be much appreciated.
Regards,
Anindya
I may have configured the model in this tutorial based on a trial and error.
Hey man, great tutorial. I just wanted to ask you how does residual error or its graph fit into time series analysis, I mean i am not able to understand the importance of residual error, what does it show. I am still in the learning phase.
Thanks, we expect the residual error to be random – if there is a pattern to it, it means our model is missing something important.
Hi Jason,
I’m considering buying your book. Will the code examples be up to date seeing as it is now 2019? Also, what success have you had forecasting several time series, lets say 30, with the same model. Would you suggest more of an ensemble approach?
Oh, is any other reading material you would suggest? We did not cover time series in my masters program, so I’m a newbie.
Yes, you can get started with the basics here:
https://machinelearningmastery.com/start-here/#timeseries
Advanced topics here:
https://machinelearningmastery.com/start-here/#deep_learning_time_series
Yes, I update the books frequently. After purchasing, you can email me any time to get the latest version.
Hmm, 30 is not a large number, it might be best developing a separate model for each and compare the results to any model that tries to learn across the series.
Hello Jason,
I still don’t understand why the forecast is one step ahead of the actual value. Why is this behavior expected, If for instance my model predicts very well the timeseries but with a lag, does this mean that my model is good or I should go on tuning to take off the lag?
In the case of the lag, the line print(‘predicted=%f, expected=%f’ % (yhat, obs)) isn’t it also lagged and not representative of the actual comparison?
Thanks
I think you are describing a persistence forecast, this might help:
https://machinelearningmastery.com/faq/single-faq/why-is-my-forecasted-time-series-right-behind-the-actual-time-series
Dear Prof. Kindly help to write the equation for ARIMA (0,0,0); (0,1,0); (1, 0,1), VARMA (1,1), and ARMA (5,4)
Thanks
I cannot write equations for you, this would be trivial though, start with the ARIMA equation and add the terms you need.
Perhaps get a good textbook on the topic.
I appreciate your view and advice, sir. Please, suggest relevant textbook on ARIMA and how or where i can get one. Warmest regards.
Here are some suggestions:
https://machinelearningmastery.com/books-on-time-series-forecasting-with-r/
Thanks Jason for overview of ARIMA model with example,
In below code, are you creating model again and fitting in each pass of for loop ?
In other algorithms we generally create model and fit model once and later use same to predict values from test dataset.
for t in range(len(test)):
model = ARIMA(history, order=(5,1,0))
model_fit = model.fit(disp=0)
Yes, this is called walk forward validation and it is the preferred way for evaluating time series models.
You can learn more here:
https://machinelearningmastery.com/backtest-machine-learning-models-time-series-forecasting/
Hi,
Great post, and blog in general!
I have a question regarding the practical use of ARIMA. Is it possible to use it (after fitting on some dataset), to test the prediction from any new input data, just like any regression algorithm ?
For instance, I have one year of temperature data on which I fit my model, using the last 7 points (say 1 point per day) for autoregression. Then, to use the model in production, I want to simply store the last 7 days and use them to predict the next one. (Without the need to fit my model again and again each day)
Many thanks,
Mickaël
Yes, here is an example:
https://machinelearningmastery.com/make-sample-forecasts-arima-python/
Hi
I am new to Auto Regression and Python. Great articles, I am finding them very helpful.
My question is around how much historical time series is enough to stand a chance of getting a good prediction? For example, if I have two years worth of data (adjusted to remove trends and seasonality) then does it really make a difference if I use all of it in a training set or use latest use latest subset e.g last 50 days (assuming lags would be less than 10?)?
Also, how should I think about accounting for seasonality. I understand I would need to remove it from the time series in order to get a reasonable prediction. Should I then have an overlay on top of predicted values to impalement the impact of seasonality?
Thanks
Dav
It depends on the dataset, try different amounts of history to see how sensitive your model is to dataset size.
You can remove seasonality or let the model remove it for you in the case of SARIMA. Any structure removed must be added to predictions, it is easier to let the model do it for you perhaps.
got it, thanks
Hi Jason, thanks for your blog, i’m newbie, i have a question: model ARIMA is machine learning?
It was developed in statistics and borrowed in machine learning.
The intent makes it machine learning, more here:
https://machinelearningmastery.com/faq/single-faq/how-are-statistics-and-machine-learning-related
Hi Jason,
Thank you for this. What are some good strategies to handle zeros (zero demand) in your time series. I know consecutive zeros can be a problem for AR algorithms (false collinearity) and for Triple exponential multiplicative version.. Is there any useful resource you can point to? Something like a normalizing/ denormalizing?
Also, if I have a lot of time series to forecast for, where I cannot really visualize each of them, what are some indicators that will be helpful to describe the time series and the path to follow?
Thanks
Good question – it is probably going to be domain specific how to best handle it.
Test many things.
Try small random values?
Try impute with mean value?
Try alternate methods, like neural nets?
…
Hi Jason how long does it take to fit a model, code is taking ages at the fit line
model_fit = model.fit(disp=0)
It really depends on the size of the dataset.
much appreciated..
You’re welcome.
Hi, thanks Mr.Brownlee for your great posts. I had a question, can ARIMA model be used to forecast NA values in a dataset? I mean can it handle missing values?
No.
More on missing values here:
https://machinelearningmastery.com/handle-missing-timesteps-sequence-prediction-problems-python/
Hello Jason and thank you for your great posts
I am trying to fit an ARIMA model to an company invoices timeseries. It has a timestamp (not regulary spaced) and a value that can be negative or positive – with a large interval.
Do I have to interpolate in order to have regular intervals? If I use a naive solution, as group by day, I get a lot of zero values.
Could you help me?
I have some suggestions here:
https://machinelearningmastery.com/faq/single-faq/how-do-i-handle-discontiguous-time-series-data
Hello Jason and thank you for your posts
can you please make same project for stock price prediction using Arima model??
Sorry, I choose not to give examples for the stock market. I believe it is not predictable and a waste of time.
Hi,
How can I specify which lags the model uses, for instance, a two degree AR model with 1 and 24 as lags?
Thanks in advance for your reply.
It will use all lags in between.
To use otherwise, you may have to develop your own implementation.
Hi Jason,
Thanks for writing such a detailed tutorial.
In your text, you mentioned that “A crude way to perform this rolling forecast is to re-create the ARIMA model after each new observation is received.” Is there another way to do so without retraining the model? Is there a way just to update the inputs (and not the parameters?
After our first prediction, we get the true value and the prediction error we now use the new information to predict the next step (without retraining)?
Thanks!
Yes, you can forecast for the future interval directly without updating the model, e.g. model.forecast() or model.predict()
Is that what you mean?
Hi Jason,
Thanks for the rapid reply, and sorry for not being clear.
If I understood it right, model.forecast() will forecast one step at a time.
I’ve 4 months’ worth of data sampled every 1 min. I’d like to test how well it predicts the next minute (or 10 minutes). If my training dataset ends at time t, after predicting t+1, the true value will be available and can help to predict t+2. I see 3 options to do so:
1. Use model.predict() for 2 samples, but then I don’t use the new information.
2. As in your example, retrain the model every timestamp – I’d like to avoid this as I’m considering running this in real-time and don’t want to retrain at every sample. I don’t think the model parameters have changed.
3. Update the model input without retraining the model. Meaning, update the time series samples by adding new observation but without updating the model parameters
Thanks,
Nir
Not quite.
You can use forecast() and specify the number of steps required.
You can use predict() to specify an interval of dates or time steps.
See this post:
https://machinelearningmastery.com/make-sample-forecasts-arima-python/
Yes, perhaps try with and without refitting the model, and try refitting every hour, day, week and compare.
Thanks for your response. In Matlab, you can choose specific lags.
When I am trying to use all the lags in between it takes forever to make a model.
Yes, the statsmodel implementation could use some improvement.
Hey Jason, I’m currently doing my thesis on forecasting electricity load and am also using the ARIMA from statsmodels.
You mentioned, that the reestimation you are doing for forecasting is a crude way of doing this as you compute a new ARIMA for every step. What would be a nicer way to do this? Maybe with fitting the model on the training data and after each forecasting step appending the real value to the data and then forecasting the next step (without having to fit the model again)? I couldn’t figure out yet how to do this, might this work with the initialize() function of the ARIMAResults class?
Btw, thanks a lot for this excellent tutorial, it’s really well explained!
Ideally fitting the model only when needed would be the best approach, e.g. testing when a refit is required.
A fit model can forecast any future period, e.g. see forecast() and predict().
Hey Jason I’m doing a project on crime prediction and wanted to use ARIMA model could you help me in understanding what kind of factors would predict the trend
If you are using an ARIMA, it will remove the trend via differencing. Perhaps try different d values.
Or, perhaps try a grid search of different model parameters;
https://machinelearningmastery.com/grid-search-arima-hyperparameters-with-python/
Hi Jason,
What made you choose 5 lags for this dataset? In other words, what is the threshold we should choose for autocorrelation? Is it above 0.5? What about negative correlation? So in this example, the absolute value of the negative correlation is <0.5. How would we choose the number of lags (p) if it was say -0.52?
Thanks,
Asieh
Perhaps test a range of values and see what works best for your specific dataset.
Loving the post! It definitely helps me grab of ARIMA. I needed to find a technique forecasting sales of an object where the growth path jumps up and down drastically. And this was the point I needed to have some smoothing ways for the projection rather than stochastic process. Not to mention, the code is simple and efficient well enough. Thank you very much.
Thanks, I’m happy that it heled!
Hello Jason. I am new to Series Forecasting in Python. I would like to dig into it and learn how to forecast time series. I have recreated your ARIMA sample with my own data and it worked. I have a unix time series and would need to forecast the next 5 future values. I have not fully grasped the concept of predicted/expected and how I can get these future values. Did I misunderstand the model? I will buy your ebook, but maybe your response will help me proceed fast.
Perhaps this post will help:
https://machinelearningmastery.com/make-sample-forecasts-arima-python/
One more question: I am using a time series with a frequency of 1 minute. The series is correctly setting a DateTimeIndex in col 0 and there seem to be no values missing. When I call ARIMA I get this message: “ValueWarning: No frequency information was provided, so inferred frequency T will be used. % freq, ValueWarning)”. None of you examples are based in 1 minute frequencies. Is it not possible to work with 1 minute time series with ARIMA?
Good question, I don’t have an example, but I can’t see that the ARIMA model will care about the frequency as long as it is consistent.
All sorted. I am using the unix time stamps and its working. I am almost through with your book and have already included the ARIMA model in my project. I have implemented the grid search and have generated the best order combination. I would assume that the order combination is the key to making the best possible forecast, right (considering that the dataset has been prepared and is suitable for modeling)?
Correct. Test different orders and see what works well/best for your specific dataset.
Thank you for the link. This will defenitly help. I am half way through your book on Time Series Forecasting and will get there too, I guess. Your book is well written, hands on. Ta
Thanks Mark.
Hey Jason,
Interested if you know what type of correlation pandas.plotting.autocorrelation_plot is using. I get a different result with this data set using pandas.Series.autocorr over 35 lags than I do from autocorrelation_plot.
This is a copy paste of the autocorrelation_plot code to retrieve the data:
from pandas.compat import lmap
series = shampoo_df.Sales
n = len(series)
data = np.asarray(series)
mean = np.mean(data)
c0 = np.sum((data – mean) ** 2) / float(n)
def r(h):
return ((data[:n – h] – mean) *
(data[h:] – mean)).sum() / float(n) / c0
x = np.arange(n) + 1
y = lmap(r, x)
There isn’t any information I can find about why they wouldn’t be using pearson’s r. This almost looks like it could be it, but it isn’t. And mathematically float(n) cancels out in the equation above, which is odd that it wasn’t caught.
Anyway, if you could shed any light on why pandas.Series.autocorr is different than pandas.plotting.autocorrelation_plot that would be very helpful!
I believe it is simple linear correlation, i.e. pearsons.
Minor differences in implementation can cause differences in result, e.g. rounding errors, choice of math libs, etc.
Hi Jason,
1) ARIMA model works on three parameters – Auto-regression, Differencing and Moving average. So does the ARIMA model makes three separate columns like – one for AR, another for Differencing and and other for Moving average separately or it does only one column and does all the above operations on the same column only (AR, I, MA) ?
2) If ARIMA makes separate columns like (AR, I and MA) for forecasting, then should we also do the same thing to forecast time series using supervised machine learning or we can create only one column with all the operation (AR, I and MA) done on that column only.
Thanks.
It does not create different columns, it creates “transformed inputs” to a linear model that is fit.
so there are different columns for transformed inputs created or only one column ?
I don’t follow your question, sorry. Perhaps you can elaborate?
I mean to say if in ARIMA model our values for (p,d,q) is (2,1,2) then it will create variables – two variables for Auto Regression i.e for Lag 1 & Lag 2 and two variables for Moving Average i.e MA1 and MA2 and all the variables created i.e AR1, AR2, MA1 and MA2 will be differenced one time as value of d is 1.
do we need to difference the value for y variable also ?
From memory, yes I believe so. Perhaps confirm.
Why ACF and PACF plots applied on stationary Series only ?
To help you see the signal that the model will learn, and not get distracted by trend/seasonality which get in the way.
to make the series stationary, we deseasonalize the series by dividing it with seasonal index and difference it for detrending it. Now the same stationary series need to be used for both x and y variables (Dependent and independent variables) and if so then we have to reverse the above process to get the original data.
I am following the below approach to make the series stationary. Is this the right approach ?
The process of deseasonalizing – dividing it with seasonal index and detrending by differencing x(t) – x(t-1)
Correct.
Examples here:
https://machinelearningmastery.com/remove-trends-seasonality-difference-transform-python/
Why we require a stationary data series for time series forecasting ?
To learn the signal in the data.
Hi Jason,
It seems that the most of methods discribed in this tutorial are meant for testing on the data we already have. How about multi step prediction? Is there any simple way to extend some of the methods to perform multi step forecast? Thanks in advance.
Call model.forecast()
Here is an example:
https://machinelearningmastery.com/make-sample-forecasts-arima-python/
Hi, Jason,
What is the reason here by multipling the length with 0.66?
(size = int(len(X) * 0.66)
train, test = X[0:size], X[size:len(X)]
To split the data into train and test sets.
Hi Jason,
for my bachelors thesis I need to generate “Sample months of solar radiation”. The problems is as follows: Ive got ten years of historic hourly solar radiation. Its in a DataFrame where every column represents an hour of a day and every row is one day (so starting with the first of january of the first year and ending with the 31st of january of the last year). Now I need to feed my data into a SARIMA Model for each month of the year so that I can use it to generate a fictive month of solar radiation. I want to generate 1000 years and they should each be a bit different, have some kind of a random component to them.
Do you have any idea how to do this?
If I just feed it the DataFrame as is, it returns the “Invalid value for design matrix. Requires a 2- or 3-dimensional array, got 1 dimensions” error.
If I flatten the DataFrame (.values.flatten()), I think it doesnt “see” the seasonality and returns an array as long as the input data when the predict() method is called
This might help you think about the data:
https://machinelearningmastery.com/time-series-forecasting-supervised-learning/
An ARIMA/SARIMA/etc model expects one sequence of observations. It will transform the data into a supervised learning problem for you.
Does that help?
In your example you re-fit the model every timestep to do a rolling forecast. This is horrendously inefficient of course–how can this be avoided? Can’t the model be applied to a window of the test set data, and a prediction of next step generated, without re-training it?
Yes, you could fit the model once and use it each evaluation, but the risk is it does not use the most recent obs in the selection of coefficients.
Thanks a lot for your reply. How do you do that? I just want to run inference with an ARIMA the same way I would with e.g. RNN–train it up, then feed it arbitrary subsequences from a test dataset and generate the predicted next item in each case. As obvious as a use case as this is, I haven’t been able to see how to effectively do this. The predict method, for example, doesn’t seem to take in the current subsequence, which seems bizarre. I must not be understanding something, but what?
You can fit the model once on the training dataset and make predictions by calling predict() and specifying the interval in the future (beyond the end of the training set) to predict.
Predict will take any future contiguous sequence of steps to predict.
Also this might help:
https://machinelearningmastery.com/make-sample-forecasts-arima-python/
Thanks for the link to your other tutorial, that also was very helpful. But it seems to confirm that Python’s ARIMA can only predict just the few samples after the data set! Using that example, let’s suppose I want to predict days 8-14 past the end of the training set–at this point I’d want to take the real data from days 1-7 into account. But apparently I’d have to retrain the model, with the training data now extended to include these days 1-7. This makes no sense to me, I would have thought that an ARIMA model, once all its coefficients are determined, could be applied to any arbritrary sequence. A (7,0,1) model should need just the prior seven days to make a prediction right? *Any* prior 7 days. Help.
Nice.
Yes, I show how to pull the coefficients out of the model and use them manually, if that is any help:
https://machinelearningmastery.com/make-manual-predictions-arima-models-python/
I did it to help show how the model works, but you could adapt it for a production system that makes predictions on demand if you like.
Wow you have a tutorial for everything! Awesome. Thanks a lot. Btw a few years back I recommended your computer vision book to someone at work (on the strength of what I’d seen in the tutorials), who in fact went and bought it from you. Glad now more than ever that I did.
Anyway I’m surprised that what I want here isn’t more of a standard use case. But the idea of course is that to get a good sense of how well the model does, and compare with other models, then I need to generate lots of short-term predictions from a test set, and do so efficiently.
Suggestion–put a link to this tutorial in the original ARIMA blogpost that launched this thread.
Thanks!
Appreciate the suggestion.
How we can use ARIMA with multiple input variables?
It is called VARIMA, see this:
https://machinelearningmastery.com/time-series-forecasting-methods-in-python-cheat-sheet/
How we can remove AutoCorrelation of our data?
Differencing can remove trends, seasonal differencing can remove seasonality.
PLS HELP!
I have a datetime stamp column and the Power consumed against it. I used ARIMA to forecast Load consumption using:
results_ARIMA = results_AR.forecast(steps=24)
I’m getting the result as:
(array([2.29239839, 2.26938029, 2.25877423, 2.25559929, 2.25846445,
2.26670267, 2.27794598, 2.28892255, 2.29774307, 2.30384135,
2.30707076, 2.30747149, 2.30555066, 2.30218792, 2.29826336,
2.29444756, 2.29121391, 2.28885976, 2.28748131, 2.28698461,
2.28715699, 2.28774348, 2.28849448, 2.2891958 ]),
array([0.02200684, 0.05321806, 0.08660913, 0.11822268, 0.14836925,
0.17610274, 0.19985402, 0.21907622, 0.23444159, 0.24686324,
0.2570923 , 0.26579143, 0.2735913 , 0.28101168, 0.28840908,
0.29599757, 0.30388675, 0.31209504, 0.32055845, 0.32915964,
0.33776759, 0.34626676, 0.35457151, 0.36263193]),
array([[2.24926578, 2.335531 ],
[2.16507481, 2.37368577],
[2.08902345, 2.428525 ],
[2.02388709, 2.48731149],
[1.96766606, 2.54926284],
[1.92154764, 2.6118577 ],
[1.8862393 , 2.66965266],
[1.85954104, 2.71830405],
[1.838246 , 2.75724014],
[1.81999828, 2.78768442],
[1.80317912, 2.81096241],
[1.78652986, 2.82841311],
[1.76932157, 2.84177976],
[1.75141515, 2.85296069],
[1.73299196, 2.86353476],
[1.71430298, 2.87459214],
[1.69560682, 2.88682099],
[1.67716473, 2.90055479],
[1.6591983 , 2.91576432],
[1.64184358, 2.93212565],
[1.62514468, 2.94916929],
[1.6090731 , 2.96641385],
[1.59354709, 2.98344188],
[1.57845029, 2.99994131]]))
Why is that in that format? I only want a single column of predicted values.
I figured it out. It was showing the arrays of values, upper limit and lower limit. Just used results_ARIMA = results_AR.forecast(steps=24).[0]
Yes, correct! Well done.
I believe it returns point forecasts and a prediction interval.
This tutorial will help:
https://machinelearningmastery.com/make-sample-forecasts-arima-python/
Hello Jason Brwnlee! Congratulations on the article, it is very well explained and easy to understand! I know this is not the purpose of this publication, but I would like to share with you my lines of code, which I adapted from yours, trying to develop the study, but using AutoArima. I have not been very successful at forecasting and am unable to find what is missing so I can reproduce this study with AutoArima. Can you help me?
X = series.values
size = int(len(X) * 0.66)
train, test = X[0:size], X[size:len(X)]
history = [x for x in train]
predictions = list()
for t in range(len(test)):
model = auto_arima(train, trace = True, error_action=’ignore’, surpress_warnings=True)
model_fit = model.fit(train)
output = model_fit.predict(n_periods=len(teste + 7))
yhat = output[0]
predictions.append(yhat)
obs = test[t]
history.append(obs)
print(‘predicted=%f, expected=%f’ % (yhat, obs))
error = mean_squared_error(test, predictions)
print(‘Test MSE: %.3f’ % error)
#plot
pyplot.plot(test)
pyplot.plot(predictions, color=’red’)
pyplot.show()
Thanks.
Perhaps this will help with making a prediction:
https://machinelearningmastery.com/make-sample-forecasts-arima-python/
Can i able to predict the job’s waiting time , i took a dataset from grid5000 and i feel really hard to handle the correlation of the dataset , Can you able to give any suggestion
Perhaps try and compare results of different methods?
hey Jason! when i do a predicition on my arima model it simply shows a straight line and no ups and downs. i tried both exponential smoothing and arima and same.. any ideas? thanks!
Perhaps try scaling the data?
Perhaps try alternate configurations of the model?
Perhaps try other models?
Perhaps compare results to a naive model?
Perhaps the series is not predictable?
ya , its very random data..
It might be a random walk or simply random.
exponential smoothing is working well as well as lstm for time series except when i make a prediction beyond the test data is blank..
Nice work!
i have this from the test file :
test[‘forecast’] = mod_fit.predict(start=1, end=51)
test[[‘Counts’,’forecast’]].plot(figsize=(12, 8)) and that plots fine but when i try to go beyond the size of the test file it doesnt work:
test[‘a’] = mod_fit.predict(start=51, end=81)
test[‘a’].plot(figsize=(12, 8))
what am i doing wrong?
The predict function would take an index at the end or beyond the end of the training set.
Perhaps try using forecast() instead and see examples here:
https://machinelearningmastery.com/make-sample-forecasts-arima-python/
that worked . a little better with arma but the exponential smoothing that i thought should be better cuz no trend or seasonality is a straight line again. thanks for the link- great tutorials!
You’re welcome!
Hi Jason
How to Create a hybrid ARIMA and SVM Model for Time Series Forecasting in Python?
Perhaps feed ARIMA outputs into an SVR model?
Hi Jason, you have used test data in observation and used it further to train the algorithm, so, it might not be that helpful in situations where we have to predict values for a further couple of months without new observations.
Is this correct or am I missing something? If yes, can you give a few suggestions on how to proceed in this case?
Not quite, we are using walk forward validation:
https://machinelearningmastery.com/backtest-machine-learning-models-time-series-forecasting/
More on making out of sample predictions:
https://machinelearningmastery.com/make-sample-forecasts-arima-python/
Hi Jason!
Many thanks for your helpful articles.
In the above article, you set the AR parameter as 5. In my case, the line starts exactly from the dashed line on y-scale. What is AR parameter in that case?
Perhaps your fit model is different?
I haven’t fit any model yet, It is just the beginning where I am plotting the autocorrelation of series to get the value of the AR parameter/lag. In the above article, after plotting the autocorrelation graph, you wrote ‘A good starting point for the AR parameter of the model maybe 5’. My question is ” Did you choose this value from the x-axis where the plot-line enters in the highlighted dashed region?
Exactly!
See this:
https://machinelearningmastery.com/gentle-introduction-autocorrelation-partial-autocorrelation/
Why does this warning come up when i fit the arima model??
ValueWarning: No frequency information was provided, so inferred frequency MS will be used.
% freq, ValueWarning)
I don’t know, perhaps try posting to stackoverflow?
Hello again , sir
Thanks for the suggestion
https://imgur.com/a/H1BJdJL
The auto correlation plot of my data looks like this. Could you please tell me what do I make of this and what should my p and q be according to you? and why?
Perhaps grid search a range of values and discover what works best – it is the most reliable approach I’ve found.
I do not understand why you are doing the
obs = test[t]
history.append(obs)
part in the loop that fits and forecasts ARIMA.?
To add the last observation to the history and make it available to the model for the next one-step prediction.
It is an assumption of the test harness that the prior observation is available prior to making a one step forecast.
Hello Jason,
Did you ever discuss how to predict ETA of production jobs? the jobs might dependent on the other jobs. So before prediction the current job ETA we need to predict the dependent jobs if they are not completed yet.
That sounds like a nonlinear forecast. I recommend testing ml algorithms if possible.
Hi Jason. How to do this in R
def parser(x):
return datetime.strptime(‘190’+x, ‘%Y-%m’)
Perhaps post your question to stackoverflow.
Dear Jason,
Thank you very much for this tutorial. I have got single input single output time series data for which I would like to develop a model. I have 4 different samples (single input-single output time series taken at 4 different happenings of the event). I want to model fit to this data. Should I use ARIMA? How will I handle 4 different samples? Many thanks
Perhaps test different models and discover what works well.
Dear Jason!
I love reading your articles. I wonder if you have written something about classification using CNN?
Thanks.
Yes many examples for time series and text classification, see this:
https://machinelearningmastery.com/cnn-models-for-human-activity-recognition-time-series-classification/
Thank you Jason for such a wonderful explanation.
I am new to time series and have some doubt related to parameter estimation.
I have learnt that the p is estimated from pacf plot and q is estimated from acf plot.
So as per your explanation you have used only autocorrelation which states that lag =5 .But how about MA order which is estimated to 0.Please clarify on the same.
Learn how to configure them manually here:
https://machinelearningmastery.com/gentle-introduction-autocorrelation-partial-autocorrelation/
Great tutorial!
I’m applying an ARIMA model to perform predictions of power in an energy plant. When my time series increases or decreases drastically, my model gives predictions that might be lower than zero or higher than the maximum capacity of the energy plant, which is not physically possible.
Is it possible to configure my model so it doesn’t predict values lower or higher than certain pre-defined thresholds?
Perhaps write custom code to interpret the predictions made by the model instead?
For making a prediction using any model containing residual(MA, ARIMA, etc,) We need actual(True) values, but in real life when we are using the model for forecasting we don’t have them (right?), then how do we generate the residuals to make the predictions ??
Thank you
You make predictions based on the observations that are available. E.g. use past to predict the future.
Hi Jason,
Thanks for your great tutorials and useful posts.
I would like to do stock price prediction with ARIMA model.
After training the model, I would like to do 5 days ahead prediction.
How to do 5 days ahead prediction?
from the following function
predictions = model_fit.forecast (steps=5) [0]
we will get 5 consecutive values such as [8.01553836, 8.02257257, 8.01886069, 7.85799964, 7.91102623].
the fifth value 7.91102623 is the 5 days ahead prediction?
Thank you so much Jason.
You’re welcome.
See this:
https://machinelearningmastery.com/faq/single-faq/can-you-help-me-with-machine-learning-for-finance-or-the-stock-market
Great tutorial!
But I am contineously getting the below error:
py:512: ConvergenceWarning: Maximum Likelihood optimization failed to converge.
Check mle_retvals “Check mle_retvals”, ConvergenceWarning)
I am not sure why it is not converging. I even treid changing solver but no luck.
Any body can please help!
Regards
Vivek
It is a warning, not an error, and you can safely ignore it.
Hi, Jason. I’ve read the article, but I still not sure why did you pick AR coeff. as 5 at the start? Autocorellation shows significance at first 5 lags, but Im not sure I see how it is related to the AR?
This can help choose hyperparameters:
https://machinelearningmastery.com/gentle-introduction-autocorrelation-partial-autocorrelation/
In practice, it might be better to grid search values.
Can we use this method to predict the no. of COVID cases for 1 week/ 1 month ahead making use of total no. of cases for every day for last 2 months.
A simple exponential model via the growth() function in excel can do that. No time series model required.
Despite you are having many comments but I still wanted to tell you your tutorial is great! Thanks for it Jason!
Thanks!
Hi Jason
When i run the first part of the code “def parser(x):
return datetime.strptime(‘190’+x, ‘%Y-%m’)
series = read_csv(‘April-Stata.csv’, header=0, parse_dates=[0], index_col=0, squeeze=True, date_parser=parser)
print(series.head())
series.plot()
pyplot.show()”
I am getting this error
what can be the reason, i searched to debug but no please
5 def parser(x):
—-> 6 return datetime.strptime(‘190’+x, ‘%Y-%m’)
7
TypeError: strptime() argument 1 must be str, not numpy.ndarray
During handling of the above exception, another exception occurred:
Thanks and waiting for reply
You might need to change the way the date-time is parsed in your data file.
How did you use the ACF plot to determine the order of p at the beginning ? Do you not use a PACF plot to determine the order of p and ACF to determine the order of q?
See this:
https://machinelearningmastery.com/gentle-introduction-autocorrelation-partial-autocorrelation/
Hi Jason,
Enjoyed this post, as usual. I believe, AIC and BIC are also good indicators of the ARIMA model fit. (lower the valuve, the better it is). Are there any direct indicators of Box-Jenkins method, built-in into the statsmodels or any other library?
Thanks
Thanks.
Good question, I don’t know for sure, sorry. Perhaps check the API.
Hi. I’m new to phyton and I got this error msg.
C:\Users\HP\Anaconda3\lib\site-packages\statsmodels\tsa\base\tsa_model.py:165: ValueWarning: No frequency information was provided, so inferred frequency MS will be used.
% freq, ValueWarning)
What does this mean?
Looks safe to ignore, or you can try posting/searching on stackoverflow.
Hello Jason,
Thank you for helping a lot of people with your skill. Me in particular learned a lot from you.
I want to ask Jason if you recommend to let ARIMA do the differencing or do the differencing before fitting ARIMA? Does it make a significant difference if I do one over the other or vice versa?
Thank you very much and please continue helping people.
Yes, let ARIMA do the differencing.
Sir, Is ARIMA, CNN-LSTM, SVM, Random Forest applicable for multivariate time series forecasting?
They can be for complex datasets, try them and see:
https://machinelearningmastery.com/start-here/#deep_learning_time_series
i’m always hungry of reading from your site. you rock!
Thanks.
Hi,
In what package can I find the ”mean_squared_error” function?
Thanks,
MF
The scikit-learn library:
https://scikit-learn.org/stable/modules/generated/sklearn.metrics.mean_squared_error.html
Hi there,
I have been stuck for days because I cannot find a way to fit a traditional regression model such as ARIMA giving multiple time series as input.
I have got thousand trajectories positions of different vehicles (xy coordinates for each position). Let’s say each sample (trajectory) is composed of 10 positions. It means I have got 10*N different time series (N is the total number of samples).
I want to fit the model with all samples for x coordinates and then predict the future position of any new trajectory that I give in input.
Then I plan to do the same with another model for y coordinates.
I found someone on github who has got the same issue https://github.com/statsmodels/statsmodels/issues/4275 but no one was able to help him.
Can someone help me please?
Thank you in advance for your support!
Best regards,
Perhaps use an sklearn model and this function to prepare the data:
https://machinelearningmastery.com/convert-time-series-supervised-learning-problem-python/
Thank you for your answer Jason!
What I do not figure out is that one have to give sklearn models a sequence of observations as a list or a numpy array. But, in my problem, I do have multiple parts of trajectories from different vehicles. If I create a list with all trajectories of all vehicles, the data will be completely mixed up and the model will not be able to fit these data.
What I want to demonstrate is that a number of time series can be (or cannot be) modeled with a single model for my problem (i.e. the same parameters work for all the time series). I want to fit them all simultaneously.
Do you think it is possible to resolve the problem I am describing for multiple trajectories (having different length) from multiple vehicles using traditional regression model?
Do you think I have to assign each object a different variable, take trajectories of same length in a fixed window of observations (for example the 10 last values) and give these data to a sklearn model?
Thank you again
Perhaps start with a strong idea of what you want to learn/predict.
E.g. single entity, across entities, etc. Then design data/model around that.
I want to forecast the 10th position of an object. To do that, I created windows of the 40 last positions for all vehicles. But now, I do not understand how to transform my dataset (thousands of trajectories, 40 positions per trajectory) to give to the model using statsmodels…
Consider I am only working with the x coordinate for the moment (I want to create one model for x coordinate and one for y coordinate).
If I understand correctly, the code I linked previous will do this for you:
https://machinelearningmastery.com/convert-time-series-supervised-learning-problem-python/
May I ask you Kevin if you found the exact solution to your problem? I am also having the very same issue. Thanks a lot
What is the tuple returned by the model_fit.forecast() method? Statsmodels documentation is really poor… They just say it is the predicted values but does not explain what each dimension represent. What does the method return different values?
Contains predictions for each step and the prediction interval for each step (upwer and lower).
I am working on Project of prediction and forecasting of pharmacy store sales based on past sales data. Its more likely to forecast future sales , so does ARIMA MODEL is suitable for such according to you ? Whats your view on this? How can I work on this? Any links or suggestion plz.
I recommend testing a suite of different models and even a naive model and discover what works best for your dataset.
Thx Jason!
If I want to predict the recovery of the air travel industry for the following 12 months by predicting the flight passenger data.
May I know how to make the time series with abrupt changes(Covid-19) stationary before using ARIMA? (as first-order differencing isn’t working)
What other time series model will you suggest if it remains non-stationary?
Thanks!
Not sure that case is predictable. But what do I know.
You might want to explore nonlinear models that also take multiple input variables:
https://machinelearningmastery.com/start-here/#deep_learning_time_series
I am working on project to predict ground water level on post ground water level dataset, does Arima model is suitable or there is another model more suitable than Arima model for ground water level ?
any link or suggestion??
thanks!!
past ground water level dataset****
I recommend testing a suite of techniques and discover what works best for your dataset.
Perhaps this will help:
https://machinelearningmastery.com/time-series-forecasting-methods-in-python-cheat-sheet/
Hello Jason,
Thanks a lot for your article, it’s very informative.
Do you know how can I have 2 dimensional input instead of one dimensional?
I have x,y coordinates of a robot and I would like to predict its position after K steps.
Thanks so much
You’re welcome.
Yes, you will need to use a different model:
https://machinelearningmastery.com/time-series-forecasting-methods-in-python-cheat-sheet/
Thanks a lot for your answer.
Can you please refer me to the model that could take a 2 dimensional input (x,y) into account?
The VAR/VARIMA etc linear models are a good start.
hi Jason,
Just as a feedback. Mainly because you are able to answer challenger questions on the comment section, you are gaining my full trust. Not sure if there are many tested sources like yours. so pls. keep-up good work!
I hope you provide some Vector autoregression (VAR) use cases to utilize external features as well. Thanks!
Thanks!
Great suggestion, the example here will get you started:
https://machinelearningmastery.com/time-series-forecasting-methods-in-python-cheat-sheet/
Yes. I have already benefited greatly from the cheat sheat for VAR and VARMA. there are some details that require deeper understanding particularly tho. particularly in selecting features (as exog or endog, and select correlated ones.) and also correctly forecasting (with the right transformation,etc.)
Great!
Hi and thanks for sharing so many tutorials,
In the dev there’s something I don’t understand.
obs = test[t]
history.append(obs)
Using real values to feed the model is weird. Predict known values is a test-case, but in a use-case you don’t have the value to predict.
For me the dev sould be:
history.append(yhat)
Then the plot becomes less attractive.
This is called walk forward validation and is the standard way for evaluating time series forecasting models.
You can learn more here:
https://machinelearningmastery.com/backtest-machine-learning-models-time-series-forecasting/
Hi Jason,
I am interested in exploring the association between 2 time series (e.g. attitudes to vaccinatination and vaccination rates).
I am looking at survey data collected on a yearly basis and I have data available for ~17 time points. I am considering ARIMAX to explore my data but I am not sure whether it is the most appropriate tool. A lot of studies using ARIMAX seem to have more granualr data (monthly or quarterly). I also read you would need ~50 observations for aggregated data and this is not my case… I am new to this though so I would welcome some expert opinion.
Perhaps try it and compare results to a naive persistence model.
I think there is a fault in your code,
why are you using test observation, in below script
for t in range(len(test)):
model = ARIMA(history, order=(5,1,0))
model_fit = model.fit(disp=0)
output = model_fit.forecast()
yhat = output[0]
predictions.append(yhat)
obs = test[t]
history.append(obs)
print(‘predicted=%f, expected=%f’ % (yhat, obs))
error = mean_squared_error(test, predictions)
if i dont have test dataset and i want to predict the train dataset only, then i should use
obs = predictions[t] and not test[t]..
It is called walk-forward validation and is the preferred approach to evaluate time series forecasting models.
You can learn more about it here:
https://machinelearningmastery.com/backtest-machine-learning-models-time-series-forecasting/
Thanks for your prompt response,
Jason, i only have 1000 data points(in my training set) and i need to predict the next say (1001 to 10000) values. How can i use your code for the same?
You can fit your model on your data, then call forecast() and specify the number of steps to forecast.
So, I have this time series made of internet traffic. Initially, it was monthly data but I have taken samples from it based on the time it was registered on the network (weekly, daytime (from 05:58 – 17:59, evening(from 18:00 – 23:59)). Essentially I want to assess how sampling affects the series by quantifying their differences so that I can come up with some confidence interval of what one should expect if they just had lets day weekly data instead of the monthly traffic based unique source IP(this is my variable of interest). is this doable with arima?
I have tried a lot of the models(https://machinelearningmastery.com/time-series-forecasting-methods-in-python-cheat-sheet/) but each of them is giving values that I can’t really work with. What would suggest I do to quantify the differences between these subsamples in the series and what the best approach is. I am assuming if none of them is working I must be doing something wrong.
How can I get the confidence interval from this problem while considering all the statistical values that would quantify the differences between the main series and its sub samples?
The forecast() function will calculate a confidence interval for you, here’s an example:
https://machinelearningmastery.com/time-series-forecast-uncertainty-using-confidence-intervals-python/
Thank you for your response, You have answered the question in part:
Other than using models or ML, what other ways can one use to quantify(using well know statistical methods) the differences between two or more time-series?.
In other words without using ML or statsmodels how can I quantify the differences that exist between times series?
Sorry, I don’t have tutorials on statistical methods for comparing time series, I cannot give you a good off the cuff answer.
Couldn’t the train/test sets also be made using sklearn’s train_test_split?
Not really, unless you disable shuffle.
Hey Jason, Great tutorial. Literally saved me for my Masters’s Project. I have followed the same steps as yours but with my dataset and was able to compile it successfully in the Jupyter notebook. But my issue is my Website is made in the flask(python) and want to deploy this time series forecast into it. Any help on how to do it is highly appreciated.
I’m happy to hear that!
Perhaps this will help:
https://machinelearningmastery.com/faq/single-faq/how-do-i-deploy-my-python-file-as-an-application
Could we apply ARIMA for prediction of a disease…
Perhaps try it on your data and see.
Hi Jason,
When running the above code, you get an error that says:
“FutureWarning: statsmodels.tsa.arima_model.ARMA and statsmodels.tsa.arima_model.ARIMA have been deprecated in favor of statsmodels.tsa.arima.model.ARIMA (note the . between arima and model) and
statsmodels.tsa.SARIMAX. These will be removed after the 0.12 release.”
When you then modify the code as was mentioned above to
statsmodels.tsa.arima.model.ARIMA
you get another error later on that says :
\Anaconda\lib\site-packages\statsmodels\tsa\base\tsa_model.py:524: ValueWarning: No frequency information was provided, so inferred frequency MS will be used.
—-> 3 model_fit = model.fit(disp=0)
TypeError: fit() got an unexpected keyword argument ‘disp’
When you remove the disp=0 option, you finally get some results, but estimated coefficients are totally different from what you have in your book.
Do you have an updated code in order to match the above results without encountering the deprecated warnings?
Thanks, I will investigate.
Here is the output of what happens when you modify the ARIMA library to the new one.
As you can see, the coefficients are no where near what you have and the mean of the residuals is now almost 22 instead of -5.
Can you please help?
SARIMAX Results
=======================================================================Dep. Variable: Sales No. Observations: 36
Model: ARIMA(5, 1, 0) Log Likelihood -198.485
Date: Thu, 03 Dec 2020 AIC 408.969
Time: 13:05:39 BIC 418.301
Sample: 01-01-1901 HQIC 412.191
– 12-01-1903
Covariance Type: opg
==============================================================================
coef std err z P>|z|
——————————————————————————
ar.L1 -0.9014 0.247 -3.647 0.000
ar.L2 -0.2284 0.268 -0.851 0.395
ar.L3 0.0747 0.291 0.256 0.798
ar.L4 0.2519 0.340 0.742 0.458
ar.L5 0.3344 0.210 1.593 0.111
sigma2 4728.9610 1316.021 3.593 0
# summary stats of residuals
print(residuals.describe())
count 36.000000
mean 21.936144
std 80.774430
min -122.292030
25% -35.040859
50% 13.147219
75% 68.848286
max 266.000000
If one wanted to make predictions in the future, where there is no test data to test against, should one change this
history.append(test[t])
to this
history.append(predictions[t])
So that ARIMA is applied on the predictions themselves?
And also, I’m assuming change the train_size from
int(len(X)*0.6 )
to
int(len(X))
So that ARIMA is applied on the entire set of data to make its prediction into the future?
Let me know if that is right. Thank you.
Is there a better way to make the prediction into the future? Thank you.
This will show you how to make out of sample predictions in the future:
https://machinelearningmastery.com/make-sample-forecasts-arima-python/
Thank you for your response.
I’m not sure why I didn’t receive a notification for the response in my email.
My site does not send any notifications.
Hi Jason,
Thanks for the tutorial !! It was very helpful.
Can you suggest how can I forecast for a dataset with multiple time series? I have a dataset with 1000 client codes having historical monthly revenue. I need to forecast revenue for all the clients.
Thanks in advance.
Yes, this is called a multivariate time series forecasting problem, and you can see many examples here:
https://machinelearningmastery.com/start-here/#deep_learning_time_series
Also here:
https://machinelearningmastery.com/time-series-forecasting-methods-in-python-cheat-sheet/
Can i use ARIMA for Walmart sales prediction problem….where i have to consider the holidays….or shall i need to use SARIMAX
Perhaps try it and see.
Hi Jason
Excellent tutorial!
I have question:
I’m trying to develop an ARIMA model such as yours to predict a stock price. The procedure done is exact the same as yours, but when plotting the results, my predictions are practically the same than the step before.
Do you know how can I fix it?
Thanks!
It is because stock prices are not predictable:
https://machinelearningmastery.com/faq/single-faq/can-you-help-me-with-machine-learning-for-finance-or-the-stock-market
Hi …… thanks for all
In university books we find
AR(p) —To determine the value of p we use- PACF
I(d) ———difference for stationary
MA(q)—–To determine the value of q we use-ACF.
But you used ACF to extract p = 5 and it should be q = 5, not p. Please explain more
Perhaps this will help:
https://machinelearningmastery.com/gentle-introduction-autocorrelation-partial-autocorrelation/
In practice, I find a grid search is more effective:
https://machinelearningmastery.com/grid-search-arima-hyperparameters-with-python/
Hello Jason,
Thanks for sharing this. Can the Arima model be used for failure count predictions?
Thanks
Maybe, perhaps try it and see.
For predicting counts, it might be worth searching for a model designed for this use case. Perhaps check the literature.
Hi Jason, Thanks for posting this excellent article. I am a big fan of your articles.
I have one doubt. How to check if our data is seasonal or non-seasonal. Everyone says that if the data is seasonal we can use SARIMA model. But how do I check if the data is seasonal or not?
Is ETS the only way to check if data is seasonal/non-seasonal?
Also, how do we decide if we have to consider the seasonal components too?
Thanks in advance.
You’re welcome.
You can plot the data, review the plot and identify seasonality and trend.
Or you can use a statistical test to check if the series is stationary or not.
Or you can try modeling the data and assume the presence of seasonality, trend, both or neither and see what model works best.
Dear Sir,
Very nice tutorial.
But i have a question in following line:
model = ARIMA(series, order=(5,1,0))
How the value comes ; 5 for p and 0 for q?
If i replace the p to 1 then also getting same results for forcasting. What am i doing wrong?
Thanks.
You can use ACF/PACF plots or use a grid search to fine the hyperparameter values.
I have examples of both on the blog, perhaps start here:
https://machinelearningmastery.com/grid-search-arima-hyperparameters-with-python/
Hi Jason,
thanks for this post.
I would like to apply ARIMA (or better say VARIMA since I have multiple features) for replacing NaN in my data frame. In particular these NaN are past samples.
Do you have an article or references for the python implemention?
Thanks
Luigi
Yes replacing missing values is called imputation.
A simple approach for time series is to persist the last seen observation.
Alternately, some of these methods may help (make sure they only use past values, not future values):
https://machinelearningmastery.com/statistical-imputation-for-missing-values-in-machine-learning/
yes so far I use the last observation, but I was wandering whether this can be further improved by using VARIMA or even EM algorithm, but I cannot find complete reference for python implementation for those
This might help with VAR:
https://machinelearningmastery.com/time-series-forecasting-methods-in-python-cheat-sheet/
Hi Jason,
Very nice tutorial indeed. When I executed the code (given below), I faced the following difficulty.
series = read_csv(‘D:/Management Books/BSE Index Daily Closing.csv’, header=0, parse_dates=True, index_col=0, squeeze=True)
series.index = series.index.to_period(‘M’)
X = series.values
train = X[1:240]
test = X[241:]
from sklearn.metrics import mean_squared_error
from math import sqrt
history = [X for X in train]
predictions = list()
for t in range(60):
model = ARIMA(history, order=(6,1,0))
model_fit = model.fit()
output = model_fit.forecast()
yhat = output[0]
predictions.append(yhat)
obs = test[t]
history.append(obs)
print(‘predicted=%f, expected=%f’ % (yhat, obs))
rmse = sqrt(mean_squared_error(test, predictions))
print(‘Test RMSE: %.3f’ % rmse)
pyplot.plot(test)
pyplot.plot(predictions, color=’red’)
pyplot.show()
This is what is showing after running the code. Please let me know how to fix it.
File “”, line 11
model = ARIMA(history, order=(6,1,0))
^
IndentationError: expected an indented block
It looks like you copied the code and did not preserve the white space.
This will help you copy the code correctly:
https://machinelearningmastery.com/faq/single-faq/how-do-i-copy-code-from-a-tutorial
Hello Jason,
As part of my master’s thesis I am applying an ARIMA model, this tutorial helps a lot. However, I have one difficulty. My test data set has 752 observations, however the predictions vector that is created as part of the ARIMA model contains 772 observations. So there are 20 predictions too much and I can’t calculate a RMSE either. Do you know what could be the reason for this?
Here are the most relevant lines of my code:
# Define that the dataset will be split into 67% training data and 33% test data
Traindatalen=math.ceil(len(Close)* .67)
print(Traindatalen)
# Split the data into train and Test Data
x_train = Close[0:Traindatalen]
x_test = Close[Traindatalen:]
# fit ARIMA Model
model = ARIMA(x_train, order=(2,1,1))
model_fit = model.fit()
# Print Model summary
print(model_fit.summary())
# Transform x_train and x_test into desired Data format
x_train_array=x_train.values
x_test_array=x_test.values
# Create list of x train values
history = [x for x in x_train_array]
# Establish list for predictions
predictions = list()
# Forecast
for x in range(len(x_test_array)):
model = ARIMA(history, order=(3,1,1))
model_fit = model.fit()
output = model_fit.forecast()
yhat = output[0]
predictions.append(yhat)
obs = x_test_array[x]
history.append(obs)
print(‘predicted=%f, expected=%f’ % (yhat, obs))
Thanks in advance!
Greetings, Sascha
Perhaps this will help:
https://machinelearningmastery.com/regression-metrics-for-machine-learning/
Thank you for the link.
I am familiar with the calculation of the RMSE. The problem is not in the calculation of the RMSE, but in the fact that my ARIMA model makes 772 predictions, although it should make only 752. My test data set has only 752 observations. Even though I write in the for-loop “for x in range(len(x_test_array))” , not 752 predictions are made but 772.
So it makes 20 predictions too many and I can’t find the error in my code. So I would compare 772 predictions with 752 actual values, which makes no sense.
Have you ever heard of this problem and possibly how to fix it?
You’re welcome.
Perhaps there is a bug in your implementation or one of your assumptions is incorrect. I recommend carefully inspecting your code for the cause of the fault.
Thanks for your help. I found if I don’t use diff function before like:#df_diff = df_train_test.diff(1), when I use ARIMA model, and there was a error that ‘exog contains inf or nans’. indeed, when we did diff function, the first data will be Nan in result. but how to fix it when I directly use parameter in ARIMA model to diff origin data? thanks !
That is odd, perhaps double check your data is loaded as you expect.
Thanks for your ARIMA program. I tried to apply the ARIMA model to a data in my own workspace. However, I encountered the following error. My data is a long data, daily data from 1963 to this day. How can I apply the ARIMA model to this data?
from pandas import read_excel
from pandas import datetime
from matplotlib import pyplot
def parser(x):
return datetime.strptime(x, ‘%d-%m-%Y ‘)
series = read_excel(‘/content/data.xlsx’, header=0, parse_dates=[0], index_col=0, squeeze=True, date_parser=parser)
print(series.head())
series.plot()
pyplot.show()
TypeError: strptime() argument 1 must be str, not datetime.datetime
Perhaps try removing the date/time column from your data when loading it?
Hi Jason
When making predictions against a training set, the forecast looks relatively close to the actual data. however, when i make a forecast on data outside of the training set, the forecast looks more like a trend line and doesnt have the same spikes as the test data does
Perhaps the model is not a good fit for the data?
Thanks jason, i think your right. I just wanted to be sure it wasnt something i am doing wrong.
Thanks.
Hello Jason,
Thanks for the article.
If I want to genereate a sample of an ARIMA(7,1,9) from scratch (i.e. I have no data to fit the model), how can I do? I know that for an ARMA process I can use the method ‘generate_sample’. But I didn’t find the same thing for the ARIMA class.
Sorry, I don’t have an example of coding an ARIMA from scratch, I recommend using the statsmodel API.
Hi Jason,
I realise under your example of rolling forecast ARIMA model, you didn’t include time variable into your ARIMA model but just plain sales values. Can you do an example for the ARIMA model to take into consideration of the time variable as well? Thanks
Thanks for the suggestion, perhaps in the future.
Hello Jason
Ive used many of your tutorials on using and improving ARIMA models for a Univariate time series one step ahead prediction.
So far the best results come from p,d,q values of 0,1,1 but then all its doing is using values from the previous time step for the next prediction. Is there anyway to fix this problem?
Perhaps try alternate data preparation, alternate model types, and alternate configurations in order to discover what works well or best for your dataset.
Hello Jason,
Thank you for the excellent tutorial!
I had a question regarding the “ARIMA Rolling Forecast Line Plot” at the end of the tutorial.
I was wondering what the labels are for X and Y axis. I understand the Y axis are the actual values, but I was a bit lost about what the X axis represents?
Apologies if this is a repeat question, I wasn’t able to find it in the comments.
Thanks in advance!
In the plot “ARIMA Rolling Forecast Line Plot” I believe x is the forecast time step and y is the units of the target variable being predicted.
Hello Jason,
what are the best encoding techniques that I can use for the ARIMA model?. Consider I have a categorical feature with the 100-200 unique values.
Adding to the previous point, All the unique values have no inherent order(Nominal data).
Understood. Perhaps try some machine learning algorithms and one hot encode your variable.
Thanks for the reply Jason,
By “try some machine learning algorithms” you mean that, convert the time series into supervised learning and then apply some kind of Random Forest algorithms?
Yes.
I don’t think ARIMA is appropriate for categorical variables.
Nevertheless, perhaps try an ordinal encoding and see what happens.
Ordinal Encoding doesn’t work in my case because the categorical variables have no inherent order. For example, my categorical value will be something like zip code or state name.
Understood, you can apply it anyway and review the result as a baseline – e.g. anything “good” would do better.
Thank you so much, Jason.
You’re welcome.
Very nice article.can we combine arima,cnn,lstm model and use for prediction…will it fetch better result?
It really depends on the problem, perhaps try it and see.
Hello Jason,
I have a question that may sound silly: What would be the approach to link a time series to an element in a set of possible outcomes ? not predicting but picking
Thank you in advance for any information/help we can provide on that subject
Regards
Sounds like time series classification.
Perhaps start here:
https://machinelearningmastery.com/start-here/#deep_learning_time_series
Hi Jason
This is very helpful. I have a question! I work on data that similar to your data but I can not know how to select p,d,q parameters???
You can use a grid search:
https://machinelearningmastery.com/grid-search-arima-hyperparameters-with-python/
Hi Jason,
I have the rolling ARIMA forecasting models functioning for my data, but how do I use this training method to then predict years in the future? I tried to use model_fit.forecast, but it gives me nearly constant values for every step, unlike what should be expected.
Thanks so much for this article- it is so helpful!
Perhaps the model or config is not a good fit for your dataset?
If I want to forecast sales to 5 days? What parameter should I modify? It is not clear to me
Call forecast() and specify 5 steps, e.g. model.forecast(steps=5)
This will help:
https://www.statsmodels.org/stable/generated/statsmodels.tsa.arima_model.ARMAResults.forecast.html
Hi
Thank you for your attention from beginning.
I am a beginner in Python and machine learning .I have a practice that is on messenger or Twitter data and I have to build a model for predicting the posting time of a channel’s next post by giving a specific time on a specific day of the week.
For example, we give the model “seven o’clock on Wednesday” and expect it to return us the time to send the next post into “minutes”
Did you work on this example or did you have or see an tutorial video or example about it ?? To guide me. Preferably with pyspark or with Python
please woulde you help me. I have only 2 days that do this practice.
Do you think this can be done with k-means or Logistics Regression, Naive Bayes, Decision Tree?
I have separated post time, comments and hashtags.
But I have no idea at all about it for continuing this work.
Thank you for your guide and comment.
We don’t have a tutorial on this specific topic, but may be this can help: https://machinelearningmastery.com/start-here/#process
Think you for your help
Thank you!
Give me an example for Fitting an ARIMA model for a univariate time series model
The example code on this post is not enough?
Hi Jason. I want to choose a best Investment option in Gold Bonds using forecasting model for predicting future returns of the bond. Please guide me with best model and code.
As a toy example, you can follow the sample code in this post. But you may want to see if some preprocessing helps. For example, as it is bonds, do you want to model the yield or model the price? That gives you different perspective and you may have a better model one way or the other.
Hi Jason,
Your blog is truly an inspiration and a real help to newbies like me.
I had a question on ARIMA.
I want to forecast height at age 10 based on data collected in the past. My dataset has height for different ages(0-6 year) for 100 different individuals. Can I apply ARIMA on such a dataset? if yes, how?
You better check if it makes sense from a biology expert. Assume it is so, then you just follow the steps to find the best fit parameters. You may need to use grid search for the optimal (p,d,q) parameters for the ARIMA.
for the following dataset what will be the index format, please help me.
year Data
1971-1972 100
………….. ………
2015-2016 1200
2016-2017 1500
2017-2018 1400
2018-2019 1300
2019-2020 1600
2020-2021 1700
I believe that would be string! So you can’t use it directly, but you need to clean it. For example, take first four character of the year column and convert it to integer before applying ARIMA.
Hello
thanks for this great article
you are using test set values to predict next steps
obs = test[t]
history.append(obs)
in real world problems we should use last prediction values for next step forecasting. is this true?
Yes, correct.
Hi,
Why didn’t you split the dataset into Training, Validation and Test set ? Why only Training and Test set ?
Because the example in this post took a short-cut without comparing different models. Please see this post for what the training, validation, and test set supposed to be: https://machinelearningmastery.com/training-validation-test-split-and-cross-validation-done-right/
Hi, great tutorial!
I’ve also read your tutorials on time series forecasting using neural networks, e.g.:
https://machinelearningmastery.com/how-to-develop-lstm-models-for-time-series-forecasting/
I am trying to compare the performance of an ARIMA model with more advanced neural network models. I used the auto_arima function in the pmdarima package to estimate the optimal lags, order of differencing and moving average parameters which I then store and use in the walk-forward procedure.
However, I was wondering whether the approach in this tutorial is directly comparable with the “sliding window” approach taken in the neural network tutorials. For example, if it turns out that the optimal lag value is p=10, would that be equivalent to setting the input time steps to 10 in the sliding window neural network models?
One last thing, how would this work with an ARIMAX model? I know you can add the exog option to the ARIMA function, but I am not sure how to reshape the exogenous data matrix. Do I need to create an n-dimensional list of arrays (where n is the number of features)?
Hope you see this and many congratulations on your website, really useful stuff!
CS
I am not so confident that 10 you got there means 10 you should use here. After all there are two different models. But I am not saying unrelated, because that might mean some hidden information can last up to 10 lags, just it is not so easy to confirm.
For ARIMAX, I think it is best to see examples from the documentation: https://www.statsmodels.org/dev/examples/notebooks/generated/statespace_sarimax_stata.html
Hey, thanks for your reply! I had a look at the documentation you linked on SARIMAX but it does not address how to do out-of-sample forecasting with the one-step-ahead method as explained in this tutorial. I’ve tried to modify the above loop for walk-forward-validation to include exogenous variables
predictions = list()
for i, t in zip(test_endog, test_exog):
model = SARIMAX(train_endog, exog=train_exog, order(order),enforce_stationarity=False)
model_fit = model.fit()
output = model_fit.forecast(exog=test_exog[t])
yhat = output[0]
predictions.append(yhat)
endog_obs = test_endog[i]
train_endog.append(endog_obs)
exog_obs = test_x[t]
train_exog.append(exog_obs)
However, it keeps throwing me this error:
TypeError: list indices must be integers or slices, not list
Would you happen to know how to fix it?
Thanks again
From your code, it seems to me it is wrong to do “for i, t in zip(test_endog, test_exog)” while later use “test_exog[t]” and “test_endog[i]” because i and t are already elements of test_endog and test_exog.
Yes, you are right! Just removing one of the two indices works:
predictions = list()
for i in range(len(test_endog)):
model = SARIMAX(train_endog, exog=train_exog,
order(order),enforce_stationarity=False)
model_fit = model.fit(disp=False)
output = model_fit.forecast(exog=test_exog[i])
yhat = output[0]
predictions.append(yhat)
endog_obs = test_endog[i]
train_endog.append(endog_obs)
exog_obs = test_x[i]
train_exog.append(exog_obs)
Thank you very much for your help! All the best
Good to hear that!
what if I have another small data and want to predict the sales of the next 5 records from the end of my data.
Simplest way to do that would be to predict for next record, then reuse that and predict another one. Repeat for 5 times to get 5 records.
Could you be more specific when choosing “lag”, please…
Sorry, cannot. Usually lag is chose by trial-and-error to get the best score (e.g., AIC and BIC). Try to read the link on Box-Jenkins methodology for how people determine the different ARIMA parameters.
“Running the example, we can see that there is a positive correlation with the first 10-to-12 lags that is perhaps significant for the first 5 lags.”
What I saw is 0-to-12 is positive, why choose 10-to-12?
And I’m a little bit misunderstood when choosing the first 5 lags.
Here it means lags 1 to 10 are positive (can’t be very accurate because the autocorrelation coefficient is varying with the input data) while lags 1 to 5 are significantly positive.
Hi,
Why there is no Validation Data in the above example? Only Training and Testing Data?
In train-validation-test split, validation is to tell how good your model is. If you don’t have any models to compare against each other, it is not necessary to use validation. Or put it the other way, if you think the test set is good enough to compare models, you don’t need the validation. This is especially common in case of time series problems, which the data are scarce.
Hi, nice guide. I have a question, how i can make a future prediction beyond the test period, Thanks
The predict function can do out-of-sample prediction.
Hi Jason,
I need a few clarifications regarding ARIMA and Exponential(ES) smoothing. Like machine learning model, in ARIMA also we are splitting the data into train and test and fitting the model then error metrics are used exactly like ML. so can we call these ARIMA and ES models are statistical machine learning models?
Yes.
Hi Vanitha…ARIMA and ES are considered “classical” or “statistical” methods in contrast to “machine learning” methods. The following resource provides an excellent overview and comparison of these two categories applied to time series forecasting.
https://machinelearningmastery.com/findings-comparing-classical-and-machine-learning-methods-for-time-series-forecasting/
Thank you for ur reply.
hi Jason,
In the Rolling forecast method, you are appending the actual test value to the training set in each iteration. In a real-time scenario, we will not get future data. so we need to append the predicted value in each iteration right?
Correct.
Hi Karthi…You are correct! Let me know if you have any further questions.
Regards,
Hi,
Thanks for the article. I have a query. I have a dataset which was not stationary, so I did the first order differencing and performed the Augmented Dickey Fuller and then found the series to be stationary. After that I performed the Auto ARIMA, to select the model with the lowest AIC value. I found one. But we need to check for the residuals too. For that I performed the Ljung Box Test to determine whether the residuals are auto correlated or not. But I found that the p-value for the Ljung Box test is quite less than 0.05 whereas it should have been more than 0.05. Please let me know how to proceed. Any help will be appreciated.
Regards
Tarun
Hi Tarun,
The following would be an excellent place to start in terms of confirming the stationarity of datasets.
https://machinelearningmastery.com/time-series-data-stationary-python/
train, test = df99[0:size], df99[size:len(df99)].reset_index()
as
Hi Jason,
Great article as usual. It really helped me also.
One tiny code issue I encountered:
The code block under “Rolling Forecast ARIMA Model”
has:
obs = test[t]
I think it should be:
obs = test[size + t]
The test data array does not have a zero element.
Thanks for all your great work,
Andrew
Thank you for the feedback, Andrew! Keep up the great work!
Hi Jason,
Thankyou for the great article.
I have two questions:
1. When we have to predict for multiple steps ahead of our data range, we might not have testing data for it. The one step forecast method is viable for accuracy while testing, but when forecasting for multiple steps ahead of the data range it would be missing. In this case, should we append predictions and continue doing one step forecasts? Or use 12 steps in forecast (for each month an year) and avoid appending previous step predictions?
2. Does Grid search cover majority of the areas for calculating p,d,q values? I cannot do ACF, PACF as i have to forecast 100s of products.
Many thanks.
Regards.
You are welcome, Saad!
For 1., your approach is a reasonable one.
For 2., A grid search would work well for establishing suitable p,d,q values.
Why does increasing the training set decrease the error a lot?
Hi Hnry…by including more data for training, the model has more opportunity to “optimize” the contributing weights.
Hi Jason,
Thanks very much for your page, it is really informative.
One thing I have seen after trying your example out however is the evaluation metrics and how they actually get worse when you increase the training set which I would think to be typically incorrect?
For example, your train test split is 66:34, and you get a RMSE of 89. I increased the split to 70:30 and the RMSE increased to 95. Similarly, if I decreased the split to say 50:50 which is unusually low, the RMSE decreases to 87 and this happens for all increasing/decreasing values.
Would you be able to possibly explain why this might be?
Thanks very much for your help
Hi Henry…The amount of training data that you need depends both on the complexity of your problem and on the complexity of your chosen algorithm.
I provide a comprehensive answer to this question in the following post:
How Much Training Data is Required for Machine Learning?
Hi Jason,
Thanks very much for your reply.
I read this post however I still don’t quite understand how it answers my question. Because I used the Shampoo dataset from this example for my tests and kept the total sample constant, only varying how much I split the train and test data so I don’t think the ‘total’ amount of data trained is the problem?
My confusion is coming from when we obtain the train, test ratio so that the training data is much more than the test data. For some reason the accuracy decreases a lot even though typically, we know that training too much training data compared to test data would lead to overfitting and high accuracy result?
Many thanks,
Henry
Hello Sir, Thanks for this excellent resource on ARIMA, as well as the grid search for hyperparameters for ARIMA.
Your explanation on choosing ‘p’ was great. I request you to kindly give some simple pointers on what ‘d’ and ‘q’ physically mean, or how they can be chosen, as a first guess. It will be great to have good physical understanding of p, d, q before grid search can be adopted as a range around them.
Thanks a lot!
Hi Priya…The following resource goes through a practical example of how to use and interpret these parameters:
https://www.quantstart.com/articles/Autoregressive-Integrated-Moving-Average-ARIMA-p-d-q-Models-for-Time-Series-Analysis/
Another doubt Sir.
For the rolling forecast, aren’t we supposed to append the newest data point as well as remove the earliest data point, in order to keep the most recent, but SAME size “training data”?
Kindly clarify this doubt. Thank you very much.
Hi, Jason:
Does ARIMA require normally distributed input data?
Thanks in advance!
Hi,
I’m trying to use arima from the statsmodel package in python to fit and perform an out-of-sample prediction. First I found the order=(i,d,j) considering training data. With the parameters defined, I perform a for loop with the size of the test data to forecast for an out-of-sample period. At each iteration I add the t position of the test data to the training data (eg hist.append(test[t])) and then plot the test and prediction data to perform a comparison. But it looks like the prediction is off, what I’m suspecting is that maybe the function is predicting from iteration 0 to the last position of the train data instead of predicting out of the training sample. Has anyone had a similar problem?
My code is very similar to your post:
def previsao_arima(i,d,j,hist,validation):
predicted_mu = list()
prediction = list()
for t in range(len(validation)):
#arima
fit_arima = smt.ARIMA(hist, order=(i,d,j)).fit(method=’mle’, trend=’nc’)
output_arima = fit_arima.forecast()[0][0]
yhat_arima = output_arima #[0]
predicted_mu.append(yhat_arima)
obs = validation[t][0]
hist.append(obs)
prediction.append(predicted_mu[t])
print(‘prediction=%f, validation=%f’ % (prediction[t], obs))
return prediction
Hi…Please simplify your question so that we may better assist you.
Hi,
I suspect that when using forecast at each iteration of the for loop the prediction does not correspond to a step outside the training sample, but the prediction to the last position of the training vector. I’m thinking that this is happening because when plotting the validation and prediction data, it’s visible that the prediction data follows the behavior of the validation data, but it’s as if the prediction was shifted in one iteration forward, as if it were the shadow of the validation data.
I have the data plotted but I can’t post it here. Is there any way to post the plot? Maybe it’s clearer what I’m talking about.
Are we guaranteed that using forecast gives us an out-of-sample prediction?
How to do time series forecasting in Python?
Hi Ace…You may find the following resource of interest:
https://machinelearningmastery.com/start-here/#timeseries
How to do multiple time series forecasting in Python?
Hi,
Nice article. I have few queries –
1) Is this a one step forecast ?
2) Is the error RMSE a Test one or a Train one ?
I would really appreciate it if you kindly let me know.
Regards
Tarun
Hey Jason,
Can I use this model to predict CPU utilization?
And how do I save this model and use this to predict?
Hi Mag…Theoretically the ARIMA model could be used for this purpose provided the appropriate dataset is available.
Also, the following may be of interest:
https://machinelearningmastery.com/save-load-machine-learning-models-python-scikit-learn/
Appreciate the reply man, thanks
Appreciate the reply. Thanks
Hey James
Amazing post and it’s super useful.
I have tried both your “rolling forecast” and “out-of-sample forecast” method on the test dataset, and I think it has been mentioned by a number of people above:
Rolling Forecast (forecast 1 day then adding back to train dataset then re-train) is much more accurate in my case vs Out-of-sample Forecast (forecast 10 weeks using existing trained model )
Therefore I want to use Rolling Forecast as my standard methodology but I can only forecast for 1 day???
This is not very useful as I want to forecast future 10-weeks but with the accuracy level I achieved in Rolling forecast…
Do you have any suggestion to use Rolling Forecast for longer in the horizon while not having actuals available?
Thanks so much
Hi Thomas…I would recommend implementing a LSTM for this purpose as you have more control over the forecast horizon.
https://machinelearningmastery.com/how-to-develop-lstm-models-for-multi-step-time-series-forecasting-of-household-power-consumption/
Hi James, thanks so much.
I have read through all the relevent post ref LSTM and it seems to much for what I am doing.
My case is literally using a historical Absence actuals to forecast what could the future Absence be.
And during the back testing, the “Rolling ARIMA” model has given me some amazing results.
Unfortunately it’s when there is an “Actual” to gauge it’s error…
So now I am testing:
1. I am using last week’s actuals as “Pseudo Acutals” for next 2-3 weeks
2. I am using past year’s actual for the same time as “Pseudo Acutals” for next 2-3 weeks
Let see how it goes this way to forecast the future when there is no Actual to gauge in each step
Meanwhile if you could give me some other advice on how to use “Rolling ARIMA” when there is no Actuals to gauge in each step, that would be much appreciated!
HI JONSON
Ihave 6 attributes to forcast the next water consumption depending on the current consumption using time series regression ARIMA model.The attributes are
id, month , year, customer type, consumption, population
private
commertial
public
please support and send some related documents in my email.
thank you
Hello,
can u tell me plz what is sarima and what s the difference between arima and sarima
and why we use this models in python??
Hi Uzair…I would recommend the following resource as a starting point:
https://machinelearningmastery.com/sarima-for-time-series-forecasting-in-python/
Hi Jason,
Theoretically, Is an ARIMA model with p,d,q = (0,1,lag_vars) same as an AR model for diff(1) of the variable with same lag_vars?
Hi Sree…Yes, your understanding is correct!
Please how can i save the predicted and actual result in a csv or excel file
I have a question for instance I have time series which is not stationary in nature.
Hence convert into log form but still not stationary. However, after 1 differencing the time series becomes stationary as per adf test. Then should be using acf and pacf on dfferenced data or into an original data for estimation of p and q
Hi Satish…ACF and PACF assume the data is already stationary.
Hello, can I use ARIMA model to forecast GDP and GDP growth of any country?
Hi Akhmadkhon…The following resource may be of interest to you.
https://www.scirp.org/journal/paperinformation.aspx?paperid=116491
Hello James,
Thank you for this post. It’s really helped me out a lot.
I have a question – I followed the steps laid out above and I generated some predictions by iterating through my test set and fitting an ARIMA model on the updated training/history set. I would now like to generate predictions beyond my test set.
https://machinelearningmastery.com/make-sample-forecasts-arima-python/
I noticed you mentioned this other post in a different comment, however, I notice you don’t follow the same steps you did here (i.e., you don’t generate rolling forecasts). You fit the model on the training data and then simply predict x steps into the future.
Is there any way to generate predictions beyond the test set using rolling forecasts? The reason I ask this is because my rolling forecasts are really well compared to my test set, however, once I generate forecasts outside of my test set, the predictions aren’t good at all
Hi Patricio…You are very welcome! We recommend deep learning models for this purpose:
https://machinelearningmastery.com/start-here/#deep_learning_time_series
can you give us any tips on using arima to attempt to predict apple stocks in the future? Me and my team are first time users and would welcome any tips.
Hi Dani…Sorry, I cannot help you with machine learning for predicting the stock market, foreign exchange, or bitcoin prices.
I do not have a background or interest in finance.
I’m really skeptical.
I understand that unless you are operating at the highest level, that you will be eaten for lunch by the fees, by other algorithms, or by people that are operating at the highest level.
To get an idea of how brilliant some of these mathematicians are that apply machine learning to the stock market, I recommend reading this book:
The Man Who Solved the Market, 2019.
I love this quote from a recent Freakonomics podcast, asking about people picking stocks:
It’s a tax on smart people who don’t realize their propensity for doing stupid things.
— Barry Ritholtz, The Stupidest Thing You Can Do With Your Money, 2017.
I also understand that short-range movements of security prices (stocks) are a random walk and that the best that you can do is to use a persistence model.
I love this quote from the book “A Random Walk Down Wall Street“:
A random walk is one in which future steps or directions cannot be predicted on the basis of past history. When the term is applied to the stock market, it means that short-run changes in stock prices are unpredictable.
— Page 26, A Random Walk down Wall Street: The Time-tested Strategy for Successful Investing, 2016.
You can discover more about random walks here:
A Gentle Introduction to the Random Walk for Times Series Forecasting with Python
But we can be rich!?!
I remain really skeptical.
Maybe you know more about forecasting in finance than I do, and I wish you the best of luck.
What about finance data for self-study?
There is a wealth of financial data available.
If you are thinking of using this data to learn machine learning, rather than making money, then this sounds like an excellent idea.
Much of the data in finance is in the form of a time series. I recommend getting started with time series forecasting here:
Get Started With Time Series Forecasting
Hi jason, thanks for the tutorials, it helps me a lot. can you help me with my error? when i follow your steps from
history = [x for x in df_train]
predictions = list()
# walk-forward validation
for t in range(len(df_test)):
model = ARIMA(history, order=(0,1,1))
model_fit = model.fit()
output = model_fit.forecast()
yhat = output[0]
predictions.append(yhat)
obs = df_test[t]
history.append(obs)
print(‘predicted=%f, expected=%f’ % (yhat, obs))
I got some error :
TypeError Traceback (most recent call last)
Cell In[26], line 5
3 # walk-forward validation
4 for t in range(len(df_test)):
—-> 5 model = ARIMA(history, order=(0,1,1))
6 model_fit = model.fit()
7 output = model_fit.forecast()
File ~\AppData\Roaming\Python\Python310\site-packages\statsmodels\tsa\arima\model.py:158, in ARIMA.__init__(self, endog, exog, order, seasonal_order, trend, enforce_stationarity, enforce_invertibility, concentrate_scale, trend_offset, dates, freq, missing, validate_specification)
151 trend = ‘n’
153 # Construct the specification
154 # (don’t pass specific values of enforce stationarity/invertibility,
155 # because we don’t actually want to restrict the estimators based on
156 # this criteria. Instead, we’ll just make sure that the parameter
157 # estimates from those methods satisfy the criteria.)
–> 158 self._spec_arima = SARIMAXSpecification(
159 endog, exog=exog, order=order, seasonal_order=seasonal_order,
160 trend=trend, enforce_stationarity=None, enforce_invertibility=None,
161 concentrate_scale=concentrate_scale, trend_offset=trend_offset,
162 dates=dates, freq=freq, missing=missing,
163 validate_specification=validate_specification)
164 exog = self._spec_arima._model.data.orig_exog
166 # Raise an error if we have a constant in an integrated model
…
455 ‘ shape %s.’ % str(self.endog.shape))
457 self._has_missing = (
–> 458 None if faux_endog else np.any(np.isnan(self.endog)))
TypeError: ufunc ‘isnan’ not supported for the input types, and the inputs could not be safely coerced to any supported types according to the casting rule ”safe”
what should i do with this error? I already searched it in stack overflow but I am still confused about what I should do with my code. Thanks!
Hi Han…Did you copy and paste the code or type it in? Also, have you tried the code in both Google Colab and on your local Python environment?
OMG sorry, I mean James, Jason is my friend lol Sorry
Hi james, thank you for the tutorials. it help me a lot. can u help me with my error? i follow your step until
history = [x for x in df_train]
predictions = list()
# walk-forward validation
for t in range(len(df_test)):
model = ARIMA(history, order=(0,1,1))
model_fit = model.fit()
output = model_fit.forecast()
yhat = output[0]
predictions.append(yhat)
obs = df_test[t]
history.append(obs)
print(‘predicted=%f, expected=%f’ % (yhat, obs))
but I got some error:
TypeError Traceback (most recent call last)
Cell In[26], line 5
3 # walk-forward validation
4 for t in range(len(df_test)):
—-> 5 model = ARIMA(history, order=(0,1,1))
6 model_fit = model.fit()
7 output = model_fit.forecast()
File ~\AppData\Roaming\Python\Python310\site-packages\statsmodels\tsa\arima\model.py:158, in ARIMA.__init__(self, endog, exog, order, seasonal_order, trend, enforce_stationarity, enforce_invertibility, concentrate_scale, trend_offset, dates, freq, missing, validate_specification)
151 trend = ‘n’
153 # Construct the specification
154 # (don’t pass specific values of enforce stationarity/invertibility,
155 # because we don’t actually want to restrict the estimators based on
156 # this criteria. Instead, we’ll just make sure that the parameter
157 # estimates from those methods satisfy the criteria.)
–> 158 self._spec_arima = SARIMAXSpecification(
159 endog, exog=exog, order=order, seasonal_order=seasonal_order,
160 trend=trend, enforce_stationarity=None, enforce_invertibility=None,
161 concentrate_scale=concentrate_scale, trend_offset=trend_offset,
162 dates=dates, freq=freq, missing=missing,
163 validate_specification=validate_specification)
164 exog = self._spec_arima._model.data.orig_exog
166 # Raise an error if we have a constant in an integrated model
…
455 ‘ shape %s.’ % str(self.endog.shape))
457 self._has_missing = (
–> 458 None if faux_endog else np.any(np.isnan(self.endog)))
TypeError: ufunc ‘isnan’ not supported for the input types, and the inputs could not be safely coerced to any supported types according to the casting rule ”safe”
I already searched it in stack overflow but I still confused about what I should do with the code. can you help me figure out whats wrong with the code? thanks!
Hi Jason,
Thanks for the great tutorial!
Do you have example for forecasting out of sample using sarima?
Hey, great tutorial,
ist there also a way to not do a rolling forecast?,
meaning i want to fit() the model just once and then only give it one new data point and get one prediction without changing the model?
Hi Victor…This is a great question! You may wish to investigate deep learning methods to have better control over the fit process.
https://machinelearningmastery.com/start-here/#deep_learning_time_series