
Plotting individual decision trees can provide insight into the gradient boosting process for a given dataset.
In this tutorial you will discover how you can plot individual decision trees from a trained gradient boosting model using XGBoost in Python.
Kick-start your project with my new book XGBoost With Python, including step-by-step tutorials and the Python source code files for all examples.
Let’s get started.
- Update Mar/2018: Added alternate link to download the dataset as the original appears to have been taken down.

How to Visualize Gradient Boosting Decision Trees With XGBoost in Python
Photo by Kaarina Dillabough, some rights reserved.
Need help with XGBoost in Python?
Take my free 7-day email course and discover xgboost (with sample code).
Click to sign-up now and also get a free PDF Ebook version of the course.
Plot a Single XGBoost Decision Tree
The XGBoost Python API provides a function for plotting decision trees within a trained XGBoost model.
This capability is provided in the plot_tree() function that takes a trained model as the first argument, for example:
|
1 |
plot_tree(model) |
This plots the first tree in the model (the tree at index 0). This plot can be saved to file or shown on the screen using matplotlib and pyplot.show().
This plotting capability requires that you have the graphviz library installed.
We can create an XGBoost model on the Pima Indians onset of diabetes dataset and plot the first tree in the model .
Download the dataset and place it in your current working directory.
The full code listing is provided below:
|
1 2 3 4 5 6 7 8 9 10 11 12 13 14 15 16 |
# plot decision tree from numpy import loadtxt from xgboost import XGBClassifier from xgboost import plot_tree import matplotlib.pyplot as plt # load data dataset = loadtxt('pima-indians-diabetes.csv', delimiter=",") # split data into X and y X = dataset[:,0:8] y = dataset[:,8] # fit model no training data model = XGBClassifier() model.fit(X, y) # plot single tree plot_tree(model) plt.show() |
Running the code creates a plot of the first decision tree in the model (index 0), showing the features and feature values for each split as well as the output leaf nodes.
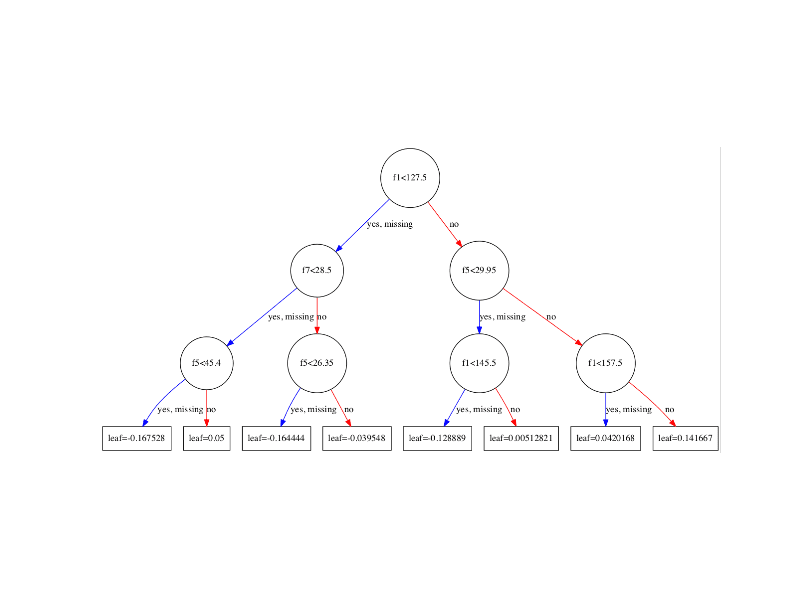
XGBoost Plot of Single Decision Tree
You can see that variables are automatically named like f1 and f5 corresponding with the feature indices in the input array.
You can see the split decisions within each node and the different colors for left and right splits (blue and red).
The plot_tree() function takes some parameters. You can plot specific graphs by specifying their index to the num_trees argument. For example, you can plot the 5th boosted tree in the sequence as follows:
|
1 |
plot_tree(model, num_trees=4) |
You can also change the layout of the graph to be left to right (easier to read) by changing the rankdir argument as ‘LR’ (left-to-right) rather than the default top to bottom (UT). For example:
|
1 |
plot_tree(model, num_trees=0, rankdir='LR') |
The result of plotting the tree in the left-to-right layout is shown below.
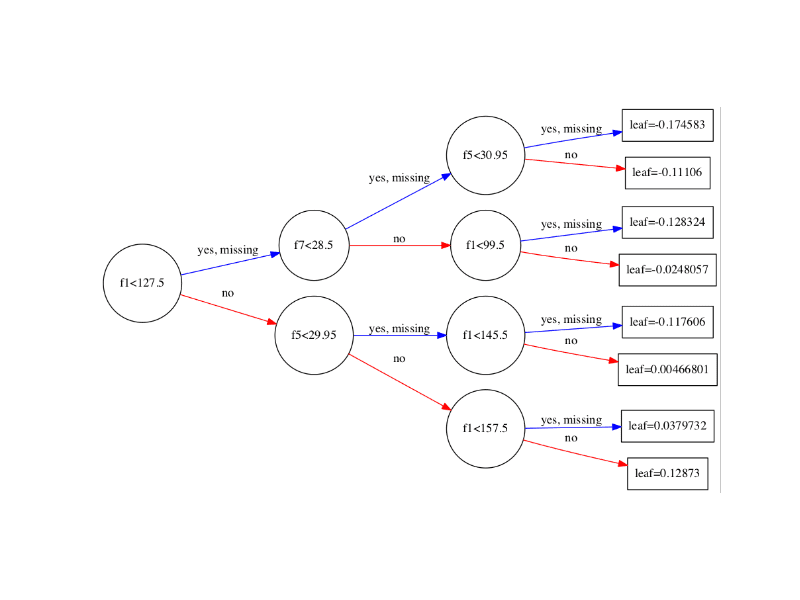
XGBoost Plot of Single Decision Tree Left-To-Right
Summary
In this post you learned how to plot individual decision trees from a trained XGBoost gradient boosted model in Python.
Do you have any questions about plotting decision trees in XGBoost or about this post? Ask your questions in the comments and I will do my best to answer.
Discover The Algorithm Winning Competitions!

Develop Your Own XGBoost Models in Minutes
...with just a few lines of Python
Discover how in my new Ebook:
XGBoost With Python
It covers self-study tutorials like:
Algorithm Fundamentals, Scaling, Hyperparameters, and much more...
Bring The Power of XGBoost To Your Own Projects
Skip the Academics. Just Results.


 Ensemble in Python")
Hi Jason,
Nice one, an exact post using R would be much appreciated, since visualizing the tree is not straightforward.
I have a conceptual question, let’s say the model trained 100 boosted trees, how do i know which one is the best performing tree ? is it by definition the last tree that was trained, since the growth of the last tree takes into account the 99 trees that have already been grown.
Thanks!
Ronen
Thanks Ronen. Sorry, no R examples yet, but perhaps soon.
Interesting question, but not really important as the performance the ensemble is defined by the contribution of all trees in the ensemble. The performance of one tree on the problem does not make sense on the problem as it is working only to correct the residuals of the previous tree in the sequence.
Does that make sense?
Thanks Jason, your answer is perfect.
Glad to hear it ronen.
The importance at least to me stems from the ambition to communicate the model and it’s splits to my client using a chart like the one you showed.
Hi Jason, just like you said, the performance of one tree doesn’t make sense, since the output is the ensemble from all trees. Then why do we bother to plot one tree? And the tree we plot may different from other trees, so if we simply want to give an idea of what the tree looks like, which tree should we plot?
Some developers are very interested in getting a feeling for what the individual trees are doing to help better understand the whole.
Personally, I do not.
Hi Jason!
Do you know how to change the fontsize of the features in the tree?
Thanks!
Hi Jason,
Is there a way to extract the list of decision trees and their parameters in order, for example, to save them for usage outside of python?
Thanks,
Yonatan
Sorry Yonatan, I have not done this.
Let me know how you go.
Hi Jason!
Thanks for your sharing.
I have a question that what does the output value of ‘leaf’ means?
As the example, what does the final leaf = 0.12873 means?
Thank you~
Great question, I don’t recall off-hand, but I would guess it is the ratio of the training data accounted for by that leaf.
I’m sure the doco would make this clearer.
It is definitely not the ratio of training data, since it can have negative values. I’m currently struggling with it as well.
For binary classification, it can be converted to probabilities by applying a logistic function (1/(1+exp(x))) (not -x but just x, which is already weird). But for multi-class, each tree is a one-vs-all classifier and you use 1/(1+exp(-x)).
https://github.com/dmlc/xgboost/issues/1746
“Value (for leafs): the margin value that the leaf may contribute to prediction” (xgb.plot.tree for R but could be valid here too?)
Hi Jason,
A very wonderful tutorial, in your case it is renaming the attributes to it’s own form like ‘f1’, ‘f2’ etc. That is not happening in my case due to which the tree is not clearly visible. Could you please help at it. Also please do tell how to save a full resolution image of the tree.
Perhaps the API has changed.
Sorry, I’m not sure how to make the image larger off-hand.
The following code is able to set the resolution of image and save it to a pdf file
Nice.
Thank you Jason and Frank !
Hi Jason, thanks for the post. I have one question that I have max_depth = 6 for each tree and the resulting plot tends to be too small to read. Is there any way that we can kinda zoom-in zoom out the plot? Thank you.
Not that I’m aware of, sorry.
— xgb version 0.6 —
import xgboost as xgb
xgb.to_graphviz(you_xgb_model, num_trees=0, rankdir=’LR’, **{‘size’:str(10)})
Tuning size you will change size of graphviz plot, though there is no zoom available (to my best knowledge)
As it was requested several times, a high resolution image, that is a render one, can be created with:
xgb.to_graphviz(model)
For me, this opens in the IPython console, I can then save the image with a right click.
Thanks Dennis.
Jason, how do we know red or blue belongs to which class?
Great question.
Off-hand, I would guess that “no” is the 0 class, and “yes” is the 1 class.
Is it possible to get the class / target name in the leaf node?
Particularly for multi-class case…
Can we output the tree model to a flat file ? or it’s only supported to figure it out? Thanks.
You may Anna, I’m not sure off the cuff. I bet there is away, consider looking through the xgboost docs.
Do you know how to change the fontsize of the features in the tree?
Thanks!
Sorry, I do not.
Have you found it possible to plot in python using the feature names? This seems like a bug
No, but perhaps the API has changed or someone has posted a workaround on stackoverflow?
Thanks for the post, Jason.
When I tried to plot_tree, I got a ValueError as below:
ValueError: Unable to parse node: 0:[COLLAT_TYP_GOVT
Any idea why this happened?
Thanks
Sorry to hear that, I have not seen this problem.
Perhaps ensure xgboost is up to date and that you have all of the code from the post?
I figured out. It turns out that the feature name cannot contain spaces.
I have another question though. The tree will output leaf values in the end. But for a multi-class classification, what do leaf values mean?
Glad to hear it.
Good question, I have not tried more than two classes. Try it and let me know what you see.
Jason, thank you for the post.
I’ve tried to use plot_tree for HousePrices dataset from Kaggle (using XGBRegressor), but it plots only one leaf. Any idea what might be the reason?
Perhaps the model was not completely trained?
It would be nice to be able to use actual feature names instead of the generic f1,f2,..etc
I agree.
Is there anyway to provide the feature names to the fit function?
Not that I’m aware.
You can use pandas dataframe instead of numpy array, fit will use dataframe column names in the graph instead of f1,f2,… etc
Thanks for sharing.
You can get names of feature by setting model.feature_names to column names.
model.feature_names = list_of_feature_in_order
I might be late to answer the question, may be it will be useful for someone else looking for similar answer.
Thanks!
Hey Jason, thanks for you patient lessons!
May I ask you a question? I use XGBoost to train some data then test, but a new issue is that if when testing unknown data, there are some other options of the testing data label, how could I eliminate some options which I don’t expect?
Like it will label 1 for A, but I want make it wont label 1 for A (eliminate the choice of 1).Not sure if you understand,THX!!
Not sure I follow, sorry? Perhaps you can elaborate?
Well, while predicting one data set, I’d like to know the five closest possible labels for it, so what suggestion?
Thanks for your reply,Jason
Predict probabilities.
well…have no idea about that..It would be very nice if you could tell me more ..thanks still:)
If you are using the sklearn wrapper, this tutorial will show you how to predict probabilities:
https://machinelearningmastery.com/make-predictions-scikit-learn/
Hey Jason, you are an awesome teacher. Great content.
Thanks!
Hi Jason,
Awesome stuff, thanks for the detailed tutorial!
Question, what does the coefficients represent (e.g., probabilities, positive vs. negative)? I guess the root node has a higher feature importance, but how do I interpret the nodes to the far right?
Thanks,
André
Generally, we don’t interpret the trees in an ensemble.
what about the values on the leaves, what do they mean?
Thanks
Good question.
I suspect the support for the leaf in the training dataset.
Hi Jason,
Thanks a lot for the awesome tutorial, and would be very much appreciate if you could help the issue I face when running the tutorial!
When I ran the code, everything works fine until I try “plot_tree(model)”. I get the error as below.
Is there a chance that you may know the issue I am facing here? I suspect it could be an issue of installing the graphviz package, for which I did the following:
1. Install windows package from (https://graphviz.gitlab.io/_pages/Download/Download_windows.html)\
2. Install python graphviz package (using anaconda prompt “pip install graphviz)
3. Add C:\Program Files (x86)\Graphviz2.38\bin to User path
4. Add C:\Program Files (x86)\Graphviz2.38\bin\dot.exe to System Path
+++++++++++++++++++++++++++++++++++++++++++++++++++++++++++++++
Traceback (most recent call last):
File “”, line 1, in
plot_tree(model)
File “C:\ProgramData\Anaconda3\lib\site-packages\xgboost\plotting.py”, line 278, in plot_tree
rankdir=rankdir, **kwargs)
File “C:\ProgramData\Anaconda3\lib\site-packages\xgboost\plotting.py”, line 227, in to_graphviz
graph = Digraph(graph_attr=kwargs)
File “C:\ProgramData\Anaconda3\lib\site-packages\graphviz\dot.py”, line 61, in __init__
super(Dot, self).__init__(filename, directory, format, engine, encoding)
TypeError: super(type, obj): obj must be an instance or subtype of type
+++++++++++++++++++++++++++++++++++++++++++++++++++++++++++++++
Sorry to hear that, I don’t have any good ideas.
You could try posting the error to stackoverflow?
Thanks Jason, that sounds like a way out!
HI Jason,
I am working on a regression problem and am using XGboost, I tried to plot a tree by modifying the code you presented slightly and it worked fine. But here is my question
Say I am using Gradient Boosting regressor with Decision trees as base learners, and I print the first tree out, for a given instance, I can traverse down the tree and find out with a rough approximation of the dependent variable. I understand XGBoost formulation is different from GBM, but is there a way to get a similar plot? The plot I extracted has just has yes and no decisions and some leaf values which for me isnt any useful (unlike a developer) . Please suggest if there is any other plot that helps me come up with a rough approximation of my dependent variable in the nth boosting round.
Not really as you have hundreds or thousands of trees.
Thank you! I agree there are a number of trees, but I thought the first few trees will give me a rough cut value of my dependent variable and the subsequent trees will only be useful to finetune the rough cut value. Given a XGB model and its parameters, is there a way to find out a GBM equivalent of it? (Apologies if the questions sounds silly, I am just months old to ML concepts and not in a position to chew and digest all that I read in these months)
They are the same algorithm for the most part, “stochastic gradient boosting”, but the xgboost implementation is designed from the group-up for speed of execution during training and inference.
Thank you!
How to establish a relation between the predicted values by the model and the leaves or the terminal nodes in the graph for a regression problem in XGBoost?
Not sure I follow, why exactly?
Suppose I have a dataset and I train an xgboost Regression model with 80% of data as training and the rest 20% is used as a test for predictions.
And also, the plot_tree() method is used on an xgBosst Regressor, to get a graph similar to the one that was depicted at the beginning of this article article.
Now the question is how to establish a relationship between the leaf nodes in the tree-plot and the prediction values that were obtained from the model.
(And what are exactly those values in the leaf nodes correspond to?)
I don’t know off hand sorry. Recall there are hundreds of trees in the model.
Perhaps there is something in the xgboost API to allow you to discover the leaf of each tree used to make a prediction.
Hello,i have the same question,did you know?
Is it possible to plot the last tree in the model?
I don’t see why not. I don’t have an example sorry.
Jason, the image of the tree is very very small.
So, is impossible to see the tree, How can I get a “big” image of the tree ?
I’m sure there is. Sorry, I don’t have an example.
There are more than one way. This one is simple:
# plot single tree
plot_tree(model)
fig = pyplot.gcf() # to solve low resolution problem
fig.set_size_inches(150, 100) # # to solve low resolution problem
pyplot.show()
Hi Jason,
we have just implemented xgboost in dtreeviz library https://github.com/parrt/dtreeviz.
It contains a lot of useful visualizations, for tree structure, leaf nodes metadata and more.
If you have time to take a look or to try it, I would like to hear any feedback from your side.
Tudor
Thanks for sharing.
Hi, is it possible to use plot_tree to plot the decision tree based on predictions on test data? if not, would you be able to recommend a library that can?
The tree can be plot based on the training data, not test data, and we don’t plot predictions.
You mean the path through the trees for each input? Sorry, I don’t know about libs that can do that.
you can try dtreeviz. It has a visualisation to plot the prediction path of an input example. Like this one https://github.com/parrt/dtreeviz/blob/master/testing/samples/diabetes-LR-2-X.svg
Thanks for sharing!
Hi Dr. Jason.
Thank you for your good article again. I have two questions to you.
First question: May I know how do we interpret the leaf nodes at the bottom most? What does it mean for the bottom nodes that come with floating values of ‘leaf’? For example, leaf = 0.15…, 0.16…. Can you elaborate more on this, please?
Second question: Is it a must for us to do the feature importance first, and use its result to retrain the XGBoost algorithm with features that have higher weights based on the feature importance’s result? After these steps are done, only can we do the hyperparameter optimization, right?
Thank you for your help.
A single tree is probably not useful to interpret as part of an ensemble. The node is the output/prediction or split point for prediction – I don’t recall sorry – perhaps check the documentation.
The model automatically performs feature selection/importance weighting as part of training. All trees do this.
Is it possible that one feature appear twice or more in a single tree?
Great work as usual. Thanks
Why is the “yes, missing” in all nodes’ interactions? what is this “missing” relates to?
Hi Chathurangi…The following discussion may be of interest:
https://stackoverflow.com/questions/62176516/how-to-visualize-an-xgboost-tree-from-gridsearchcv-output
I’m wondering how we can use this to visualize Gradient Boosting Classifier in scikit-learn?
(https://scikit-learn.org/stable/modules/generated/sklearn.ensemble.GradientBoostingClassifier.html)