Time series forecast models can both make predictions and provide a prediction interval for those predictions.
Prediction intervals provide an upper and lower expectation for the real observation. These can be useful for assessing the range of real possible outcomes for a prediction and for better understanding the skill of the model
In this tutorial, you will discover how to calculate and interpret prediction intervals for time series forecasts with Python.
Specifically, you will learn:
How to make a forecast with an ARIMA model and gather forecast diagnostic information.
How to calculate and report a prediction interval for a forecast.
How to interpret a prediction interval for a forecast and configure different intervals.
Kick-start your project with my new book Time Series Forecasting With Python, including step-by-step tutorials and the Python source code files for all examples.
Let’s dive in.
Updated Apr/2019: Updated the link to dataset.
Updated Jun/2019: Changed from prediction intervals to prediction intervals.
Updated Aug/2019: Updated data loading to use new API.
Updated Dec/2020: Updated modeling for changes to the API.
Understand Time Series Forecast Uncertainty Using Prediction Intervals with Python Photo by Bernard Spragg. NZ, some rights reserved.
ARIMA Forecast
The ARIMA implementation in the statsmodels Python library can be used to fit an ARIMA model.
It returns an ARIMAResults object. This object provides the get_forecast() function that can be used to make predictions about future time steps and default to predicting the value at the next time step after the end of the training data.
Assuming we are predicting just the next time step, the get_forecast() function returns a PredictionResults object with useful information such as:
predicted_mean. The forecasted value in the units of the training time series.
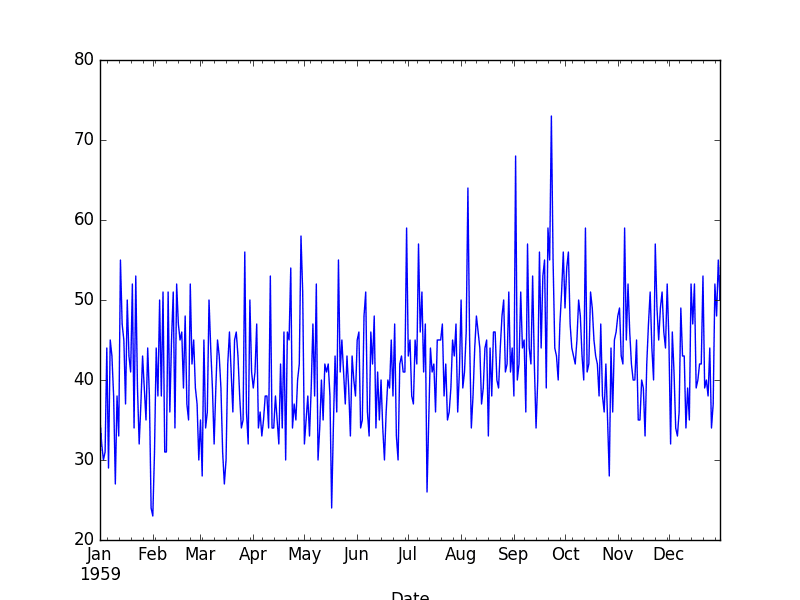
Running the example loads the dataset and graphs it as a line plot.
Daily Female Births Dataset
Forecast Prediction Interval
In this section, we will train an ARIMA model, use it to make a prediction, and inspect the prediction interval.
First, we will split the training dataset into a training and test dataset. Almost all observations will be used for training and we will hold back the last single observation as a test dataset for which we will make a prediction.
An ARIMA(5,1,1) model is trained. This is not the optimal model for this problem, just a good model for demonstration purposes.
The trained model is then used to make a prediction by calling the get_forecast() function. The results of the forecast are then printed.
The complete example is listed below.
1
2
3
4
5
6
7
8
9
10
11
12
13
14
15
16
17
18
19
20
21
# summarize the confidence interval on an ARIMA forecast
print('95%% Interval: %.3f to %.3f'%(ci[0,0],ci[0,1]))
Running the example prints the expected value from the test set followed by the predicted value, standard error, and prediction interval for the forecast.
1
2
3
4
Expected: 45.149
Forecast: 50.000
Standard Error: 7.009
95% Interval: 31.413 to 58.886
Interpreting the Prediction Interval
The get_forecast() function allows the prediction interval to be specified.
The alpha argument on the conf_int() function on the PredictionResult specifies the prediction level.
An alpha of 0.05 means that the ARIMA model will estimate the upper and lower values around the forecast where there is a only a 5% chance that the real value will not be in that range.
Put another way, the 95% prediction interval suggests that there is a high likelihood that the real observation will be within the range.
In the above example, the forecast was 45.149. The 95% prediction interval suggested that the real observation was highly likely to fall within the range of values between 31.413 and 58.886.
The real observation was 50.0 and was well within this range.
We can tighten the range of likely values a few ways:
We can ask for a range that is narrower but increases the statistical likelihood of a real observation falling outside of the range.
We can develop a model that has more predictive power and in turn makes more accurate predictions.
Further, the prediction interval is also limited by the assumptions made by the model, such as the distribution of errors made by the model fit a Gaussian distribution with a zero mean value (e.g. white noise).
Extending the example above, we can report our forecast with a few different commonly used prediction intervals of 80%, 90%, 95% and 99%.
The complete example is listed below.
1
2
3
4
5
6
7
8
9
10
11
12
13
14
15
16
17
18
19
20
# summarize multiple confidence intervals on an ARIMA forecast
print('%.1f%% Confidence Interval: %.3f between %.3f and %.3f'%((1-a)*100,forecast,ci[0,0],ci[0,1]))
Running the example prints the forecasts and prediction intervals for each alpha value.
We can see that we get the same forecast value each time and an interval that expands as our desire for a ‘safer’ interval increases. We can see that an 80% captures our actual value just fine in this specific case.
1
2
3
4
80.0% Confidence Interval: 45.149 between 36.167 and 54.131
90.0% Confidence Interval: 45.149 between 33.621 and 56.677
95.0% Confidence Interval: 45.149 between 31.413 and 58.886
99.0% Confidence Interval: 45.149 between 27.096 and 63.202
Summary
In this tutorial, you discovered how to calculate and interpret the prediction interval for a time series forecast with Python.
Specifically, you learned:
How to report forecast diagnostic statistics when making a point forecast.
How to calculate and report a prediction interval for a forecast.
How to interpret and configure the prediction interval for a time series forecast.
Do you have any questions about forecast prediction intervals, or about this tutorial?
Ask your questions in the comments below and I will do my best to answer.
Want to Develop Time Series Forecasts with Python?
are you talking about “confidence intervals” or about “prediction intervals”? Some books mix the terms, but Time Series experts like Hyndman do an interesting differentiation:
Hi Jason.
What if we get a negative lower Confidence Interval while forecasting prices?? Since prices cannot be negative, is there a way to correct for this?
Great question. I’m not sure of good theory for this off the cuff. In practice, you can impose a hard limit on the interval to fit in your domain, for example:
Do you have additional code somewhere showing how to make predictions and plot the confidence interval for the entire time series using this model?
Thanks!
T
how can i get the confidence intervals for SARIMAX where i performed the grid search to get optimum parameters also keeping into consideration that i have a exogenous variable like Holiday effect?
Great article. Thank you for all your posts. I learn a lot from them.
I understand that time series forecasting is for when we are forecasting the same variables in the future.
X1, X2, X3->X4, X5, X6
What if the nature of forecasting is not the same variables.
X1, X2, X3->Y1, Y2, Y3.
If we forecast one step, we will get something like:
X1, X2, X3, Y1-?>Y2, Y3
and we can not use the model further in this case for further predictions.
Do you know what is the technique used for such forecasting called?
Should we use a direct mapping between X->Y using LSTM or there is some other techniques available? I am looking for the definition of this problem and the techniques already developed. Thanks!
Hi Jason,
Thank you very much for the article!
I have one question regarding to log transformation vs prediction intervals.
In case that we first log transformed our data to improve prediction power, when we’re getting back with our values to regular space we’re putting the log transformation on prediction intervals as well. But putting exp function on logged data for little differences in log space makes huge differences in regular space and making upper bounds gigantic in many cases.
So here is my question- are there any common methodologies how to avoid this side effect?
All best,
Mateusz
Dear Jason: Thanks for the article. This is a great one. One question about the plot_predict call. As I read the code in “Plotting the Confidence Interval,” the test data is actually not used for ploting. Do you think if we should remove the test part from the code?
I am interested in calculating the sum of all the predicted values from multiple time steps, which are output of an ARIMA or SARIMA model. If I can estimate the standard error for each predicted value using the method you described, do you how can I calculate the standard error for the sum of these predicted values?
The task that I have is to forecast a monthly variable y for 6 months, and estimate the sum of y in these 6 months, and the associated confidence interval.
I am not sure what is the correct way to arrive at this, since simple addition of individual standard errors for each month is not applicable as the estimated data points can be correlated.
Hi,Mrs.Jason.
Thanks for your blog.
It’s very helpful.
But, I still have one question.
With the use of plot_predict(), I get the prediction interval of a short time series(like more than one prediction point).
If permitted, I would like to print the prediction interval and see the number of them.
How could I can do it?
By the way, I use the ARMA model instead of ARIMA model.
(I achieve the difference and the reverse process in my own way.
When trying ARIMA model, there are always some errors appearing.)
So, I need to apply the reverse process of difference on the prediction data.
Looking forward to your reply!
In the example, you have the standard error of 6.996 which then gets used to help create the 95.0% prediction interval of 32.167 and 59.590 for one time step out. What if I wanted to forecast two or more time steps out…what would be the standard error for two time steps out and how would I find it? Would it be related to the one step forecast standard error of 6.996? Thanks.
I am using the package ‘statsmodels.tsa.vector_ar.var_model.VAR’. I am wondering if the fitted model has an in-build function to obtain the prediction intervals (just as an OLS regression)? Otherwise, will your method work with a VAR model as well?
I see that this gives the prediction interval for the next out-of-sample value estimated by the model. I am trying to obtain the values of the prediction interval for my ARIMA model for the entire time series – the prediction interval for each step of the model. Is there is a prediction interval output as part of the model.fit? Or is there a better way to obtain this?
Can you give an example of syntax? I’ve tried this and haven’t been able to get anything to work yet. When I review the statsmodels documentation, it looks like forecast is only for out of sample predictions. The results or results predict don’t appear to give any output other than the estimates of the model results.
Are you suggesting something like: forecast, stderr, conf = model_fit.forecast()[0:50] ?
That gives me the same results as using no indexing – only a single time step. From the documentation, forecast() is for out of sample forecasts from the end of the sample. The number of steps forward can be specified, but I want the PI for each step of the fitted model. model_fit.predict() returns estimates for each step, nut no PI. https://www.statsmodels.org/stable/generated/statsmodels.tsa.arima_model.ARIMAResults.forecast.html
Thanks for continuing to iterate on this. My exact question is how to use the forecast() function on in-sample. The example/link you share is for out-of-sample. How do you apply forecast() for in sample?
When I use the statsmodels package and its ARIMA to fit a time series data, the forecast becomes more constant along with the multi-step ahead forecast, for example, if the last observation is x(t), then the forecasted x(t+1) and x(t+2) looks reasonable, but after x(t+10) the result looks quite constant.
Another question, the difference between confidential interval and predicted-mean for in-sample prediction is not as same as the out-of-sample prediction. The document said the confidence interval is calculated by (expectation+-1.96*(standard error)) (assume alpha is 0.05) and the difference should only depend on the standard error which is should be constant.
Forecasted value you can treat is as mean and just doing cumulative sum to get back in original scale. Lower/upper bounds are a bit harder. You need to assume some probability model (e.g., Gaussian distribution) and do convolution integral to convert the error margins back.
Hi Jason, I purchased your Forecasting book a couple years ago and it was a huge help in my learning curve as a data scientist predicting my company’s macroforecast.
I’m currently working on a new forecast and have been asked to use BATS and TBATS. I have this working, but now need to also provide a prediction interval. I can’t find any python libraries that provide a prediction interval, so I’m assuming I need to calculate it on my own. Can you help me with what the python code or the prediction formula I’d use would be?
So, I looked for several hours yesterday and couldn’t find an answer to this question on BATS confidence intervals. But in typical fashion for me, 15 minutes after posting my question to you, Jason, I found my answer.
In case anyone else has a similar need for BATS prediction intervals, here is the link to github with a great example, which worked for me.


Hi, Jason.
your contents are great! Only one thing:
are you talking about “confidence intervals” or about “prediction intervals”? Some books mix the terms, but Time Series experts like Hyndman do an interesting differentiation:
https://robjhyndman.com/hyndsight/intervals/
Thanks
Prediction intervals. Thanks Luis!
Hi Jason.
What if we get a negative lower Confidence Interval while forecasting prices?? Since prices cannot be negative, is there a way to correct for this?
Thanks!
Great question. I’m not sure of good theory for this off the cuff. In practice, you can impose a hard limit on the interval to fit in your domain, for example:
Do you have additional code somewhere showing how to make predictions and plot the confidence interval for the entire time series using this model?
Thanks!
T
The post above does make a prediction and show the confidence interval.
You can use it as a template for your own dataset.
how can i get the confidence intervals for SARIMAX where i performed the grid search to get optimum parameters also keeping into consideration that i have a exogenous variable like Holiday effect?
Perhaps re-fit and analyze the best performing model as a standalone exercise after you have chosen its configuration.
I expect the approach in the above post would work for SARIMAX.
Great article. Thank you for all your posts. I learn a lot from them.
I understand that time series forecasting is for when we are forecasting the same variables in the future.
X1, X2, X3->X4, X5, X6
What if the nature of forecasting is not the same variables.
X1, X2, X3->Y1, Y2, Y3.
If we forecast one step, we will get something like:
X1, X2, X3, Y1-?>Y2, Y3
and we can not use the model further in this case for further predictions.
Do you know what is the technique used for such forecasting called?
Should we use a direct mapping between X->Y using LSTM or there is some other techniques available? I am looking for the definition of this problem and the techniques already developed. Thanks!
This is called sequence to sequence prediction:
https://machinelearningmastery.com/sequence-prediction/
Hi Jason,
Thank you very much for the article!
I have one question regarding to log transformation vs prediction intervals.
In case that we first log transformed our data to improve prediction power, when we’re getting back with our values to regular space we’re putting the log transformation on prediction intervals as well. But putting exp function on logged data for little differences in log space makes huge differences in regular space and making upper bounds gigantic in many cases.
So here is my question- are there any common methodologies how to avoid this side effect?
All best,
Mateusz
The prediction and interval assume a gaussian distribution that will balloon when made exponential was you comment.
Ouch. Good question.
I don’t know any good strategies off hand, sorry. Let me know if you discover anything.
Dear Jason: Thanks for the article. This is a great one. One question about the plot_predict call. As I read the code in “Plotting the Confidence Interval,” the test data is actually not used for ploting. Do you think if we should remove the test part from the code?
Sure.
Hi Jason,
Any idea, how to compute the confidence intervals using the LSTM model for timeseries forecasting ?
Thanks
Sanchit
You mean prediction intervals? Perhaps this will help:
https://machinelearningmastery.com/prediction-intervals-for-machine-learning/
Thanks for the great article Jason.
I am interested in calculating the sum of all the predicted values from multiple time steps, which are output of an ARIMA or SARIMA model. If I can estimate the standard error for each predicted value using the method you described, do you how can I calculate the standard error for the sum of these predicted values?
Your help will be much appreciated.
This will require custom code, should be fun for you.
What problem are you having exactly?
The task that I have is to forecast a monthly variable y for 6 months, and estimate the sum of y in these 6 months, and the associated confidence interval.
I am not sure what is the correct way to arrive at this, since simple addition of individual standard errors for each month is not applicable as the estimated data points can be correlated.
Perhaps develop a linear model for the forecast, such as ARIMA, then write some code to sum the predictions?
where i can find theorem about how to predict interval in time series?
Perhaps a textbook like this one:
https://amzn.to/2KRuymG
I think these are prediction intervals.
I agree, I have updated the post. Thanks.
Hi,Mrs.Jason.
Thanks for your blog.
It’s very helpful.
But, I still have one question.
With the use of plot_predict(), I get the prediction interval of a short time series(like more than one prediction point).
If permitted, I would like to print the prediction interval and see the number of them.
How could I can do it?
By the way, I use the ARMA model instead of ARIMA model.
(I achieve the difference and the reverse process in my own way.
When trying ARIMA model, there are always some errors appearing.)
So, I need to apply the reverse process of difference on the prediction data.
Looking forward to your reply!
You can predict multiple time steps and get the interval for each, you can do this directly using the same function – just specify the steps.
You can then plot or summarize the result of each prediction and interval.
Why MSE cannot be used to obtain prediction intervals for longer-term forecast?
You could summarize the distribution of MSE across multiple times steps, but it would be a crude estimate of the variance in the prediction.
Hi Jason,
thank you for your work, it is incredibly helpful to me!
As you’ve updated this article a question came to my mind: In the paragraph “Plotting the Prediction Interval”, you’ve calculated and plotted the “grey cone” using statsmodels, which gives you back a confidence interval.
https://www.statsmodels.org/stable/generated/statsmodels.tsa.arima_model.ARIMAResults.forecast.html#statsmodels.tsa.arima_model.ARIMAResults.forecast
Why is, in this particular example, the prediction interval equal to the confidence interval?
Thank you very much in advance!
You’re welcome.
They use “confidence interval” in the API to refer to “prediction interval”.
They are diffrent, technically.
Prediction interval:
https://machinelearningmastery.com/prediction-intervals-for-machine-learning/
Confidence interval:
https://machinelearningmastery.com/confidence-intervals-for-machine-learning/
In the example, you have the standard error of 6.996 which then gets used to help create the 95.0% prediction interval of 32.167 and 59.590 for one time step out. What if I wanted to forecast two or more time steps out…what would be the standard error for two time steps out and how would I find it? Would it be related to the one step forecast standard error of 6.996? Thanks.
You can call the forecast function with as many steps as you need and get the prediction interval for those forecasted steps.
I am using the package ‘statsmodels.tsa.vector_ar.var_model.VAR’. I am wondering if the fitted model has an in-build function to obtain the prediction intervals (just as an OLS regression)? Otherwise, will your method work with a VAR model as well?
It may, you will have to check the API.
I see that this gives the prediction interval for the next out-of-sample value estimated by the model. I am trying to obtain the values of the prediction interval for my ARIMA model for the entire time series – the prediction interval for each step of the model. Is there is a prediction interval output as part of the model.fit? Or is there a better way to obtain this?
You can call forecast() on the indexes for the data to get the interval, but I don’t know how useful it would be.
Can you give an example of syntax? I’ve tried this and haven’t been able to get anything to work yet. When I review the statsmodels documentation, it looks like forecast is only for out of sample predictions. The results or results predict don’t appear to give any output other than the estimates of the model results.
The syntax is the same as any other prediction, just specify the indexes 0 to len(train). That would be my guess.
Sorry, I don’t have the capacity to prepare a custom example.
Are you suggesting something like: forecast, stderr, conf = model_fit.forecast()[0:50] ?
That gives me the same results as using no indexing – only a single time step. From the documentation, forecast() is for out of sample forecasts from the end of the sample. The number of steps forward can be specified, but I want the PI for each step of the fitted model. model_fit.predict() returns estimates for each step, nut no PI.
https://www.statsmodels.org/stable/generated/statsmodels.tsa.arima_model.ARIMAResults.forecast.html
Not quite, see this tutorial on how to use the predict() and forecast() functions:
https://machinelearningmastery.com/make-sample-forecasts-arima-python/
Adapt to make in-sample instead of out of sample.
Thanks for continuing to iterate on this. My exact question is how to use the forecast() function on in-sample. The example/link you share is for out-of-sample. How do you apply forecast() for in sample?
Perhaps forecast() only supports out of sample, given the argument “steps” is relative to the end of the training sample.
Perhaps you can use predict()? Perhaps there is another function in the API you can use?
How do you change the x-axis labels to dates rather than the number of days
You may have to look up the API for matplotlib, I don’t recall off hand.
When I use the statsmodels package and its ARIMA to fit a time series data, the forecast becomes more constant along with the multi-step ahead forecast, for example, if the last observation is x(t), then the forecasted x(t+1) and x(t+2) looks reasonable, but after x(t+10) the result looks quite constant.
Another question, the difference between confidential interval and predicted-mean for in-sample prediction is not as same as the out-of-sample prediction. The document said the confidence interval is calculated by (expectation+-1.96*(standard error)) (assume alpha is 0.05) and the difference should only depend on the standard error which is should be constant.
I guess the two questions are related.
The further in the future you predict, the more error you can expect. Predicting the future is really hard.
Hi Jason,
Helpful indeed!
What is the formula to calculate 95% interval in ARIMA.
Also, in VAR we get forecasted and lower/upper in different scale(typically in the order of differentiation).
How to convert them back to original scale in VAR?
Forecasted value you can treat is as mean and just doing cumulative sum to get back in original scale. Lower/upper bounds are a bit harder. You need to assume some probability model (e.g., Gaussian distribution) and do convolution integral to convert the error margins back.
Hi Jason, I purchased your Forecasting book a couple years ago and it was a huge help in my learning curve as a data scientist predicting my company’s macroforecast.
I’m currently working on a new forecast and have been asked to use BATS and TBATS. I have this working, but now need to also provide a prediction interval. I can’t find any python libraries that provide a prediction interval, so I’m assuming I need to calculate it on my own. Can you help me with what the python code or the prediction formula I’d use would be?
Thanks,
Ken
So, I looked for several hours yesterday and couldn’t find an answer to this question on BATS confidence intervals. But in typical fashion for me, 15 minutes after posting my question to you, Jason, I found my answer.
In case anyone else has a similar need for BATS prediction intervals, here is the link to github with a great example, which worked for me.
https://github.com/intive-DataScience/tbats/blob/master/examples/confidence_intervals.py