
Support Vector Machines are perhaps one of the most popular and talked about machine learning algorithms.
They were extremely popular around the time they were developed in the 1990s and continue to be the go-to method for a high-performing algorithm with little tuning.
In this post you will discover the Support Vector Machine (SVM) machine learning algorithm. After reading this post you will know:
- How to disentangle the many names used to refer to support vector machines.
- The representation used by SVM when the model is actually stored on disk.
- How a learned SVM model representation can be used to make predictions for new data.
- How to learn an SVM model from training data.
- How to best prepare your data for the SVM algorithm.
- Where you might look to get more information on SVM.
SVM is an exciting algorithm and the concepts are relatively simple. This post was written for developers with little or no background in statistics and linear algebra.
As such we will stay high-level in this description and focus on the specific implementation concerns. The question around why specific equations are used or how they were derived are not covered and you may want to dive deeper in the further reading section.
Kick-start your project with my new book Master Machine Learning Algorithms, including step-by-step tutorials and the Excel Spreadsheet files for all examples.
Let’s get started.

Support Vector Machines for Machine Learning
Photo by Francisco Barberis, some rights reserved.
Maximal-Margin Classifier
The Maximal-Margin Classifier is a hypothetical classifier that best explains how SVM works in practice.
The numeric input variables (x) in your data (the columns) form an n-dimensional space. For example, if you had two input variables, this would form a two-dimensional space.
A hyperplane is a line that splits the input variable space. In SVM, a hyperplane is selected to best separate the points in the input variable space by their class, either class 0 or class 1. In two-dimensions you can visualize this as a line and let’s assume that all of our input points can be completely separated by this line. For example:
B0 + (B1 * X1) + (B2 * X2) = 0
Where the coefficients (B1 and B2) that determine the slope of the line and the intercept (B0) are found by the learning algorithm, and X1 and X2 are the two input variables.
You can make classifications using this line. By plugging in input values into the line equation, you can calculate whether a new point is above or below the line.
- Above the line, the equation returns a value greater than 0 and the point belongs to the first class (class 0).
- Below the line, the equation returns a value less than 0 and the point belongs to the second class (class 1).
- A value close to the line returns a value close to zero and the point may be difficult to classify.
- If the magnitude of the value is large, the model may have more confidence in the prediction.
The distance between the line and the closest data points is referred to as the margin. The best or optimal line that can separate the two classes is the line that as the largest margin. This is called the Maximal-Margin hyperplane.
The margin is calculated as the perpendicular distance from the line to only the closest points. Only these points are relevant in defining the line and in the construction of the classifier. These points are called the support vectors. They support or define the hyperplane.
The hyperplane is learned from training data using an optimization procedure that maximizes the margin.
Get your FREE Algorithms Mind Map
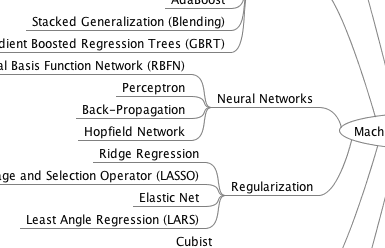
Sample of the handy machine learning algorithms mind map.
I've created a handy mind map of 60+ algorithms organized by type.
Download it, print it and use it.
Also get exclusive access to the machine learning algorithms email mini-course.
Soft Margin Classifier
In practice, real data is messy and cannot be separated perfectly with a hyperplane.
The constraint of maximizing the margin of the line that separates the classes must be relaxed. This is often called the soft margin classifier. This change allows some points in the training data to violate the separating line.
An additional set of coefficients are introduced that give the margin wiggle room in each dimension. These coefficients are sometimes called slack variables. This increases the complexity of the model as there are more parameters for the model to fit to the data to provide this complexity.
A tuning parameter is introduced called simply C that defines the magnitude of the wiggle allowed across all dimensions. The C parameters defines the amount of violation of the margin allowed. A C=0 is no violation and we are back to the inflexible Maximal-Margin Classifier described above. The larger the value of C the more violations of the hyperplane are permitted.
During the learning of the hyperplane from data, all training instances that lie within the distance of the margin will affect the placement of the hyperplane and are referred to as support vectors. And as C affects the number of instances that are allowed to fall within the margin, C influences the number of support vectors used by the model.
- The smaller the value of C, the more sensitive the algorithm is to the training data (higher variance and lower bias).
- The larger the value of C, the less sensitive the algorithm is to the training data (lower variance and higher bias).
Support Vector Machines (Kernels)
The SVM algorithm is implemented in practice using a kernel.
The learning of the hyperplane in linear SVM is done by transforming the problem using some linear algebra, which is out of the scope of this introduction to SVM.
A powerful insight is that the linear SVM can be rephrased using the inner product of any two given observations, rather than the observations themselves. The inner product between two vectors is the sum of the multiplication of each pair of input values.
For example, the inner product of the vectors [2, 3] and [5, 6] is 2*5 + 3*6 or 28.
The equation for making a prediction for a new input using the dot product between the input (x) and each support vector (xi) is calculated as follows:
f(x) = B0 + sum(ai * (x,xi))
This is an equation that involves calculating the inner products of a new input vector (x) with all support vectors in training data. The coefficients B0 and ai (for each input) must be estimated from the training data by the learning algorithm.
Linear Kernel SVM
The dot-product is called the kernel and can be re-written as:
K(x, xi) = sum(x * xi)
The kernel defines the similarity or a distance measure between new data and the support vectors. The dot product is the similarity measure used for linear SVM or a linear kernel because the distance is a linear combination of the inputs.
Other kernels can be used that transform the input space into higher dimensions such as a Polynomial Kernel and a Radial Kernel. This is called the Kernel Trick.
It is desirable to use more complex kernels as it allows lines to separate the classes that are curved or even more complex. This in turn can lead to more accurate classifiers.
Polynomial Kernel SVM
Instead of the dot-product, we can use a polynomial kernel, for example:
K(x,xi) = 1 + sum(x * xi)^d
Where the degree of the polynomial must be specified by hand to the learning algorithm. When d=1 this is the same as the linear kernel. The polynomial kernel allows for curved lines in the input space.
Radial Kernel SVM
Finally, we can also have a more complex radial kernel. For example:
K(x,xi) = exp(-gamma * sum((x – xi^2))
Where gamma is a parameter that must be specified to the learning algorithm. A good default value for gamma is 0.1, where gamma is often 0 < gamma < 1. The radial kernel is very local and can create complex regions within the feature space, like closed polygons in two-dimensional space.
How to Learn a SVM Model
The SVM model needs to be solved using an optimization procedure.
You can use a numerical optimization procedure to search for the coefficients of the hyperplane. This is inefficient and is not the approach used in widely used SVM implementations like LIBSVM. If implementing the algorithm as an exercise, you could use stochastic gradient descent.
There are specialized optimization procedures that re-formulate the optimization problem to be a Quadratic Programming problem. The most popular method for fitting SVM is the Sequential Minimal Optimization (SMO) method that is very efficient. It breaks the problem down into sub-problems that can be solved analytically (by calculating) rather than numerically (by searching or optimizing).
Data Preparation for SVM
This section lists some suggestions for how to best prepare your training data when learning an SVM model.
- Numerical Inputs: SVM assumes that your inputs are numeric. If you have categorical inputs you may need to covert them to binary dummy variables (one variable for each category).
- Binary Classification: Basic SVM as described in this post is intended for binary (two-class) classification problems. Although, extensions have been developed for regression and multi-class classification.
Further Reading
Support Vector Machines are a huge area of study. There are numerous books and papers on the topic. This section lists some of the seminal and most useful results if you are looking to dive deeper into the background and theory of the technique.
Vladimir Vapnik, one of the inventors of the technique has two books that are considered seminal on the topic. They are very mathematical and also rigorous.
- The Nature of Statistical Learning Theory, Vapnik, 1995
- Statistical Learning Theory, Vapnik, 1998
Any good book on machine learning will cover SVM, below are some of my favorites.
- An Introduction to Statistical Learning: with Applications in R, Chapter 8
- Applied Predictive Modeling, Chapter 13
- The Elements of Statistical Learning: Data Mining, Inference, and Prediction Chapter 12
There are countless tutorials and journal articles on SVM. Below is a link to a seminal paper on SVM by Cortes and Vapnik and another to an excellent introductory tutorial.
- Support-Vector Networks [PDF] by Cortes and Vapnik 1995
- A Tutorial on Support Vector Machines for Pattern Recognition [PDF] 1998
Wikipedia provides some good (although dense) information on the topic:
Finally, there are a lot of posts on Q&A sites asking for simple explanations of SVM, below are two picks that you might find useful.
- What does support vector machine (SVM) mean in layman’s terms?
- Please explain Support Vector Machines (SVM) like I am a 5 year old
Summary
In this post you discovered the Support Vector Machine Algorithm for machine learning. You learned about:
- The Maximal-Margin Classifier that provides a simple theoretical model for understanding SVM.
- The Soft Margin Classifier which is a modification of the Maximal-Margin Classifier to relax the margin to handle noisy class boundaries in real data.
- Support Vector Machines and how the learning algorithm can be reformulated as a dot-product kernel and how other kernels like Polynomial and Radial can be used.
- How you can use numerical optimization to learn the hyperplane and that efficient implementations use an alternate optimization scheme called Sequential Minimal Optimization.
Do you have any questions about SVM or this post?
Ask in the comments and I will do my best to answer.
Discover How Machine Learning Algorithms Work!
See How Algorithms Work in Minutes
...with just arithmetic and simple examples
Discover how in my new Ebook:
Master Machine Learning Algorithms
It covers explanations and examples of 10 top algorithms, like:
Linear Regression, k-Nearest Neighbors, Support Vector Machines and much more...
Finally, Pull Back the Curtain on
Machine Learning Algorithms
Skip the Academics. Just Results.
")
")
")


Hi Jason,
As always thanks for your great tutorials. I have a question regarding the parameter C.
You mention that lower C makes more sensitive to training data. My understanding is the hyperplane will be wiggling with small value of C.
However, in sci-kit learn, it states “A low C makes the decision surface smooth, while a high C aims at classifying all training examples correctly.” (http://scikit-learn.org/stable/modules/svm.html#parameters-of-the-rbf-kernel)
I am confused which one is correct. Can you please shed some light on it?
Thanks in advance.
Thanks Qichang.
I too find the scikit-learn description confusing. Perhaps it is a modified implementation.
hi jason.mine is on a different thing.trying to use svm in predicting the likelihood of an individual suffering from cancer. gotten an error while trying to fit the model.the error says that couldnt convert string to float. how do i go about it?
Perhaps confirm that your data is numeric in your CSV file?
Hi Jason,
I found the notes of SVM in Andrew Ng’s machine learning class (http://www.holehouse.org/mlclass/12_Support_Vector_Machines.html)
It states that:
Large C gives a hypothesis of low bias high variance –> overfitting
Small C gives a hypothesis of high bias low variance –> underfitting
And it is in line with the description of sci-kit learn. The definition of C is the inverse of lambda which makes sense in this way.
Great find, thanks Qichang. I’ll investigate and fix up my explanation.
I base my understanding from “An Introduction to Statistical Learning”, page 347 that states:
This matches what I have written above.
I was also having the same question and based on some test i found
as cost decreases margin increases, which allows more violation which means high bias and low variance.
Hi Jason,
I am afraid it is the contrary :
– Large value for C parameter means narrow margin, high variance and low bias.
– Small value for C parameter means wide margin, high bias and low variance.
Kind regards,
Reda
Thanks, what do you base this on?
Hi Jason,
I am sorry, you are absolutely right, I forgot to mention my sources.
Regarding the influence of C on Bias and Variance,
You could have look at Pr Andrew Ng lecture about SVM :
https://www.youtube.com/watch?v=XfyR_49hfi8 (at around 13:00).
You could also read some explanation in the book Python Machine Learning, Machine Learning and Deep Learning with Python, scikit-learn and Tensorflow (pages 79 and 80).
Regarding how C influences the margin you could play with LibSVM GUI of scikitlearn :
For example you could test for linearly separable data C=1 and C=0.001, you would observe that the margin is larger for the smaller C.
http://scikit-learn.org/stable/auto_examples/applications/svm_gui.html
There are also some explanations here :
http://scikit-learn.org/stable/auto_examples/svm/plot_svm_margin.html
Kind regards,
Reda
Thanks, I’ll investigate.
Thanks Qichang. Thanks for clarifying the variation in C. Since C is a regularization parameter which with large values reduces the misclassification which can lead to over-fitting thus can cause the higher variance.
Believe me C & Gamma varaitions have confused me most in whole machine learning. I am still not able to understand the role of gamma.
Appreciate @Jason and you, if can explain the role of gamma and its variations (low and high)here.
Thanks for the suggestion, I hope to go deeper into SVMs in the future.
Jason, thanks for your nice tutorials. After reading some articles about SVM, I still don’t know what’s the difference between support vector machine and support vector networks. In fact, I just found articles about support vector machine. There seems don’t have papers about support vector networks. If you know the difference, could you explain it? Thank you.
SVM is the main method.
I have not heard of support vector networks sorry.
Thanks for your reply. That’s ok.I was also surprised about the existence of support vector networks.I just knew it from a paper called Support-Vector Networks written by Vladimir Vapnik.
I’m very new to machine learning, therefore, need your help to understand a problem because I’m reading, practicing, and understanding in a slow pace. Sorry about the english by the way. I’ve some data (like 200,000) of pregnancies and their outcomes. I’ve ANC, asset, and education info independent variables and institution delivery as dependent variable. I’ve tried logistic regression algorithm but accuracy (78%) was not satisfiable. Because, I know there should be strong relationship between them. My question is, should I try SVM or other algorithm? If other one, then which one?
This process will help you work through your predictive modeling problem systematically:
https://machinelearningmastery.com/start-here/#process
Hello Jason,
I have the following doubts regarding support vector machines:
1. When I read this (https://en.m.wikipedia.org/wiki/Support_vector_machine)
blog, then I found out the following point about soft margin classifier:
To extend SVM to cases in which the data are not linearly separable, we introduce the hinge loss function. So, is this mean that soft margin classifiers are non-linear classifiers?
2. In the aforementioned wikipedia blog’s computing svm classifier section, I read that we can use either primal or dual (support SMO algorithm) method? So, is it necessary to have optimization objective in dual form in order to use libSVM tool for using SMO algorithm as optimization procedure?
Hi Jason,
I have test case data with two classifiers fail or pass , for this data i am able to classify whether it is pass or fail, after that i got the data with fail or pass and also unknown test case status ,we don’t know whether it is pass or fail .
how to handle this situation status of the test case is not given in dataset using SVM.
Please help in this situation .
You cannot train your model on data where you don’t have the outcome for the input.
Hey Jason! Your posts are really helpful! I have a question on missing data for both categorical and numerical variables. How does SVM or any other classification or regression model handle it? Should the values be imputed? If yes, how do we impute them? This is something which we will come across in real world problems and not many people seem to really explain how to handle it. It would be really helpful to all of us beginners in ML if you could share your knowledge and experience around this.
Please provide any tutorial regarding one class SVM,i want to calculate gamma value for one class SVM using grid search.
Please suggest me any tutorial for this requirement.
Thanks for the suggestion.
Hey Jason ,
Can you please provide me with the references used for the equations of the Polynomial Kernel and Radial Kernel ? Thank you very much
Sure:
https://en.wikipedia.org/wiki/Radial_basis_function_kernel
Thank you jason !
I have one more question jason , i was wondering why we are squaring only the support vectors xi in the radial kernel formula , i think this is the Euclidean distance of the two variables x and xi , so we must square the difference of their components, not the support vectors only ? Thank you very much.
Hallo Mr. Jason
Would you like to build SVM in python from scratch? Is it difficult?
I do have an example in my algorithms book, it is challenging but easier if you use sub-gradient descent.
Hi Jason, Whitch book??? I made a search but not found this SVM from scratch in python in your books…
Thanks a lot..
This one has the SVM: https://machinelearningmastery.com/master-machine-learning-algorithms/
Solved a regression problem using SVR, getting decent fit on test data but on test its not performing well. Hyperparameter was tuned using Gridsearchcv. What sill be the possible reason?
Tried manually changing C,gamma and epsilon over a wide range. Is effect of gamma very less in SVR?
Perhaps try alternate data preparation?
Perhaps try alternate models?
Hi Jason,
I’m in a situation where I have p variables with a total of q variables and would to forecast n days out on each p variables: a multivariate prediction problem using SVR. 1 solution is to build the model for each p, use q and p combined to predict n days out for p. Other solution is to build and train all in 1 go. I would like to choose the latter. I am having trouble setting up X_train and y_train. For uni-variable prediction, you would just create a new column with back shift of n days. X set would be the q columns, y set would be new column. I am stumped on how to set up X, y and as a result X_train, y_train for multivariate predictions.
Any ideas on how to approach this?
Thanks again!
Good question.
You can use this to prepare the data for modeling:
https://machinelearningmastery.com/convert-time-series-supervised-learning-problem-python/
I would recommend then splitting the data to maintain the temporal consistency, e.g. you only predict on the future, only train on the past.
Ideally, you would use walk forward validation:
https://machinelearningmastery.com/backtest-machine-learning-models-time-series-forecasting/
Here is another nice tutorial with python code and mathematical derivations from scratch…
http://www.adeveloperdiary.com/data-science/machine-learning/support-vector-machines-for-beginners-linear-svm/
Thanks for sharing.
Hi Jason,
I came across a post stating that given that we have n features and m observations, if n >> m, we should use logistic regression; if n << m, we should use SVM. Is it true? If so, why is that? Thank you in advance!
I have not heard that before, perhaps ask the author of the post for a reference?
Thanks for the great explanation, very well done article, helped me a lot in the study of SVM !!
From Brazil 😀
You’re very welcome!
Dear Dr. Brownlee,
I pretty much appreciate your effort and high-quality output. These materials are overwhelmingly rich.
I’ve started employing a set of ML tools for my problems, and I have a question. My dataset size is of 30 samples A, and 30 samples B. I want to perform binary classification. Does it make sense to do this using SVM for such a small dataset?
I do appreciate any help you can provide.
Thanks!
Yes, although I’d recommend testing a suite of different algorithms in order to discover what works best for your dataset.
Thank you very much, Jason Brownlee. Your technical tutorials are amazing I’ve been following them for a long time. 🙂
Thanks!
While this is a very good summary, for beginners like me, it lacks intuitive, illustrative figures (like many of your posts) that help me understand.
Thanks.
Dear Dr. Brownlee,
Did you have an example of how to use Google net to train the cifar10 datasets? After that, use the svm to print to decision boundary
Perhaps start here:
https://machinelearningmastery.com/how-to-develop-a-cnn-from-scratch-for-cifar-10-photo-classification/
Hello, I am currently following your book to implement the ML algorithms from scratch. There I have reached on the SVM model and it’s implementation.
Now, sir I have a couple of questions:
1. The example you’ve shown is after removing the B0 (intercept) to solve the SVM classification saying that our dataset is simple and to make the explanation simpler we are removing it. Now, if I want to add B0, how can I add that in this ↓ formula?
output = Y x (B1 x X1) + (B2 x X2)
Do I just add B0 there? And if I add it there, what will be the change in the follow up functions to update B0’s values in sub – gradient descent?
2. The example you’ve discussed is not using any kernel I guess, if we had to like say, Radial, then at which step will we use the kernel?
—
Thanks for an amazing book with simple explanations. I am more confident on ML algorithms after reading your book. Please solve my small doubts on the topic if possible.
Aayush ∞ Shah,
India
(1) I am not sure why you have “Y x” there, should your Y be just output?
(2) Kernel is applied to X, so instead of B1 x X1, you have B1 x f(X1) where f() is the kernel.
Thanks for reply, actually ‘x’ is for multiplication. Instead of using ‘*’ I have used ‘x’ thought will look clear. But sorry for creating ambiguity.
Great, now I got my answer for the 2nd question. Will you please try to clear my first question?
No, I understand that is multiplication. What I don’t understand is why Y appears in the output equation.
Dear Team,
Thank you so much for this article. I have one question. Is there any limit to the minimum number of features that can be used in SVR ? I need to create a non linear model that has got got only one feature. I cannot use simple regressions (linear and polynomial) as the relation ship between my input feature and output is highly nonlinear. Can I use SVR in this case?
With an appropriate kernel you may achieve it. However, with only single feature and the relationship is nonlinear, it may not be easy to find such a kernel for SVM. You need some hard work and luck.
Sir ,how kernels like Polynomial and Radial can be used?
Please share us the detail explanation .
Thanks
Sir ,how kernels like Polynomial and Radial can be used?
Thanks
Hi Abel…The following resources may add clarity:
https://www.kdnuggets.com/2016/06/select-support-vector-machine-kernels.html
https://www.educba.com/what-is-kernel-in-machine-learning/