
You do not have to model your time series forecast problem as-is.
There are many ways to reframe your forecast problem that can both simplify the prediction problem and potentially expose more or different information to be modeled. A reframing can ultimately result in better and/or more robust forecasts.
In this tutorial, you will discover how to reframe your time series forecast problem with Python.
After completing this tutorial, you will know:
- How to reframe your time series forecast problem as an alternate regression problem.
- How to reframe your time series forecast problem as a classification prediction problem.
- How to reframe your time series forecast problem with an alternate time horizon.
Kick-start your project with my new book Time Series Forecasting With Python, including step-by-step tutorials and the Python source code files for all examples.
Let’s get started.
- Updated Apr/2019: Updated the link to dataset.
- Updated Aug/2019: Updated data loading to use new API.

How to Reframe Your Time Series Forecasting Problem
Photo by Sean MacEntee, some rights reserved.
Benefits of Reframing Your Problem
Reframing your problem is the idea of exploring alternate perspectives on what is to be predicted.
There are two potential benefits to exploring alternate framings of your time series forecast problem:
- Simplify your problem.
- Provide the basis for an ensemble forecast.
Both benefits ultimately have the result of leading to more skillful and/or more robust forecasts.
1. Simplify Your Problem
Perhaps the largest wins on a forecasting project can come from a reframing of the problem.
This is because the structure and type of prediction problem has so much more impact than the choice of data transforms, choice of model, or the choice of model hyperparameters.
It is the biggest lever in a project and must be carefully considered.
2. Ensemble Forecast
In addition to changing the problem you are working on, reframing plays another role: it can provide you with a suite of different, but highly related problems that you can model.
The benefit of this is that the framings may be different enough to require differences in data preparation and modeling methods.
Models of differing perspectives on the same problem may capture different information from the input and in turn result in predictions that are skillful, but in different ways. These predictions may be combined in an ensemble to result in a more skillful or more robust forecast.
In this tutorial, we will explore three different ways you may consider reframing your time series forecast problem.
Before we dive in, let’s look at a simple univariate time series problem of forecasting the minimum daily temperature to use as context for the discussion.
Stop learning Time Series Forecasting the slow way!
Take my free 7-day email course and discover how to get started (with sample code).
Click to sign-up and also get a free PDF Ebook version of the course.
Minimum Daily Temperatures Dataset
This dataset describes the minimum daily temperatures over 10 years (1981-1990) in the city Melbourne, Australia.
The units are in degrees Celsius and there are 3,650 observations. The source of the data is credited as the Australian Bureau of Meteorology.
Download the Minimum Daily Temperatures to your current working directory with the filename “daily-minimum-temperatures.csv“.
The example below loads the dataset as a Pandas Series.
|
1 2 3 4 5 6 |
from pandas import read_csv from matplotlib import pyplot series = read_csv('daily-minimum-temperatures.csv', header=0, index_col=0) print(series.head()) series.plot() pyplot.show() |
Running the example prints the first 5 rows of the loaded dataset.
|
1 2 3 4 5 6 |
Date Temperature 1981-01-01 20.7 1981-01-02 17.9 1981-01-03 18.8 1981-01-04 14.6 1981-01-05 15.8 |
A line plot of the time series is also created.
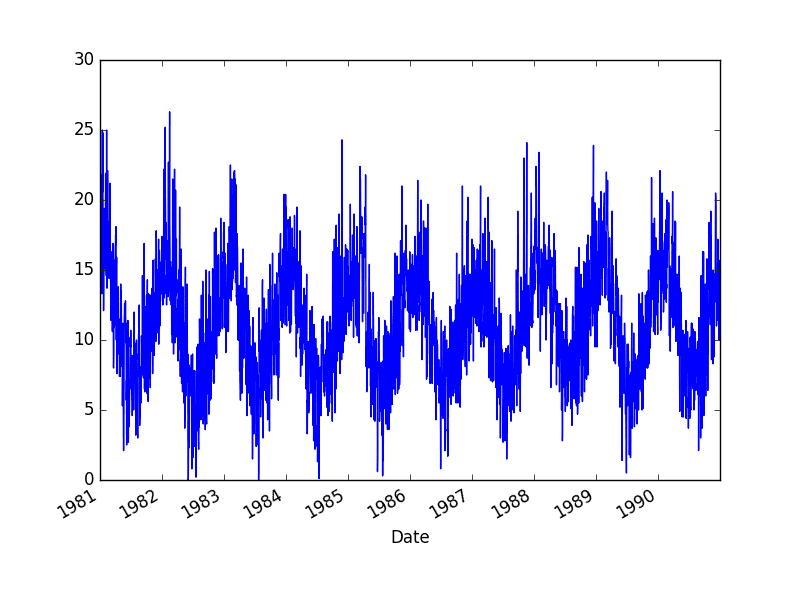
Minimum Daily Temperature Dataset
Naive Time Series Forecast
The naive approach is to predict the problem as-is.
For reference, we will call this the naive time series forecast.
In this case, the seasonal information can be removed to make the series seasonal stationary.
The time series can then be modeled based on some function of the lagged observations.
For example:
|
1 |
Temp(t+1) = B0 + B1*Temp(t-1) + B2*Temp(t-2) ... Bn*Temp(t-n) |
Where Temp(t+1) is the next temperature in the series to predict, B0 to Bn are coefficients learned from training data and Temp(t-1) to Temp(t-n) are lagged observations.
This may be fine or even required by many problems.
The risk is that a preconceived idea of how to frame the problem has influenced data collection, and in turn perhaps limited the results.
Regression Framings
Most time series prediction problems are regression problems, requiring the prediction of a real-valued output.
Below are 5 different ways that this prediction problem could be re-phrased as an alternate regression problem:
- Forecast the change in the minimum temperature compared to the previous day.
- Forecast the minimum temperature relative to the average from the past 14 days.
- Forecast the minimum temperature relative to the average the same month last year.
- Forecast the minimum temperature rounded to the nearest 5 degrees Celsius.
- Forecast the average minimum temperature for the next 7 days.
Making the temperature relative is a linear transform and may not make the problem simpler and easier to predict, but it may shake loose new ideas or even new sources of data that you may consider.
It also may help you think more clearly about how exactly the forecast will be used and what the hard requirements on that forecasted value actually are.
Transforming the granularity of a prediction problem does change the difficulty of the problem and can be very useful if the requirements of the problem permit such redefinitions.
Below is an example of reframing the Minimum Daily Temperatures forecast problem to predict the daily temperature rounded to the nearest 5 degrees.
|
1 2 3 4 5 6 7 8 9 10 11 12 13 14 |
from pandas import read_csv from pandas import DataFrame from pandas import concat from math import floor # load data series = read_csv('daily-minimum-temperatures.csv', header=0, index_col=0) # Create lagged dataset values = DataFrame(series.values) dataframe = concat([values.shift(1), values], axis=1) dataframe.columns = ['t-1', 't+1'] # round forecast to nearest 5 for i in range(len(dataframe['t+1'])): dataframe['t+1'][i] = int(dataframe['t+1'][i] / 5) * 5.0 print(dataframe.head(5)) |
Running the example prints the first 5 rows of the reframed problem.
The problem is defined as given the minimum temperature the day before in degrees Celsius, the minimum to the nearest 5 degrees.
|
1 2 3 4 5 6 |
t-1 t+1 0 NaN 20.0 1 20.7 15.0 2 17.9 15.0 3 18.8 10.0 4 14.6 15.0 |
Classification Framings
Classification involves predicting categorical or label outputs (like ‘hot’ and ‘cold’).
Below are 5 different ways that this prediction problem can be rephrased as a classification problem:
- Forecast whether a minimum temperature will be cold, moderate, or warm.
- Forecast whether a change in minimum temperature will be small or large.
- Forecast whether the minimum temperature will be a monthly minimum or not.
- Forecast whether the minimum will be higher or lower than the minimum in the previous year.
- Forecast whether the minimum temperature will rise or fall over the next 7 days.
A move to classification can simplify the prediction problem.
This approach opens up ideas on labels as well as binary classification framings.
The native regression representation of the output variable means that most classification framings are likely to keep the ordinal structure (e.g. cold, moderate, hot). Meaning that there is an ordered relationship between the classes being predicted, which may not be the case when predicting labels like ‘dog’ and ‘cat.’
The ordinal relationship permits both a hard classification problem as well as an integer prediction problem that can be post-hoc rounded into a specific category.
Below is an example of transforming the Minimum Daily Temperatures forecast problem to a classification problem where each temperature value is an ordinal value of cold, moderate, or hot. These labels are mapped to integer values, defined as:
- 0 (cold): < 10 degrees Celsius.
- 1 (moderate): >= 10 and < 25 degrees Celsius.
- 2 (hot): >= 25 degrees Celsius.
|
1 2 3 4 5 6 7 8 9 10 11 12 13 14 15 16 17 18 19 20 |
from pandas import read_csv from pandas import DataFrame from pandas import concat from math import floor # load data series = read_csv('daily-minimum-temperatures.csv', header=0, index_col=0) # Create lagged dataset values = DataFrame(series.values) dataframe = concat([values.shift(1), values], axis=1) dataframe.columns = ['t-1', 't+1'] # round forecast to nearest 5 for i in range(len(dataframe['t+1'])): value = dataframe['t+1'][i] if value < 10.0: dataframe['t+1'][i] = 0 elif value >= 25.0: dataframe['t+1'][i] = 2 else: dataframe['t+1'][i] = 1 print(dataframe.head(5)) |
Running the example prints the first 5 rows of the reframed problem.
Given the minimum temperature the day before in degrees Celsius, the goal is to predict the temperature as either cold, moderate, or hot (0, 1, 2 respectively).
|
1 2 3 4 5 6 |
t-1 t+1 0 NaN 1.0 1 20.7 1.0 2 17.9 1.0 3 18.8 1.0 4 14.6 1.0 |
Time Horizon Framings
Another axis that can be varied is the time horizon.
The time horizon is the number of time steps in the future that are being predicted.
Below are 5 different ways that this prediction problem can be re-phrased as a different time horizon:
- Forecast the minimum temperature for the next 7 days.
- Forecast the minimum temperature in 30 days time.
- Forecast the average minimum temperature next month.
- Forecast the day in the next week that will have the lowest minimum temperature.
- Forecast one year of minimum temperature values.
It is easy to get caught up in the idea that you require one-step forecasts.
Focusing on reframings of the problem around time horizon forces you to think about point versus multi-step forecasts and how far in the future to consider.
You may be able to forecast far into the future, but the skill is likely going to vary, degrading further into the future you project. When thinking through the horizon of the forecast, also consider the minimum acceptable performance of forecasts.
The example below transforms the Minimum Daily Temperatures forecast problem to predict the minimum temperature for the next 7 days.
|
1 2 3 4 5 6 7 8 9 10 11 12 13 |
from pandas import read_csv from pandas import DataFrame from pandas import concat from math import floor # load data series = read_csv('daily-minimum-temperatures.csv', header=0, index_col=0) # Create lagged dataset values = DataFrame(series.values) dataframe = concat([values.shift(1), values, values.shift(-1), values.shift(-2), values.shift(-3), values.shift(-4), values.shift(-5), values.shift(-6)], axis=1) dataframe.columns = ['t-1', 't+1', 't+2', 't+3', 't+4', 't+5', 't+6', 't+7'] print(dataframe.head(14)) |
Running the example prints the first 14 records of the transformed dataset.
The problem is defined as: given the minimum daily temperature from the day before in degrees Celsius, forecast the minimum daily temperature for the next 7 days.
|
1 2 3 4 5 6 7 8 9 10 11 12 13 14 15 |
t-1 t+1 t+2 t+3 t+4 t+5 t+6 t+7 0 NaN 20.7 17.9 18.8 14.6 15.8 15.8 15.8 1 20.7 17.9 18.8 14.6 15.8 15.8 15.8 17.4 2 17.9 18.8 14.6 15.8 15.8 15.8 17.4 21.8 3 18.8 14.6 15.8 15.8 15.8 17.4 21.8 20.0 4 14.6 15.8 15.8 15.8 17.4 21.8 20.0 16.2 5 15.8 15.8 15.8 17.4 21.8 20.0 16.2 13.3 6 15.8 15.8 17.4 21.8 20.0 16.2 13.3 16.7 7 15.8 17.4 21.8 20.0 16.2 13.3 16.7 21.5 8 17.4 21.8 20.0 16.2 13.3 16.7 21.5 25.0 9 21.8 20.0 16.2 13.3 16.7 21.5 25.0 20.7 10 20.0 16.2 13.3 16.7 21.5 25.0 20.7 20.6 11 16.2 13.3 16.7 21.5 25.0 20.7 20.6 24.8 12 13.3 16.7 21.5 25.0 20.7 20.6 24.8 17.7 13 16.7 21.5 25.0 20.7 20.6 24.8 17.7 15.5 |
Summary
In this tutorial, you discovered how to reframe your time series forecasting problem with Python.
Specifically, you learned:
- How to devise alternate regression representations of your time series problem.
- How to frame your prediction problem as a classification problem.
- How to devise alternate time horizons for your prediction problem.
Do you know of other methods to reframe your time series forecast problem?
Share them in the comments below?
Do you have any questions?
Ask them in the comments below and I will do my best to answer.
Want to Develop Time Series Forecasts with Python?

Develop Your Own Forecasts in Minutes
...with just a few lines of python codeDiscover how in my new Ebook:
Introduction to Time Series Forecasting With Python
It covers self-study tutorials and end-to-end projects on topics like: Loading data, visualization, modeling, algorithm tuning, and much more...
Finally Bring Time Series Forecasting to
Your Own Projects
Skip the Academics. Just Results.


Very useful, many thanks!
I’m glad to hear that.
Hey Jason i love your website i find myself visiting it daily, do you have any any tips on how to avoid running into the Y-1 problem, when the model just predicts the last value + some constant and i end up with a lagged unusable time series.
Yes, start by removing trend/seasonality, then look at ACF/PACF plots to see if there is anything learnable.
If you can’t do better than persistence after testing a suite of methods, you may be working on a random walk.
What if you have other features other then value, Like humidity, wind speed etc?.
You can model them too.