What algorithm should you use for a given machine learning problem?
This is the challenge of applied machine learning. There is no quick answer to this question, but there is a reliable process that you can use.
In this post you will discover how to find good and even best machine learning algorithms for a data set by directly comparing them in Weka.
After reading this post you will know:
The process for discovering good and even best machine learning algorithms for a problem.
How to design an experiment in Weka to compare the performance of different machine learning algorithms.
How to analyze the results of experiments in Weka.
Kick-start your project with my new book Machine Learning Mastery With Weka, including step-by-step tutorials and clear screenshots for all examples.
Let’s get started.
How To Compare the Performance of Machine Learning Algorithms in Weka Photo by Clark H, some rights reserved.
Best Machine Algorithm For A Problem
The most common question in applied machine learning is:
What algorithm is best for my problem?
The answer cannot be known before hand. If you understood your problem well enough to know which algorithm was best, you would not need to use machine learning. You would simply solve your problem.
Machine learning techniques are for those difficult problems where a solution must be learned from data. Where traditional techniques cannot be used.
There are a lot of rules of thumb about choosing algorithms. For example, if an algorithm expects data of a specific distribution and your data has that distribution, then perhaps the algorithm is a good fit for your problem. There are two issues with this:
Many algorithms may have expectations that make them suitable for your problem.
Sometimes good and even best results can be achieved when the expectations of an algorithm are violated.
Rules of thumb are great for a starting point, but not the final choice of algorithm.
The best machine learning algorithm for your problem is found empirically. By trial and error.
This is done by evaluating a suite of algorithms of very different types on your problem, finding what works well and doubling down on those 2-to-3 that show promise. I call this approach spot-checking.
The process is as follows:
Design a test harness including the training dataset and any data preparation and the test options, such as 10-fold cross validation.
For bonus points repeat the experiment with a number of different presentation or views of your dataset. This will help to best expose the structure of the problem to algorithms that are receptive to learning it.
Select a suite of diverse algorithms with very different assumptions about the problem, such as linear models, trees, instance based methods, probabilistic methods, neural networks and more.
For bonus points allow each algorithm to put its best foot forward, including variations of each algorithm with different commonly used configuration schemes.
Evaluate the suite of algorithms on your training dataset.
Analyze the results and identify 2-to-3 different algorithms on which to investigate further.
This process will always lead you to algorithms that perform well on your machine learning problem. In practice, you really just need a model that does as well as possible, given the time you have available.
Finding the very best model for your problem is a matter of how much time you are willing to invest trying different algorithms and tuning those algorithms that perform well.
Need more help with Weka for Machine Learning?
Take my free 14-day email course and discover how to use the platform step-by-step.
Click to sign-up and also get a free PDF Ebook version of the course.
Compare Algorithm Performance in Weka
You can spot check machine learning algorithms on your problem in Weka using the Experiment Environment.
In this tutorial you are going to design, run and analyze your first machine learning experiment.
We are going to use the Pima Indians Onset of Diabetes dataset. Each instance represents medical details for one patient and the task is to predict whether the patient will have an onset of diabetes within the next five years. There are 8 numerical input variables all have varying scales.
We are going to evaluate 5 different machine learning algorithms on the raw dataset:
Logistic Regression (Logistic)
Naive Bayes (NaiveBayes)
Classification and Regression Trees or CART (REPTree)
k-Nearest Neighbors or KNN (IBk)
Support Vector Machines or SVM (SMO)
Each algorithm will be evaluated using the default algorithm configuration. Natural extensions of this experiment that you can investigate yourself are to:
Create multiple different views of the dataset on which to evaluate the algorithms, such as normalized, standardized and more.
Add more algorithms to the suite to evaluate.
Add more variations of each algorithm with common or standard algorithm configurations.
This tutorial is divided into 3 parts:
Design The Experiment.
Run The Experiment.
Review Experiment Results.
1. Design The Experiment
The Weka Experiment Environment is a tool that you can use to run controlled experiments on datasets with machine learning algorithms.
The Weka Experiment Environment allows you to define one or more datasets to work on and one or more algorithms to work on the dataset. You can then run and monitor the experiment. Finally, all of the results are collected and presented for you to analyze.
In this section we are going to define an experiment with the Pima Indians onset of diabetes dataset, 10-fold cross validation (the default) and 5 common classification algorithms.
Each algorithm will be evaluated on the dataset 10 times (10 runs of 10-fold cross validation) with different random number seeds. This will result is 10 slightly different results for each evaluated algorithm, a small population that we can interpret using statistical methods later.
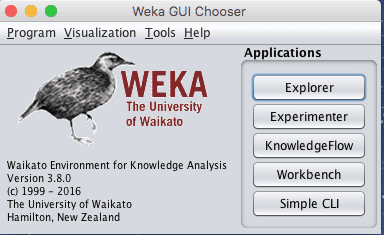
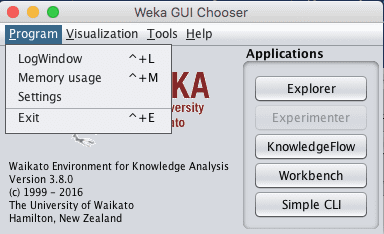
1. Open the Weka GUI Chooser.
Weka GUI Chooser
2. Click the “Experimenter” button to open the Weka Experimenter interface.
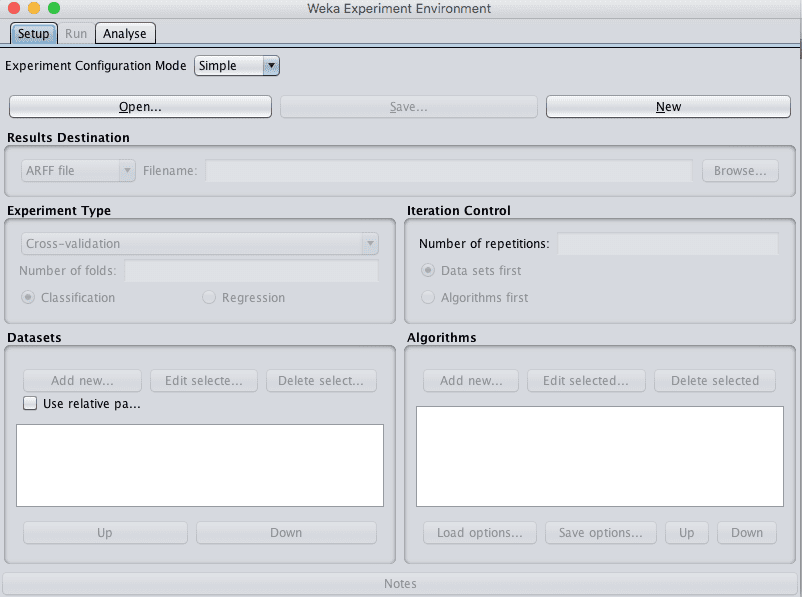
Weka Experiment Environment Setup Tab
3. On the “Setup” tab, click the “New” button to start a new experiment.
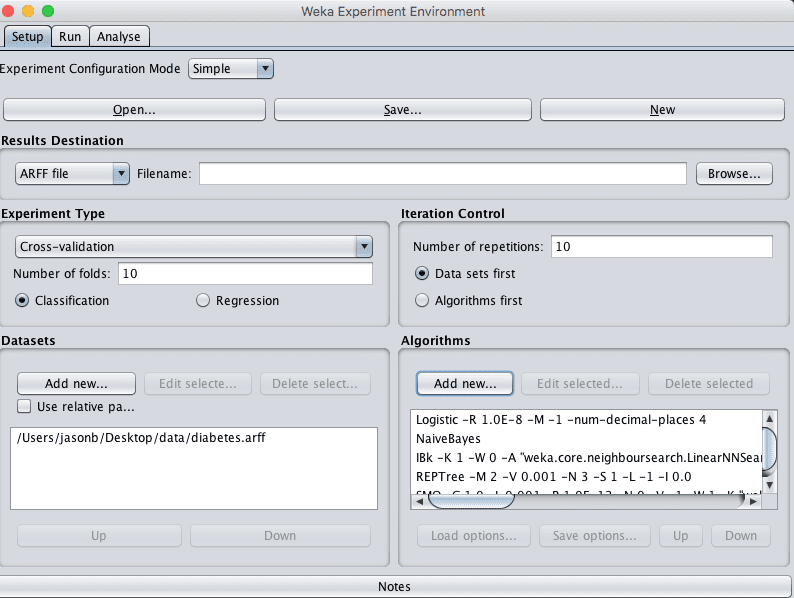
4. In the “Dataset” pane, click the “Add new…” button and choose data/diabetes.arff.
5. In the “Algorithms” pane, click the “Add new…” button, click the “Choose” button and select the “Logistic” algorithm under the “functions” group. Click the “OK” button to add it.
Repeat and add the following 4 additional algorithms:
NaiveBayes under the “bayes” group.
REPTree under the “trees” group.
IBk under the “lazy” group.
SMO under the “functions” group.
You can save this experiment definition by clicking the “Save” button at the top of the “Setup” panel. This is useful if you want to create new variations on an experiment in the future. You can load the definition using the “Open” button.
Finally, you can save the experiment results to an ARFF file. This is useful if you want to load and analyze the results at a later time. You can specify the file in which to save the experiment results in the “Results Destination” pane.
Weka Experiment Environment Configured Experiment
2. Run The Experiment
Now it is time to run the experiment.
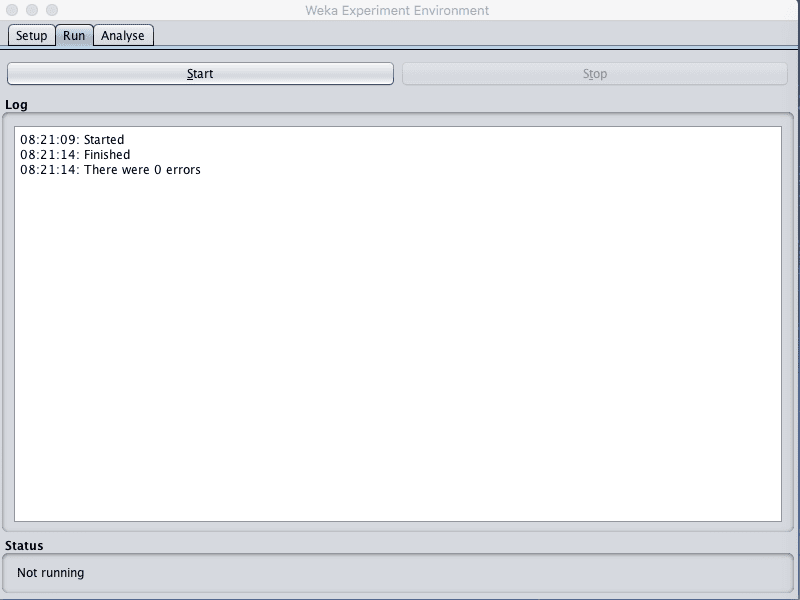
1. Click the “Run” tab.
There few options here. All you can do is start an experiment or stop a running experiment.
2. Click the “start” button and run the experiment. It should complete in a few seconds. This is because the dataset is small.
Weka Experiment Environment Run Experiment
3. Review Experiment Results
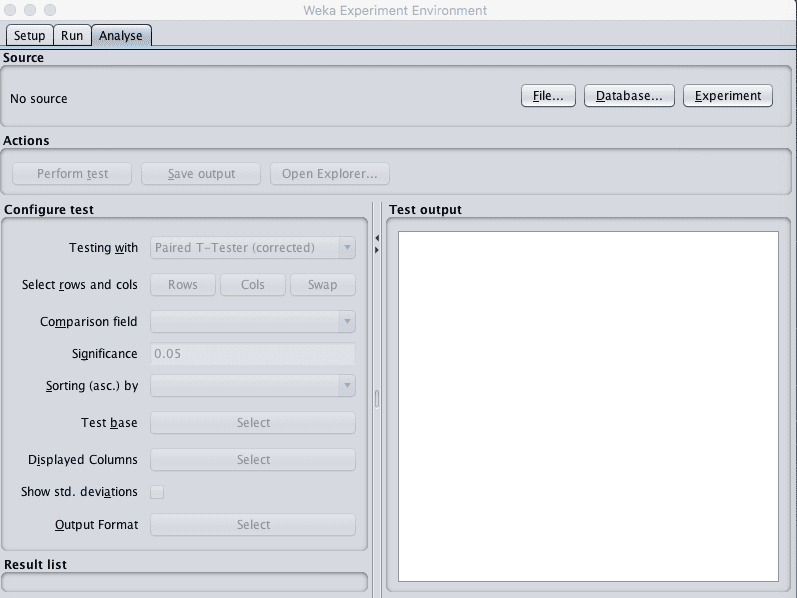
The third panel of the Weka Experiment Environment is for analyzing experimental results.
Weka Experiment Environment Analyse Tab
You can load results from:
A file, if you configured your experiment to save results to a file on the “Setup” tab.
A Database, if you configured your experiment to save results to a database on the “Setup” tab.
A Experiment, if you just ran an experiment in the Experiment Environment (which we just did).
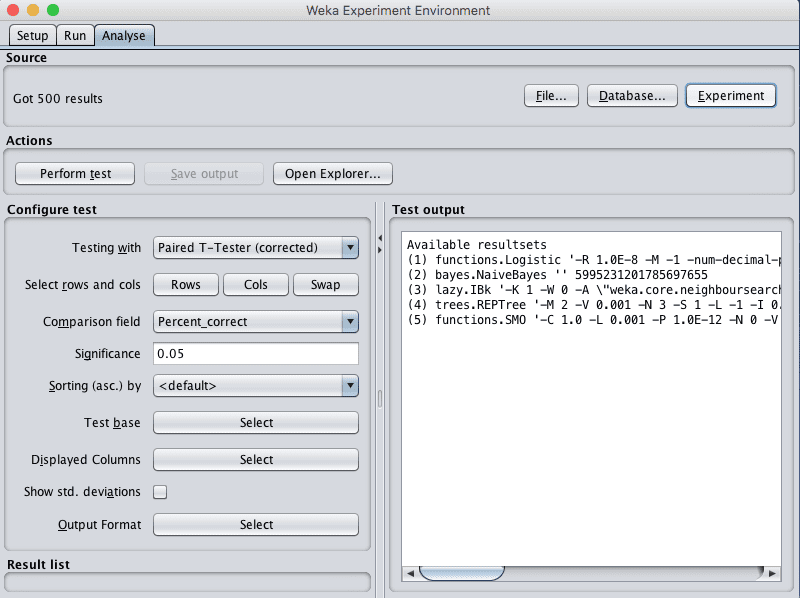
Load the results from the experiment we just executed by clicking the “Experiment” button in the “Source” pane.
You will see that 500 results were loaded. This is because we had 5 algorithms that were each evaluated 100 times, 10-fold cross validation multiplied by 10 repeats.
Weka Experiment Environment Load Results
Results were collected for many different performance measures, such as classification accuracy.
The Experiment Environment allows us to performs statistical tests on the different performance measures to allow us to draw conclusions from the experiment.
For example, we are interested in two questions from our experiments:
Which algorithm evaluated in the experiment had the best performance? This is useful to know if we wanted to create a good performance model immediately.
What is the rank of algorithms by performance? This is useful to know if we want to further investigate and tune the 2-to-3 algorithms that performed the best on the problem.
We can configure the result summary to display in the “Configure test” pane.
The type of statistical test can be selected in the “Testing with” option, by default this is set to “Paired T-Tester (corrected)”. This is just fine and will compare each algorithm in pairs and make some reasonable assumptions about the distribution of the results collected, such as that they are drawn from a Gaussian distribution. The significance level is set in the “Significance” parameter and is default to 0.05 (5%), which again, is just fine.
We do not need get caught up in the technical details of statistical significance testing. These useful defaults will inform us whether the differences between any of the pairwise algorithm performance comparisons we review are statistically significant with a confidence of 95%.
We can choose the performance measure by which to compare the algorithms in the “Comparison field” option. The default is the “Percent_correct” metric (accuracy) which is exactly what we are interested in as a first pass.
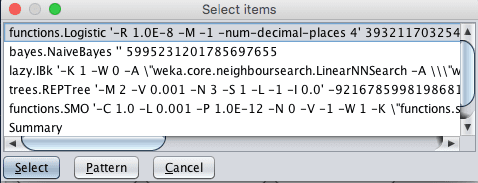
We can compare all of the algorithm results to one base result. This can be specified by the “Test base” option. The default is the first algorithm evaluated in the list, which in this case is Logistic regression. We can see this by clicking the “Select” button next to “Test base”.
Weka Experiment Environment Test Base
Click the “Perform test” button in the “Actions” pane to perform the statistical test and produce some output we can review. You should see results like those listed below.
We can see that Logistic regression, our base for comparison marked as (1) has the accuracy of 77.47% on the problem. This result is compared to the other 4 algorithms and indicated with a number and mapped in a legend at the bottom below the table of results.
Note the “*” next to the IBk and REPTree results. This indicates that the results are significantly different from the Logistic results, but the scores are lower. NaiveBayes and SMO do not have any character next to their results in the table, indicating that the results are not significantly different from Logistic. If an algorithm had results larger than the base algorithm and the difference was significant, a little “v” would appear next to the results.
If we had to build a model immediately, we might choose Logistic Regression, but we might also choose Naive Bayes or SMO as their results were not significantly different. Logistic regression is a good model to choose because it is simple, we understood and fast to train.
We would probably not choose IBk or the decision tree, at least not their default configurations because we know Logistic regression can do better and that result is statistically significant.
Debugging Errors With Weka Experiments
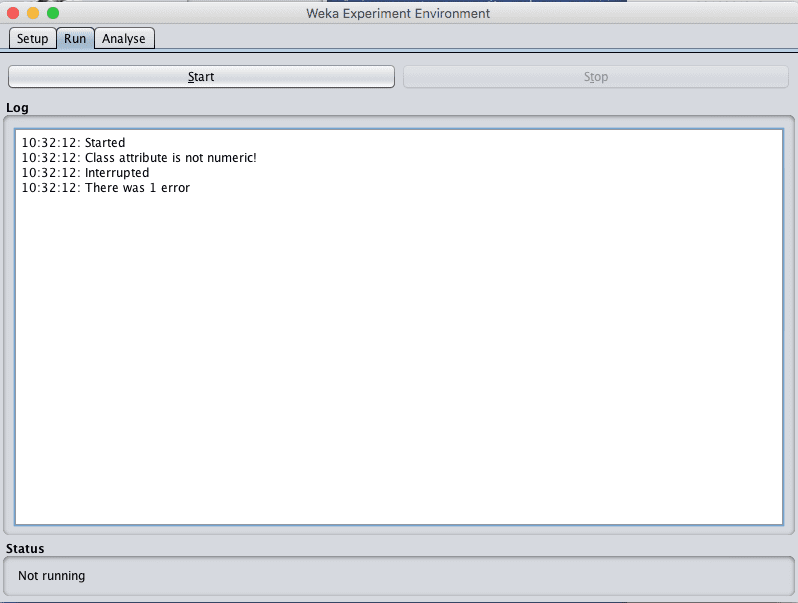
You can sometimes get errors when running your experiments.
The log in the Run tab will report “there was 1 error” and no more information.
Weka Error With an Experiment
You can easily find out what went wrong by reviewing the Weka log.
In the Weka GUI Chooser, click the “Program” menu and “LogMenu”.
Weka Open Log
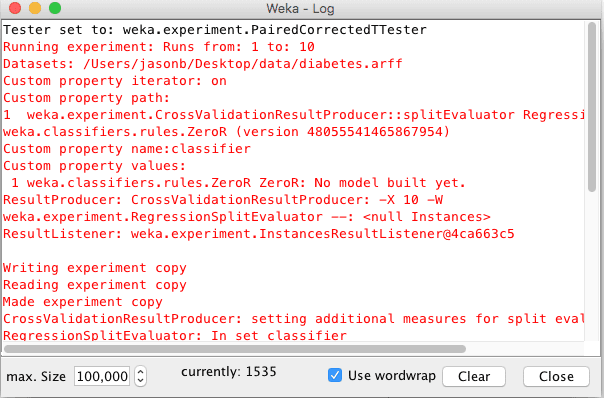
This will open the Weka Log.
Scroll through the log from top to bottom looking for the error that corresponded to your experiment. It may be the last error in the log (at the bottom).
Weka Log Window
Often, the experiment error will be caused by one of two reasons:
You chose the wrong type of problem in the “Experiment Type” pane on the “Setup” tab of the Weka Experimenter. For example your problem may be a “Regression” type problem and you chose “Classification”.
You added the wrong type of algorithm to the experiment in the “Algorithms” pane on the “Setup” tab of the Weka Experimenter. For example, you may have added an algorithm that only supports regression (like LinearRegression) to a classification type problem.
When reviewing the errors in the Weka log, keep an eye out for messages that suggests one of the above types of problems.
Summary
In this post you discovered how to find good and even the best machine learning algorithms for your data problem.
Specifically you learned:
A process to spot check a suite of different algorithms on a problem in order to find a subset of algorithms that do well for further investigation.
How to design and run an experiment to compare the performance of machine learning algorithms on a dataset.
How to interpret the results of a machine learning experiment in order to answer questions about your problem.
Do you have any questions about comparing the performance of machine learning algorithms on your dataset or about this post? Ask your questions in the comments and I will do my best to answer them.
I tried weka experimenter comparing XGBoost, Random Forest and M5P regression classifiers. Strange thing is the result in experimenter shows MRL wins but when i try training the XGBoost using same training data i used in experimenter it shows more worst Mean Absolute Error and Relative Abosolute Error compared to Random Forest and M5P. Any ideas why is this so? It seems contradicting. I am a newbie at this.
Hi, in my project i need to compare three different algorithm, is it correct if i only use the DEFAULT parameter in Weka to compare the three different algorithm to choose which algorithm is the best suitable model?
If you use my code or material in your own project, please reference the source, including:
The Name of the author, e.g. “Jason Brownlee”.
The Title of the tutorial or book.
The Name of the website, e.g. “Machine Learning Mastery”.
The URL of the tutorial or book.
The Date you accessed or copied the code.
For example:
Jason Brownlee, Machine Learning Algorithms in Python, Machine Learning Mastery, Available from https://machinelearningmastery.com/machine-learning-with-python/, accessed April 15th, 2018.
Also, if your work is public, contact me, I’d love to see it out of general interest.


thank you. that is helpful
I’m glad to here it cautree.
Hi Jason,
I tried weka experimenter comparing XGBoost, Random Forest and M5P regression classifiers. Strange thing is the result in experimenter shows MRL wins but when i try training the XGBoost using same training data i used in experimenter it shows more worst Mean Absolute Error and Relative Abosolute Error compared to Random Forest and M5P. Any ideas why is this so? It seems contradicting. I am a newbie at this.
2 2 0 mlr.MLRClassifier ‘-learner regr.xgboost -params \”nrounds = 1000, nthread = 4\” -batch 100 -S 1’ -5715911392187197733
0 1 1 trees.M5P ‘-M 4.0’ -6118439039768244417
-2 0 2 trees.RandomForest ‘-P 100 -I 100 -num-slots 1 -K 0 -M 1.0 -V 0.001 -S 1’ 1116839470751428698
Results depend on many things such as the specific problem, data preparation, and algorithm configuration.
There is no best algorithm:
https://machinelearningmastery.com/a-data-driven-approach-to-machine-learning/
In practice, I have found xgboost performs very well across a wide range of problems. But not always the best.
Hi, in my project i need to compare three different algorithm, is it correct if i only use the DEFAULT parameter in Weka to compare the three different algorithm to choose which algorithm is the best suitable model?
It is one approach, although it might be better to give each algorithm a good chance of performing well.
Thank you so much for the clear tutorial. Appreciated.
Do you have a personal email to keep in touch with you and ask some questions.
Thank you
You (and any reader) can contact me any time here:
https://machinelearningmastery.com/contact
I am Japanese. I am not good at English, but I can understand your lesson. Thank you.
Thanks, I’m glad it helped.
i am vietnam. i am not good at english. but i have a question. the result of perfomce weka is better than many algorithms in python. why ?
Excellent question!
No better or worse – on average, just different – on average.
Different implementations will give different results. It can be frustrating.
Thanks. It is very helpful.
You’re welcome.
keep up the good work
Thank you for the feedback Rosrja!
This was very helpful…❤️????????
We appreciate the feedback Ralilo and wish you the best on your machine learning journey!
I’m very grateful …I’m also for the answers I got❤️????
Thank you for your support Ralilo! We greatly appreciate it!
How to reference with this document…I have to reference my work
Hi Ralilo…
If you use my code or material in your own project, please reference the source, including:
The Name of the author, e.g. “Jason Brownlee”.
The Title of the tutorial or book.
The Name of the website, e.g. “Machine Learning Mastery”.
The URL of the tutorial or book.
The Date you accessed or copied the code.
For example:
Jason Brownlee, Machine Learning Algorithms in Python, Machine Learning Mastery, Available from https://machinelearningmastery.com/machine-learning-with-python/, accessed April 15th, 2018.
Also, if your work is public, contact me, I’d love to see it out of general interest.