The Caret R package allows you to easily construct many different model types and tune their parameters.
After creating and tuning many model types, you may want know and select the best model so that you can use it to make predictions, perhaps in an operational environment.
In this post you discover how to compare the results of multiple models using the caret R package.
Kick-start your project with my new book Machine Learning Mastery With R, including step-by-step tutorials and the R source code files for all examples.
Let’s get started.
Compare Machine Learning Models
While working on a problem, you will settle on one or a handful of well-performing models. After tuning the parameters of each, you will want to compare the models and discover which are the best and worst performing.
It is useful to get an idea of the spread of the models, perhaps one can be improved, or you can stop working on one that is clearly performing worse than the others.
In the example below we compare three sophisticated machine learning models in the Pima Indians diabetes dataset. This dataset is a summary from a collection of medical reports and indicate the onset of diabetes in the patient within five years.
The random number seed is set before each algorithm is trained to ensure that each algorithm gets the same data partitions and repeats. This allows us to compare apples to apples in the final results. Alternatively, we could ignore this concern and increase the number of repeats to 30 or 100, using randomness to control for variation in the data partitioning.
Need more Help with R for Machine Learning?
Take my free 14-day email course and discover how to use R on your project (with sample code).
Click to sign-up and also get a free PDF Ebook version of the course.
Once the models are trained and an optimal parameter configuration found for each, the accuracy results from each of the best models are collected. Each “winning” model has 30 results (3 repeats of 10-fold cross validation). The objective of comparing results is to compare the accuracy distributions (30 values) between the models.
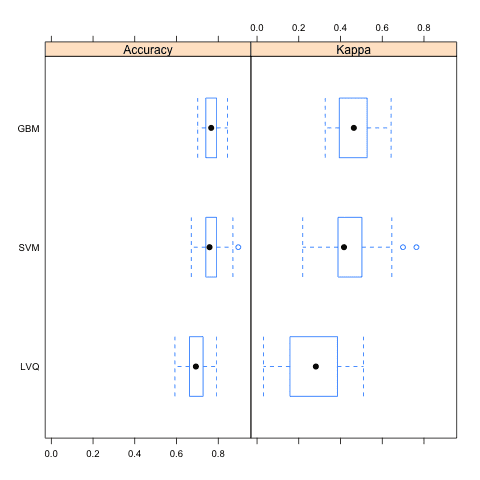
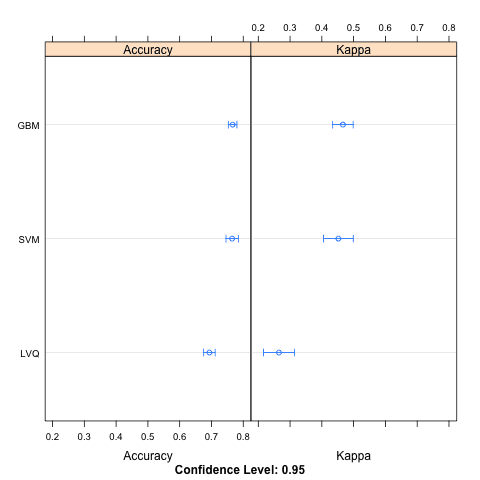
This is done in three ways. The distributions are summarized in terms of the percentiles. The distributions are summarized as box plots and finally the distributions are summarized as dot plots.
Example of comparing model results using the Caret R Package
Below is the table of results from summarizing the distributions for each model.
1
2
3
4
5
6
7
8
9
10
11
12
13
14
Models:LVQ,GBM,SVM
Number of resamples:30
Accuracy
Min.1stQu.Median Mean3rdQu.Max.NA's
LVQ 0.5921 0.6623 0.6928 0.6935 0.7273 0.7922 0
GBM 0.7013 0.7403 0.7662 0.7665 0.7890 0.8442 0
SVM 0.6711 0.7403 0.7582 0.7651 0.7890 0.8961 0
Kappa
Min. 1st Qu. Median Mean 3rd Qu. Max. NA's
LVQ0.031250.16070.28190.26500.38450.51030
GBM0.326900.39810.46380.46630.52130.64260
SVM0.218700.38890.41670.45200.50030.76380
Box Plot Comparing Model Results using the Caret R Package
Dotplot Comparing Model Results using the Caret R Package
If you needed to make strong claims about which algorithm was better, you could also use statistical hypothesis tests to statistically show that the differences in the results were significant.
Something like a Student t-test if the results are normally distributed or a rank sum test if the distribution is unknown.
Summary
In this post you discovered how you can use the caret R package to compare the results from multiple different models, even after their parameters have been optimized. You saw three ways the results can be compared, in table, box plot and a dot plot.
The examples in this post are standalone and you can easily copy-and-paste them into your own project and adapt them for your problem.
Hi, may i know how do you interpret the results at the end where you compare the models (I.e. box plot & dot plot)? Is the best model the one with the highest accuracy in the box plot or the one with smaller box area (less deviance?)?
Nice post! For the purpose of discussion, what would you suggest in a situation where you’ve exhaustively explored feature selection and the top two models have roughly the same performance plots and the t-test gives a large p-value. In that case nothing can be concluded and I can’t find an obvious way to improve them. Would you take a look at the statistically relevant variables of each one? Flip a coin? Would you look at the complexity? Thanks! I really like that you include code in your posts.
You could try ensembles of well performing but uncorrelated models as well as ensembles on random subspaces of variables and see if anything interesting falls out.
I try to implement own source data in this example.
It has a column with a date and a column with numbers from 1 to 30.
I managed to replace data(PimaIndiansDiabetes) with a read_csv().
In the train section I say for example:
modelLvq <- train(n2~., data=series, method="lvq", trControl=control)
…where n2 is my column header.
Why do I get so much errors?
Warning messages:
1: In .local(x, …) : Variable(s) `' constant. Cannot scale data.
2: In nominalTrainWorkflow(x = x, y = y, wts = weights, info = trainInfo, :
There were missing values in resampled performance measures.
What are the crucial data structure depended parts of this example?
I can't see any more? Are there some in the closed source mlbench library?
Models: logistic_yj, rf_nor, ada_yj, gbm_bc, svm_yj, knn_nor, neural_nor
Number of resamples: 0
Accuracy
Min. 1st Qu. Median Mean 3rd Qu. Max. NA’s
logistic_yj NA NA NA NaN NA NA 0
rf_nor NA NA NA NaN NA NA 0
ada_yj NA NA NA NaN NA NA 0
gbm_bc NA NA NA NaN NA NA 0
svm_yj NA NA NA NaN NA NA 0
knn_nor NA NA NA NaN NA NA 0
neural_nor NA NA NA NaN NA NA 0
What could be the reason behind this ? I had no problem comparing the gbm model to the other models and the adaBoost models to each other.
No, I checked using is.nan(),even is.infinite(). Moreover, there wasn’t any problem comparing the 3 AdaBoost models to each other. Anyway, I will keep looking. Thank you.
I tried: train(y=dataset$n2, x=dataset[, -which(colnames(dataset) == "n2")],
…but this leads to the message:
Something is wrong; all the RMSE metric values are missing.
B) I also would like to pass an external R-variable to that parameter.
Would this be possible? I tried paste() and sprintf(). But this doesn't work.
Till now I only can say it hard coded:
train(n2~.,[…]
Thank you Jason, the article was wonderful and super easy to understand.
Now I have a complete pipeline including…
– an interactive command prompt to choose tests in Python or R with different parameters
– a database filled with test results
– an Excel dashboard to analyse and visualize my results.
Ten different, running experiments with own data are currently available.
Except from specific ‘algo-questions’, the only general thing I don’t understand is question A) from above.
I googled a lot. And some say there will one day a unified syntax for the x and y parameter of Carets train() function.
Do you have some additional insights regarding to this problem, Jason?
I have done gradient boosting using your code. For other machine learning techniques, I can divide into train and test data, then use the predict function and the confusionMatrix function to obtain the accuracy. How do I know the accuracy of gradient boosting???? If I use predict and confusionMatrix, I get an error. Is the accuracy shown as AUC, not numeric?
Hm…the documentation says:
These functions provide methods for collection, analyzing and visualizing a set of resampling results from a common data set.
Later on the site you mentioned:
Given these models, can we make statistical statements about their performance differences? To do this, we first collect the resampling results using resamples.
So I would say the function ‘resamples()’ is a kind of tool to compare model performances, trained within caret.
Your post is really helpful. A nice job 🙂
Thank for all.
But, do you know the best way to recovery the coefficient of a model fitted by caret ? Because I failed to do this. Like… model$FinalModel$coefficients return NULL for example.
Jason, this is such a great piece of work! Thank you.
I just want to check something. Does this spare us from splitting the data into train/test and validating the models by predicting the testing data? I.e. Do the accuracies ‘resampled’ reflect the in-sample-errors or they also cover the out-of-sample errors? Do we have to do any further validation on testing data?
Good article,
Is there a cheat sheet that shows which models perfoms best for particulear data sets e.g classification inseparable versu separable data?
What about linear regression?
> results <- resamples(list(decision_tree=fitdt, logistic_regresion=lm.fitlog,random_forest=lm.fitrandom))
Warning message:
In resamples.default(list(decision_tree = fitdt, logistic_regresion = lm.fitlog, :
Some performance measures were not computed for each model: Accuracy, Kappa, MAE, RMSE, Rsquared
Wonderful post! I wonder sometimes the dotplot and boxplot generate different model performance rank, I think it is because dotplot is based on accuracy mean and 95% CI, and boxplot is based on the median, right? If so, which one we should mainly rely on if we really want to choose the best one? Or do you think it is fine to report either plot? Thanks!
Hey Jason, thanks for material you’ve put here. Really valuable.
I’ve spot-checked several algos and picked the top 2 from their avg accuracy. However, I run them all against my test data and the ones that scored highest actually didn’t perform well with unseen data and the ones that ranked 3,4 and 5 in my results actually performed better with unseen data. which results should be considered more relevant here, the ones you get from train-cv or the ones from looking at my test data?
Perhaps the hold out test set you’re using is small/not representative?
Perhaps focus on results from repeated k-fold cross-validation for model selection, then fit a final model on all data and start making predictions on new data?


Great work
Thanks!
great work Jason,
Thank you so much
Great reference. Thanks 🙂
Can you suggest an R-code if you have 50 models all with specific tuning grids to train, predict and compare?
I have one but its too slow.
Is this acceptable for non-parametric models? If not , can you suggest any method to select the best model?
Hi, may i know how do you interpret the results at the end where you compare the models (I.e. box plot & dot plot)? Is the best model the one with the highest accuracy in the box plot or the one with smaller box area (less deviance?)?
Thank you very much!
Great question Qiaojing, and really it is specific to your problem.
Maybe you are more interested in average performance or more interested in less uncertainity in performance.
Thanks, excellent post. Very useful!
I’m glad you found it useful Aldo.
Seriously, a great post that helps everyone!!
Thanks.
Nice post! For the purpose of discussion, what would you suggest in a situation where you’ve exhaustively explored feature selection and the top two models have roughly the same performance plots and the t-test gives a large p-value. In that case nothing can be concluded and I can’t find an obvious way to improve them. Would you take a look at the statistically relevant variables of each one? Flip a coin? Would you look at the complexity? Thanks! I really like that you include code in your posts.
For general advice on improving performance, see this post:
https://machinelearningmastery.com/machine-learning-performance-improvement-cheat-sheet/
You could try ensembles of well performing but uncorrelated models as well as ensembles on random subspaces of variables and see if anything interesting falls out.
Great work! very useful 😀
Thanks pablo.
Great Post!
Thanks, I’m glad to hear you liked it Calu.
I have learned to retrieve specific data from the summary object of this example like so:
test=summary(results)
print(test)
myMean=test$statistics$Accuracy[,4]
myModelName=names(myMean[1])
myModleVal=myMean[[myModelName]]
myIndex=length(myMean)
for(i in 1:myIndex){
myModelName=names(myMean[i])
myModelVal=myMean[[myModelName]]
print(myModelName)
print(myModelVal)
}
How do we generate or retrieve RMSE/MSE values from the summary object?
I got the following error, trying to implement own source data in this example:
> modelLvq <- train(n2~., data=series, method="lvq", trControl=control)
Error: wrong model type for regression
What's going wrong?
Perhaps check your data?
Is there a way to check which data is needed for a specific model?
I’m not sure what you mean. Your job is to define the data for the model, including feature engineering:
https://machinelearningmastery.com/discover-feature-engineering-how-to-engineer-features-and-how-to-get-good-at-it/
We cannot know what will work best, we must discover the features that best capture the behavior empirically.
I also get:
Error in terms.formula(formula, data = data) :
‘.’ in formula and no ‘data’ argument
Is there a hint? Is it because I no more have a #library(mlbench)?
What else is in mlbench?
I try to implement own source data in this example.
It has a column with a date and a column with numbers from 1 to 30.
I managed to replace data(PimaIndiansDiabetes) with a read_csv().
In the train section I say for example:
modelLvq <- train(n2~., data=series, method="lvq", trControl=control)
…where n2 is my column header.
Why do I get so much errors?
Warning messages:
1: In .local(x, …) : Variable(s) `' constant. Cannot scale data.
2: In nominalTrainWorkflow(x = x, y = y, wts = weights, info = trainInfo, :
There were missing values in resampled performance measures.
What are the crucial data structure depended parts of this example?
I can't see any more? Are there some in the closed source mlbench library?
mlbench is an R package:
https://cran.r-project.org/web/packages/mlbench/index.html
r1 = resamples( list (gbm_bc=gbm_bc , ada_yj= ada_y j) )
## here, gbm: gradient boosting, ada: adaboost
summary(r1)
This returns-
Call:
summary.resamples(object = results_bestmodel)
Models: logistic_yj, rf_nor, ada_yj, gbm_bc, svm_yj, knn_nor, neural_nor
Number of resamples: 0
Accuracy
Min. 1st Qu. Median Mean 3rd Qu. Max. NA’s
logistic_yj NA NA NA NaN NA NA 0
rf_nor NA NA NA NaN NA NA 0
ada_yj NA NA NA NaN NA NA 0
gbm_bc NA NA NA NaN NA NA 0
svm_yj NA NA NA NaN NA NA 0
knn_nor NA NA NA NaN NA NA 0
neural_nor NA NA NA NaN NA NA 0
What could be the reason behind this ? I had no problem comparing the gbm model to the other models and the adaBoost models to each other.
Perhaps there were some NaN values in your input data?
No, I checked using is.nan(),even is.infinite(). Moreover, there wasn’t any problem comparing the 3 AdaBoost models to each other. Anyway, I will keep looking. Thank you.
As far as I understand, the first parameter of train() means…
use ‘diabetes’ as outcome Y and use all other variables to predict Y.
A) What if we want to predict Y with Y?
modelLvq “<"- train(diabetes~., data=PimaIndiansDiabetes, method="lvq", trControl=control)
I tried: train(y=dataset$n2, x=dataset[, -which(colnames(dataset) == "n2")],
…but this leads to the message:
Something is wrong; all the RMSE metric values are missing.
B) I also would like to pass an external R-variable to that parameter.
Would this be possible? I tried paste() and sprintf(). But this doesn't work.
Till now I only can say it hard coded:
train(n2~.,[…]
Any suggestions here?
Update: Got B) by further research:
f <- n2~.
http://www.learnbymarketing.com/741/using-the-caret-package-in-r/
I would suggest learning some basic R syntax before diving into caret.
Perhaps start here:
https://machinelearningmastery.com/r-crash-course-for-developers/
Thank you Jason, the article was wonderful and super easy to understand.
Now I have a complete pipeline including…
– an interactive command prompt to choose tests in Python or R with different parameters
– a database filled with test results
– an Excel dashboard to analyse and visualize my results.
Ten different, running experiments with own data are currently available.
Except from specific ‘algo-questions’, the only general thing I don’t understand is question A) from above.
I googled a lot. And some say there will one day a unified syntax for the x and y parameter of Carets train() function.
Do you have some additional insights regarding to this problem, Jason?
Thank you so far.
I have done gradient boosting using your code. For other machine learning techniques, I can divide into train and test data, then use the predict function and the confusionMatrix function to obtain the accuracy. How do I know the accuracy of gradient boosting???? If I use predict and confusionMatrix, I get an error. Is the accuracy shown as AUC, not numeric?
I would recommend making predictions and calculating the accuracy. Caret can do this for you.
What does the function resamples() in this case?
Try: ?resamples to learn more.
Or here:
https://topepo.github.io/caret/model-training-and-tuning.html
Hm…the documentation says:
These functions provide methods for collection, analyzing and visualizing a set of resampling results from a common data set.
Later on the site you mentioned:
Given these models, can we make statistical statements about their performance differences? To do this, we first collect the resampling results using resamples.
So I would say the function ‘resamples()’ is a kind of tool to compare model performances, trained within caret.
Hi,
Nice post but when I am running the code for the model train, it is giving me below error, not sure why I am getting the same. Can you please help.
modelLvq # train the GBM model
> set.seed(7)
> modelGbm <- train(diabetes~., data=PimaIndiansDiabetes, method="gbm", trControl=control, verbose=FALSE)
Error in train(diabetes ~ ., data = PimaIndiansDiabetes, method = "gbm", :
unused arguments (data = PimaIndiansDiabetes, method = "gbm", trControl = control, verbose = FALSE)
The API may have changed.
Hi Jason,
Your post is really helpful. A nice job 🙂
Thank for all.
But, do you know the best way to recovery the coefficient of a model fitted by caret ? Because I failed to do this. Like… model$FinalModel$coefficients return NULL for example.
Thanks in advance,
Have a good day
Célia
Jason, this is such a great piece of work! Thank you.
I just want to check something. Does this spare us from splitting the data into train/test and validating the models by predicting the testing data? I.e. Do the accuracies ‘resampled’ reflect the in-sample-errors or they also cover the out-of-sample errors? Do we have to do any further validation on testing data?
Appreciated.
They are an estimate of the out of sample errors.
I am trying to run this on a problem that is not classification (ie regression). Is there an equivalent model to LVQ for regression?
I believe there is. Sorry, I don’t have an example on hand.
Good article,
Is there a cheat sheet that shows which models perfoms best for particulear data sets e.g classification inseparable versu separable data?
What about linear regression?
It is not knowable, you must try a suite of methods and discover what works best for your problem. More here:
https://machinelearningmastery.com/faq/single-faq/what-algorithm-config-should-i-use
How does train select the best sigma and cost parameters if you do specify them, for svmRadial in particular?
It does not, it uses default values. You must use a grid search to find the best hyperparameter values for your dataset.
Dear Jason,
I hope you are doing well,
Please, do you have a comparison for regression models performance?
I will appreciate your help,
KJ
Yes, many. Perhaps start here:
https://machinelearningmastery.com/spot-check-machine-learning-algorithms-in-r/
when i run it I am getting the following error:
> results <- resamples(list(decision_tree=fitdt, logistic_regresion=lm.fitlog,random_forest=lm.fitrandom))
Warning message:
In resamples.default(list(decision_tree = fitdt, logistic_regresion = lm.fitlog, :
Some performance measures were not computed for each model: Accuracy, Kappa, MAE, RMSE, Rsquared
This is literally the best site of ML! I can always find useful and simple information! Thanks from Brazil!
Thanks.
Thank you!
You’re welcome.
Hi Jason,
Wonderful post! I wonder sometimes the dotplot and boxplot generate different model performance rank, I think it is because dotplot is based on accuracy mean and 95% CI, and boxplot is based on the median, right? If so, which one we should mainly rely on if we really want to choose the best one? Or do you think it is fine to report either plot? Thanks!
Thanks!
I don’t recall sorry, you might want to check the documentation.
Hey Jason, thanks for material you’ve put here. Really valuable.
I’ve spot-checked several algos and picked the top 2 from their avg accuracy. However, I run them all against my test data and the ones that scored highest actually didn’t perform well with unseen data and the ones that ranked 3,4 and 5 in my results actually performed better with unseen data. which results should be considered more relevant here, the ones you get from train-cv or the ones from looking at my test data?
cheers.
You’re welcome.
Perhaps the hold out test set you’re using is small/not representative?
Perhaps focus on results from repeated k-fold cross-validation for model selection, then fit a final model on all data and start making predictions on new data?