This is a guest post by Igor Shvartser, a clever young student I have been coaching.
This post is part 3 in a 3 part series on modeling the famous Pima Indians Diabetes dataset that will investigate improvements to the classification accuracy and present final results (update: download from here).
In Part 1 we defined the problem and looked at the dataset, describing observations from the patterns we noticed in the data. In Part 2 we defined the experimental methodology and presented initial results.
Kick-start your project with my new book Machine Learning Mastery With Weka, including step-by-step tutorials and clear screenshots for all examples.
Improving Results
To improve results, we can turn to ensemble methods like boosting. Boosting is an ensemble method that starts out with a base classifier that is prepared on the training data. A second classifier is then created behind it to focus on the instances in the training data that the first classifier got wrong.
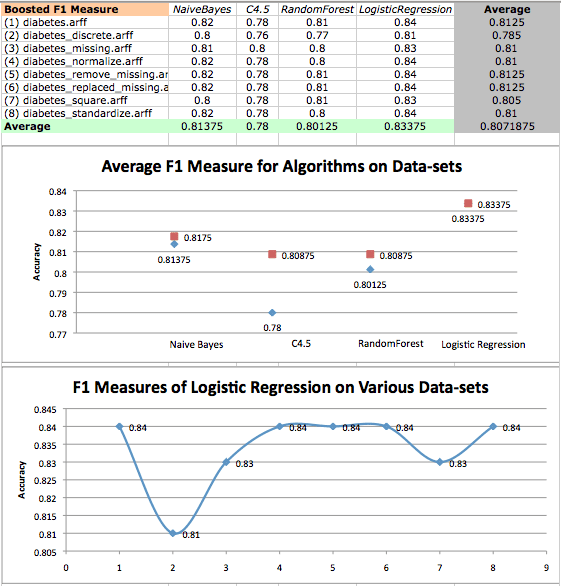
The process continues to add classifiers until a limit is reached in the number of models or accuracy. Boosting is provided in Weka in the AdaBoostM1 (adaptive boosting) algorithm. The results are shown below:
Boosted algorithm accuracy averages on diabetes datasets and a scatterplot of logistic regression performance on various datasets. Original results are in red, while boosted results are in blue.
It’s clear that boosting had no effect on LogisticRegression, but significantly worsened the performance of the tree algorithms. According to the results from Weka’s Experimenter, the performance of the boosted LogisticRegression has a statistically significant difference compared to results given by the boosted C4.5, RandomForest, and boosted RandomForest.
Since RandomForest already includes an ensemble method, bagging, the addition of boosting may be causing overfitting which therefore could explain the poor performance.
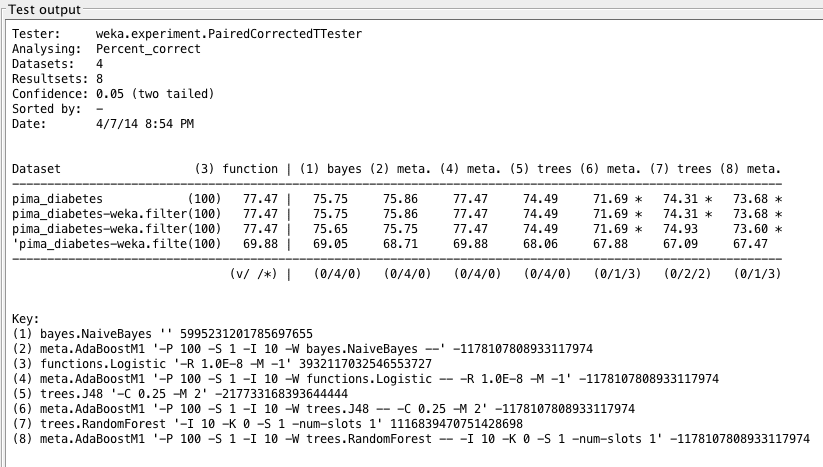
Weka Experimenter output comparing performance of Boosted Logistic Regression with performance of other algorithms.
In any case, we are still unable to exceed the accuracy of 77.47% with the best performing algorithm, LogisticRegression. This may be due to limitations of the data or a low cross-validation value. We find that in some cases, such as with C4.5, accuracy drops drastically from 74.28% to 71.4% after performing AdaBoost.
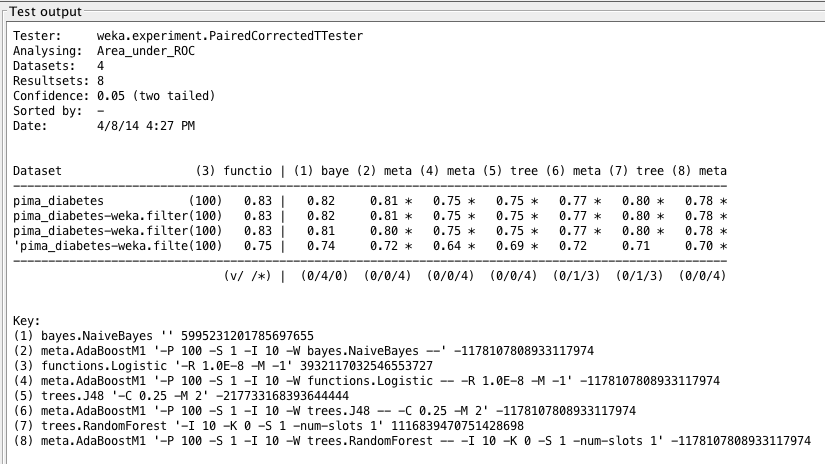
Next we’ll take a look at ROC area for each boosted algorithm.
Boosted algorithm ROC area averages on diabetes datasets and a scatterplot of logistic regression performance on various datasets. Original results are in red, while boosted results are in blue.
We can see that the points on the scatter plot form a smoother trend. In other words, the variance between data points is smaller. Our results here are quite interesting: all boosted algorithms except for C4.5 show a lesser value for ROC area. That means boosting C4.5 gives slightly less false positives and slightly more true positives compared with other boosted algorithms.
Weka Experimenter output comparing ROC curve area of Logistic Regression with ROC curve area of other algorithms.
On a first look this seems a bit strange: boosting C4.5 gives a decreased accuracy, but an increased ROC area. The differences are clear if we consider that accuracy is actually a summary of true positives and false positives, whereas ROC area is an integration of hit rate and false alarm rate. Either way, we find that the boosted C4.5 has a statistically significant difference compared to those results given by LogisticRegression (both default and boosted forms).
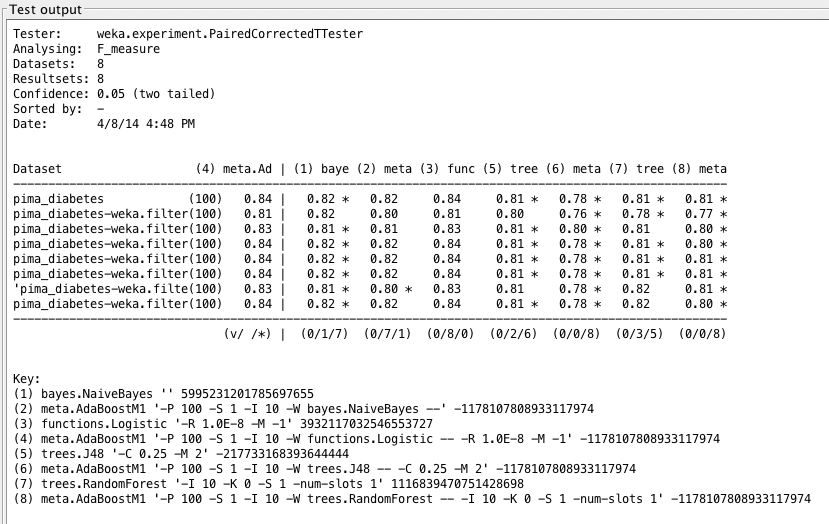
Finally, we’ll take a look at F1 measure for boosted algorithms.
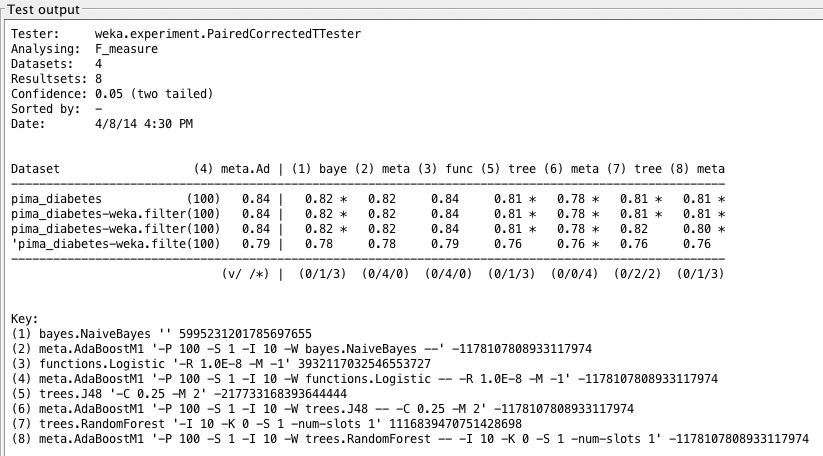
Boosted F1 Measure values on diabetes datasets and a scatterplot of logistic regression F1 measures on various datasets. Original results are in red, while boosted results are in blue.
Once again, we find that LogisticRegression performs quite well, but boosting has no effect on LogisticRegression when analyzing F1 measure. We seem to have pushed the limit of LogisticRegression, and once again see that it is statistically dominant over tree algorithms.
Weka Experimenter output comparing F1 score of Boosted Logistic Regression with F1 scores of other algorithms.
Need more help with Weka for Machine Learning?
Take my free 14-day email course and discover how to use the platform step-by-step.
Click to sign-up and also get a free PDF Ebook version of the course.
Removing Attributes to Test Assumptions
We may also be interested in changing the study to make it non-invasive, and therefore analyzing an algorithm’s performance on only four attributes: mass, skin, age, and pedi. This could help by allowing medical professionals administer the diabetes mellitus test over a larger scale and making the test faster. Of course with these advantages we may lose some accuracy.
Based on what we saw in scatter plots of the data, I believe our algorithms will perform quite well on the dataset, but not as well as with the standard dataset. Creating a new dataset (and naming it diabetes_noninvasive.arff) was a way to test our own assumptions on the onset of diabetes, namely that the risk increases with obesity and older age. In a similar fashion, I was able to remove attributes using Weka Explorer, and then analyze algorithm performance using Weka Experimenter. The results are shown below:
Algorithm accuracy averages on invasive and noninvasive diabetes datasets. Non-invasive results are in red, while original results are in blue.
Weka Experimenter output comparing performance of Logistic Regression with performance of other algorithms.
Through all metrics, as predicted, the noninvasive dataset did not provide very accurate results. We find similar trends as we did in the earlier analysis, namely that LogisticRegression still performs most accurately.
Algorithm ROC area averages on invasive and noninvasive diabetes datasets. Non-invasive results are in red, while original results are in blue.
Weka Experimenter output comparing ROC area of Logistic Regression with ROC area of other algorithms.
Our results for the noninvasive test are actually comparable to those of the standard dataset. We may find that this fall in accuracy can be costly in the long run, but we could probably use this test as a precursor to an official diabetes mellitus test. With today’s technology, a noninvasive test can be performed online to predict the onset of diabetes — given we are okay with a bit more error — and can then suggest to a patient if further testing is necessary.
Algorithm F1 measure averages on invasive and noninvasive diabetes datasets. Non-invasive results are in red, while original results are in blue.
Weka Experimenter output comparing F1 measure of Boosted Logistic Regression with F1 measure of other algorithms.
Conclusion
In this study, we compared the performance of various algorithms and found that Logistic Regression performed well on the standard, unaltered dataset. We tried to understand how different altered datasets affected our results.
Moreover, we paid close attention to LogisticRegression, and analyzed its performance throughout various metrics. The work here gave me a better understanding of machine learning applications in medical diagnosis. This was also an important lesson on data transforms and algorithm analysis.
It is somewhat unfortunate that many medical datasets are small (this may be due to patient confidentiality), since a larger dataset would give us more flexibility and robustness in analysis. However, I strongly believe that this study is a good start for building methods that help diagnose patients, and bridge the gap between doctors and large datasets.
The reason for the better performance of logistic regression, compared to other classifier has to do with the fact that the dataset can easily be differentiated linearly. Hence, a linear approach is more appropriate. The size of the dataset is good enough, given that the predictors (independent variables) are independent.
A sample of 240 observations will be adequate in this case, just because the characteristics of the independent variables (mostly well behaved)


")
")
")
")

")
The reason for the better performance of logistic regression, compared to other classifier has to do with the fact that the dataset can easily be differentiated linearly. Hence, a linear approach is more appropriate. The size of the dataset is good enough, given that the predictors (independent variables) are independent.
A sample of 240 observations will be adequate in this case, just because the characteristics of the independent variables (mostly well behaved)
Thanks for the tip.